Zilia
Zilia is a commune in the Haute-Corse department of France on the island of Corsica.
Zilia | |
|---|---|
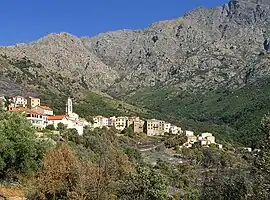
 A general view of Zilia | |
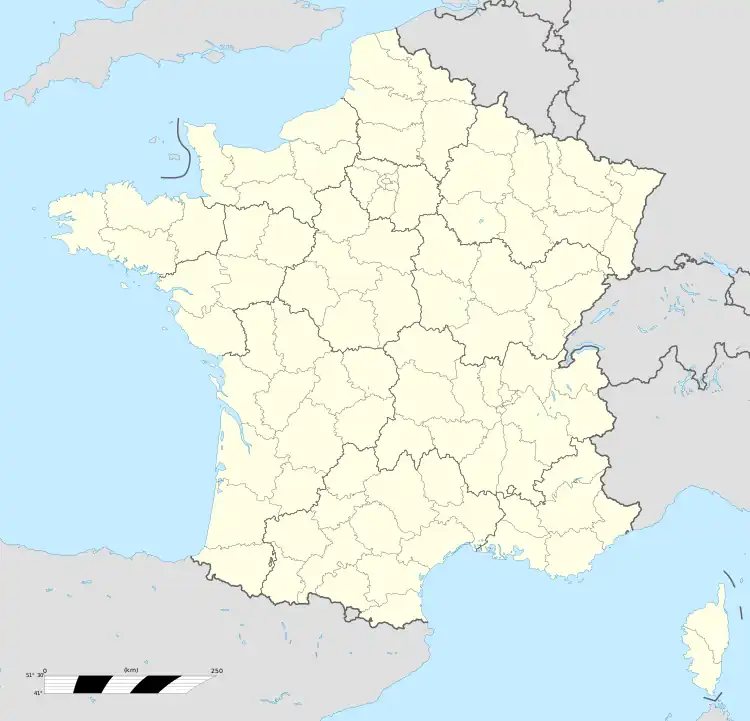
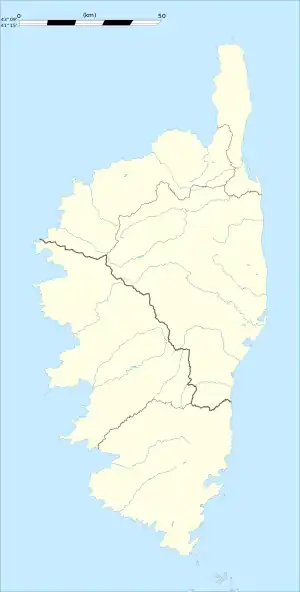
Location of Zilia | |
 Zilia  Zilia | |
| Coordinates: 42°31′52″N 8°54′06″E | |
| Country | France |
| Region | Corsica |
| Department | Haute-Corse |
| Arrondissement | Calvi |
| Canton | Calvi |
| Intercommunality | Calvi Balagne |
| Government | |
| • Mayor (2020–2026) | Jacques Santelli[1] |
| Area 1 | 14.01 km2 (5.41 sq mi) |
| Population | 298 |
| • Density | 21/km2 (55/sq mi) |
| Demonym(s) | Ziliais, Ziliaises |
| Time zone | UTC+01:00 (CET) |
| • Summer (DST) | UTC+02:00 (CEST) |
| INSEE/Postal code | 2B361 /20214 |
| Elevation | 172–1,935 m (564–6,348 ft) (avg. 400 m or 1,300 ft) |
| 1 French Land Register data, which excludes lakes, ponds, glaciers > 1 km2 (0.386 sq mi or 247 acres) and river estuaries. | |
Geography
The municipality is part of the canton of Calvi. Its area is 1,401 hectares (3,460 acres) which includes 700 hectares (1,700 acres) of woods. The village itself is situated at an altitude of 278 metres (912 ft) at the foot of the Monte Grosso (1,938 metres or 6,358 feet), 7 kilometres (4.3 mi) north-east of Calvi, the capital.
One road, the D 151, serves the village and links it directly to Calenzana and Montegrosso.
History
Zilia is known for both vineyards as well a mineral spring which was operated before 1914 and again recently. The water sells throughout the island under the name of Zilia bottled water, both flat and carbonated.
The village suffered a huge fire on the night of 31 June 2005 at Calenzana and destroyed 1500ha of vegetation including many old olive trees in Balagne.
Population
|
| ||||||||||||||||||||||||||||||||||||||||||||||||||||||||||||||||||||||||||||||||||||||||||||||||||||||||||||||||||||||||||||||||||||||||||||||||
| Source: EHESS (1793-2006)[3] and INSEE[4][5] | |||||||||||||||||||||||||||||||||||||||||||||||||||||||||||||||||||||||||||||||||||||||||||||||||||||||||||||||||||||||||||||||||||||||||||||||||
References
- "Répertoire national des élus: les maires" (in French). data.gouv.fr, Plateforme ouverte des données publiques françaises. 13 September 2022.
- "Populations légales 2020". The National Institute of Statistics and Economic Studies. 29 December 2022.
- Des villages de Cassini aux communes d'aujourd'hui: Commune data sheet Zilia, EHESS (in French).
- Population en historique depuis 1968, INSEE
- Historique des populations légales