Biomass
Biomass is plant-based material used as fuel to produce heat or electricity. Examples are wood and wood residues, energy crops, agricultural residues, and waste from industry, farms and households.[1] Since biomass can be used as a fuel directly (e.g. wood logs), some people use the words biomass and biofuel interchangeably. Others subsume one term under the other.[lower-alpha 1] Government authorities in the US and the EU define biofuel as a liquid or gaseous fuel, used for transportation.[lower-alpha 2][lower-alpha 3] The European Union's Joint Research Centre use the concept solid biofuel and define it as raw or processed organic matter of biological origin used for energy, for instance firewood, wood chips and wood pellets.[lower-alpha 4]
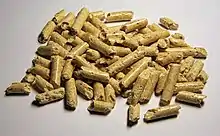
In 2019, 57 EJ (exajoules) of energy were produced from biomass, compared to 190 EJ from crude oil, 168 EJ from coal, 144 EJ from natural gas, 30 EJ from nuclear, 15 EJ from hydro and 13 EJ from wind, solar and geothermal combined.[2][lower-alpha 5] Approximately 86% of modern bioenergy is used for heating applications, with 9% used for transport and 5% for electricity.[lower-alpha 6] Most of the global bioenergy is produced from forest resources.[lower-alpha 7] Power plants that use biomass as fuel can produce a stable power output, unlike the intermittent power produced by solar or wind farms.[lower-alpha 8]
In 2017, the IEA (International Energy Agency) described bioenergy as the most important source of renewable energy.[lower-alpha 9] The IEA also argued that the current rate of bioenergy deployment is well below the levels required in future low carbon scenarios, and that accelerated deployment is urgently needed.[lower-alpha 10][lower-alpha 11] In IEA's Net Zero by 2050 scenario, traditional[lower-alpha 12] bioenergy is phased out by 2030, and modern bioenergy's share of the total energy supply increases from 6.6% in 2020 to 13.1% in 2030 and 18.7% in 2050.[3] In 2014, IRENA (International Renewable Energy Agency) projected a doubling of energy produced from biomass in 2030, with a small contribution from traditional bioenergy (6 EJ).[lower-alpha 13] The IPCC (Intergovernmental Panel on Climate Change) argue that bioenergy has a significant climate mitigation potential if done right,[lower-alpha 14][lower-alpha 15] and most of the IPCC's mitigation pathways include substantial contributions from bioenergy in 2050 (average at 200 EJ.)[lower-alpha 16][lower-alpha 17][4] Some researchers criticize the use of bioenergy with low emission savings, high initial carbon intensities and/or long waiting times before positive climate impacts materialize.[5]
The raw material feedstocks with the largest potential in the future is lignocellulosic (non-edible) biomass (for instance coppices or perennial energy crops), agricultural residues, and biological waste. These feedstocks also have the shortest delay before producing climate benefits. Heat production is normally more "climate friendly" than electricity production, since the conversion from chemical to heat energy is more efficient than the conversion from chemical to electrical energy. Heat from biomass combustion is also harder to replace with heat from alternative renewable energy sources; these are either more costly or constrained by the maximum temperature of the steam they can deliver.[lower-alpha 18] Solid biofuel is likely more climate friendly than liquid biofuel, since the production of solid biofuel is more energy efficient.
Biomass categories
Biomass is categorized either as biomass harvested directly for energy (primary biomass), or as residues and waste: (secondary biomass):[lower-alpha 19][lower-alpha 20]
Biomass harvested directly for energy
The main biomass types harvested directly for energy is wood, some food crops and all perennial energy crops:
Woody biomass harvested directly for energy consists mainly of trees and bushes harvested for traditional cooking and heating purposes (mostly in developing countries.) 25 EJ per year is spent on traditional cooking and heating globally.[6] The IEA argues that traditional bioenergy is not sustainable and in its Net Zero by 2050 scenario it is phased out already in 2030. Short-rotation coppices[lower-alpha 21] and short-rotation forests[lower-alpha 22] are also harvested directly for energy and the energy content provided is 4 EJ.[6] These crops are seen as sustainable, and the potential (together with perennial energy crops) is estimated to at least 25 EJ annually by 2050.[6][lower-alpha 23]
The main food crops harvested for energy are sugar-producing crops (e.g. sugarcane), starch-producing crops (e.g. corn) and oil-producing crops (e.g. rapeseed).[7] Sugarcane is a perennial crop, while corn and rapeseed are annual crops. Sugar- and starch-producing crops are used to make bioethanol, and oil-producing crops are used to make biodiesel. USA is the largest producer of bioethanol, while EU is the largest producer of biodiesel.[8] The energy content in the global production of bioethanol and biodiesel is 2.2 and 1.5 EJ per year, respectively.[9] Biofuel from food crops harvested for energy is also called "first-generation" or "traditional" biofuel, and has relatively low emission savings.

Perennial energy crops are seen as the "[...] preferred category of crops for energy production [...]" because of high yields and "[...] a (much) better ecological profile than annual crops [...]".[11] However, the commercial production of these crops is currently not significant on a global scale.[lower-alpha 24] In the UK, the government declared in 2021 that land areas set aside for perennial energy crops and short rotation forestry will increase from 10.000 up to 704.000 hectares.[lower-alpha 25] IRENA's global estimate for 2030 is 33–39 EJ, which is considered conservative.[12] The technical global energy potential for perennial energy crops alone has been estimated to 300 EJ annually.[lower-alpha 26]
According to IRENA, 1.5 billion hectares (3.7×10⁹ acres) of land is currently used for food production, while "[...] about 1.4 billion ha [hectares] additional land is suitable but unused to date and thus could be allocated for bioenergy supply in the future."[13] 60% of this land area is held by only 13 countries however.[lower-alpha 27] The IPCC estimates that there is between 0.32 and 1.4 billion hectares of marginal land suitable for bioenergy in the world.[lower-alpha 28] The EU project MAGIC (Marginal Lands for Growing Industrial Crops) estimates that there is 45 million hectares (449 901 km2; comparable to Sweden in size) of available marginal land suitable for the perennial crop Miscanthus × giganteus in the European Union (12 EJ)[lower-alpha 29] and 62 million hectares (619 182 km2; comparable to the Ukraine in size) of available marginal land suitable for bioenergy in general.[14]
One third of the global forest area of 4 billion hectares is used for wood production or other commercial purposes.[15] Forests provide 85% of all biomass used for energy globally.[lower-alpha 7] Forests also provide 60% of all biomass used for energy in the EU,[16] and the largest forest biomass energy source is wood residues and waste.[17]
Biomass in the form of residues and waste
Residues and waste are by-products from biological material harvested mainly for non-energy purposes. The most important by-products are wood residues, agricultural residues and municipal/industrial waste:
Wood residues are by-products from forestry operations or from the wood processing industry. Had the residues not been collected and used for bioenergy, they would have decayed (and therefore produced emissions)[lower-alpha 30] on the forest floor or in landfills, or been burnt (and produced emissions) at the side of the road in forests or outside wood processing facilities.[18]

The by-products from forestry operations are called logging residues or forest residues, and consist of tree tops, branches, stumps, damaged or dying or dead trees, irregular or bent stem sections, thinnings (small trees that are cleared away in order to help the bigger trees grow large), and trees removed to reduce wildfire risk.[lower-alpha 31] The extraction level of logging residues differ from region to region,[lower-alpha 32][lower-alpha 33] but there is an increasing interest in using this feedstock,[lower-alpha 34] since the sustainable potential is large (15 EJ annually).[lower-alpha 35] 68% of the total forest biomass in the EU consists of wood stems, and 32% consists of stumps, branches and tops.[19]
The by-products from the wood processing industry are called wood processing residues and consist of cut offs, shavings, sawdust, bark, and black liquor.[lower-alpha 36] Wood processing residues have a total energy content of 5.5 EJ annually.[20] Wood pellets are mainly made from wood processing residues,[lower-alpha 37] and have a total energy content of 0.7 EJ.[lower-alpha 38] Wood chips are made from a combination of feedstocks,[21] and have a total energy content of 0.8 EJ.[lower-alpha 39]
The energy content in agricultural residues used for energy is approximately 2 EJ.[lower-alpha 40] However, agricultural residues has a large untapped potential. The energy content in the global production of agricultural residues has been estimated to 78 EJ annually, with the largest share from straw (51 EJ).[lower-alpha 41] Others have estimated between 18 and 82 EJ.[lower-alpha 42] IRENA expect that use of agricultural residues and waste that is both sustainable and economically feasible[lower-alpha 43] will increase to between 37 and 66 EJ in 2030.[lower-alpha 44]
Municipal waste produced 1.4 EJ and industrial waste 1.1 EJ.[2] Wood waste from cities and industry also produced 1.1 EJ.[20] The sustainable potential for wood waste has been estimated to 2–10 EJ.[22] IEA recommends a dramatic increase in waste utilization to 45 EJ annually in 2050.[3]
Biofuel from perennial energy crops, residues and waste is sometimes called "second-generation" or "advanced" biofuel (i.e. non-edible biomass). Algae harvested for energy is sometimes called "third-generation" biofuel.[lower-alpha 45][23] Because of high costs, commercial production of biofuel from algae has not materialized yet.[24]
Biomass conversion
Raw biomass can be upgraded into better and more practical fuel simply by compacting it (e.g. wood pellets), or by different conversions broadly classified as thermal, chemical, and biological:[25]
Thermal conversion
Thermal upgrading produces solid, liquid or gaseous fuels, with heat as the dominant conversion driver. The basic alternatives are torrefaction, pyrolysis, and gasification, these are separated principally by how far the chemical reactions involved are allowed to proceed. The advancement of the chemical reactions is mainly controlled by how much oxygen is available, and the conversion temperature.
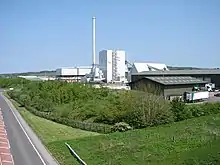
Torrefaction is a mild form of pyrolysis where organic materials are heated to 400–600 °F (200–300 °C) in a no–to–low oxygen environment.[26][27] The heating process removes (via gasification) the parts of the biomass that has the lowest energy content, while the parts with the highest energy content remain. That is, approximately 30% of the biomass is converted to gas during the torrefaction process, while 70% remains, usually in the form of compacted pellets or briquettes. This solid product is water resistant, easy to grind, non-corrosive, and it contains approximately 85% of the original biomass energy.[28] Basically the mass part has shrunk more than the energy part, and the consequence is that the calorific value of torrefied biomass increases significantly, to the extent that it can compete with coals used for electricity generation (steam/thermal coals). The energy density of the most common steam coals today is 22–26 GJ/t.[29] There are other less common, more experimental or proprietary thermal processes that may offer benefits, such as hydrothermal upgrading (sometimes called "wet" torrefaction.)[lower-alpha 46] The hydrothermal upgrade path can be used for both low and high moisture content biomass, e.g. aqueous slurries.[30]
Pyrolysis entails heating organic materials to 800–900 °F (400–500 °C) in the near complete absence of oxygen. Biomass pyrolysis produces fuels such as bio-oil, charcoal, methane, and hydrogen. Hydrotreating is used to process bio-oil (produced by fast pyrolysis) with hydrogen under elevated temperatures and pressures in the presence of a catalyst to produce renewable diesel, renewable gasoline, and renewable jet fuel.[31]
Gasification entails heating organic materials to 1,400–1700 °F (800–900 °C) with injections of controlled amounts of oxygen and/or steam into the vessel to produce a carbon monoxide and hydrogen rich gas called synthesis gas or syngas. Syngas can be used as a fuel for diesel engines, for heating, and for generating electricity in gas turbines. It can also be treated to separate the hydrogen from the gas, and the hydrogen can be burned or used in fuel cells. The syngas can be further processed to produce liquid fuels using the Fischer-Tropsch synthesis process.[25][32]
Chemical conversion
A range of chemical processes may be used to convert biomass into other forms, such as to produce a fuel that is more practical to store, transport and use, or to exploit some property of the process itself. Many of these processes are based in large part on similar coal-based processes, such as the Fischer-Tropsch synthesis.[33] A chemical conversion process known as transesterification is used for converting vegetable oils, animal fats, and greases into fatty acid methyl esters (FAME), which are used to produce biodiesel.[25]
Biological conversion
As biomass is a natural material, many biological processes have developed in nature to break down the biomass molecules, and many of these conversion processes can be harnessed. In most cases, microorganisms are used to perform the conversion process: anaerobic digestion, fermentation, and composting. Fermentation converts biomass into bioethanol, and anaerobic digestion converts biomass into renewable natural gas. Bioethanol is used as a vehicle fuel. Renewable natural gas—also called biogas or biomethane—is produced in anaerobic digesters at sewage treatment plants and at dairy and livestock operations. It also forms in and may be captured from solid waste landfills. Properly treated renewable natural gas has the same uses as fossil fuel natural gas.[25]
IRENA argues that the success of large-scale international bioenergy trade require biomass conversion in order to transport high density commodities at low costs.[lower-alpha 47]
Climate impact
| Part of a series on |
| Renewable energy |
|---|
 |
|
|
| Part of a series on |
| Sustainable energy |
|---|
 |
|
Earlier the use of woody biomass for bioenergy was generally considered carbon neutral. However, when researchers started to calculate the effects of land use change[lower-alpha 48] and old growth forest logging, the situation changed.[34] Currently there is a lively debate going on about the real carbon intensity of a number of bioenergy pathways, including from forestry. The critics are especially concerned about short-term or medium-term climate effects. Critics have emerged both among researchers[lower-alpha 49] and environmental activists.[lower-alpha 50][lower-alpha 51] At the same time, bioenergy supporters in influential research organizations like the IPCC, IEA, and EU's Joint Research Centre still argue that bioenergy is climate friendly when done right (see below). In the following, the main scientific arguments of this debate will be presented.
Carbon accounting principles
Different carbon accounting methodologies have a significant impact on the calculated results and therefore on the scientific arguments. Generally, the purpose of carbon accounting is to determine the carbon intensity of an energy scenario, i.e. whether it is carbon positive, carbon neutral or carbon negative. Carbon positive scenarios are likely to be net emitters of CO2, carbon negative projects are net absorbers of CO2, while carbon neutral projects balance emissions and absorption perfectly.[lower-alpha 52]
As a consequence of both natural causes and human practices, carbon continually flows between carbon pools, for instance the atmospheric carbon pool, the forest carbon pool, the harvested wood products carbon pool, and the fossil fuels carbon pool. When the carbon level in pools other than the atmospheric carbon pool increase, the carbon level in the atmosphere decrease, which helps mitigate global warming.[lower-alpha 53] If a researcher measures the amount of carbon moving from one pool to another, they can gain insight and recommend practices that maximize the amount of carbon stored in carbon pools other than the atmospheric carbon pool. Three concepts are especially important, namely carbon debt, carbon payback time and carbon parity time:
Carbon debt accrues when biomass is removed from growing sites, for instance forests. It is counted when the trees are felled because the UNFCCC (the UN organization that countries report their emissions to) has decided that emissions should be counted already at this point in time, instead of at the combustion event.[lower-alpha 54]
Carbon payback time is the time it takes before this carbon is "paid back" to the forest, by having the forest re-absorb an equivalent amount of carbon from the atmosphere.
Carbon parity time is the time it takes for one energy scenario to reach carbon parity with another scenario (i.e. store the same amount of carbon as another scenario.)[lower-alpha 55] One of these scenarios can for instance be a bioenergy scenario, with carbon counted as stored in the part of the forest that was not harvested, and carbon counted as lost for the amount of forest that were harvested (cf. the UNFCCC rule mentioned above.) However, the amount of carbon that resides in woody construction materials and biofuels made from this harvest can be "counted back" into the bioenergy scenario's carbon pools for the amount of time it takes before this carbon decays naturally or are burnt for energy. The alternative scenario can for instance be a forest protection scenario, with carbon counted as stored in the whole forest – a forest that is bigger than in the bioenergy scenario because no trees were harvested at all, and in addition also continued to grow (while waiting for the carbon stored in the bioenergy scenario to catch up to its own carbon level.)[lower-alpha 56] However, the implied "lock-in" of carbon in the forest also means that this carbon no longer is available for production of woody construction materials and biofuels, which means that these have to be replaced by other sources. In most cases, the most realistic sources are fossil sources, which means that the forest protection scenario here will be "punished" by having the fossil fuel emissions it is responsible for subtracted from its carbon pool. (Note that this fossil carbon is often instead technically speaking counted as added to the bioenergy carbon pool (instead of subtracted from the no-bioenergy carbon pool), and called "displaced" or "avoided" fossil carbon.)
A net carbon debt for the bioenergy scenario is calculated when the net amount of carbon stored in the forest protection scenario's carbon pool is larger than the net amount of carbon stored in the bioenergy scenario's carbon pools. A net carbon credit for the bioenergy scenario is calculated when the net amount of carbon stored in the forest protection scenario's carbon pool is smaller than the net amount of carbon stored in the bioenergy scenario's carbon pools.[35] The carbon parity time then is the time it takes for the bioenergy scenario to go from debt to credit.[lower-alpha 57]
To recap, a project or scenario can be assessed solely on its own merits, specifically the time it takes to pay back removed carbon (carbon payback time.) However, it is common to include alternative scenarios (also called "reference scenarios" or "counterfactuals") for comparison.[lower-alpha 58] When there is more than one scenario, carbon parity times between these scenarios can be calculated. The alternative scenarios range from scenarios with only modest changes compared to the existing project, all the way to radically different ones (i.e. forest protection or "no-bioenergy" counterfactuals.) Generally, the difference between scenarios is seen as the actual carbon mitigation potential of the scenarios.[lower-alpha 59] In other words, quoted emission savings are relative savings; savings relative to some alternative scenario the researcher suggest. This gives the researcher a large amount of influence over the calculated results.
Carbon accounting system boundaries

In addition to the choice of alternative scenario, other choices has to be made as well. The so-called "system boundaries" determine which carbon emissions/absorptions that will be included in the actual calculation, and which that will be excluded. System boundaries include temporal, spatial, efficiency-related and economic boundaries:[lower-alpha 60]
Temporal system boundaries
The temporal boundaries define when to start and end carbon counting. Sometimes "early" events are included in the calculation, for instance carbon absorption going on in the forest before the initial harvest. Sometimes "late" events are included as well, for instance emissions caused by end-of-life activities for the infrastructure involved, e.g. demolition of factories. Since the emission and absorption of carbon related to a project or scenario changes with time, the net carbon emission can either be presented as time-dependent (for instance a curve which moves along a time axis), or as a static value; this shows average emissions calculated over a defined time period.
The time-dependent net emission curve will typically show high emissions at the beginning (if the counting starts when the biomass is harvested.) Alternatively, the starting point can be moved back to the planting event; in this case the curve can potentially move below zero (into carbon negative territory) if there is no carbon debt from land use change to pay back, and in addition more and more carbon is absorbed by the planted trees. The emission curve then spikes upward at harvest. The harvested carbon is then being distributed into other carbon pools, and the curve moves in tandem with the amount of carbon that is moved into these new pools (Y axis), and the time it takes for the carbon to move out of the pools and return to the forest via the atmosphere (X axis). As described above, the carbon payback time is the time it takes for the harvested carbon to be returned to the forest, and the carbon parity time is the time it takes for the carbon stored in two competing scenarios to reach the same level.[lower-alpha 61]
The static carbon emission value is produced by calculating the average annual net emission for a specific time period. The specific time period can be the expected lifetime of the infrastructure involved (typical for life cycle assessments; LCA's), policy relevant time horizons inspired by the Paris agreement (for instance remaining time until 2030, 2050 or 2100),[36] time spans based on different global warming potentials (GWP; typically 20 or 100 years),[lower-alpha 62] or other time spans. In the EU, a time span of 20 years is used when quantifying the net carbon effects of a land use change.[lower-alpha 63] Generally in legislation, the static number approach is preferred over the dynamic, time-dependent curve approach. The number is expressed as a so-called "emission factor" (net emission per produced energy unit, for instance kg CO2e per GJ), or even simpler as an average greenhouse gas savings percentage for specific bioenergy pathways.[lower-alpha 64] The EU's published greenhouse gas savings percentages for specific bioenergy pathways used in the Renewable Energy Directive (RED) and other legal documents are based on life cycle assessments (LCA's).[lower-alpha 65][lower-alpha 66]
Spatial system boundaries
The spatial boundaries define "geographical" borders for carbon emission/absorption calculations. The two most common spatial boundaries for CO2 absorption and emission in forests are 1.) along the edges of a particular forest stand and 2.) along the edges of a whole forest landscape, which include many forest stands of increasing age (the forest stands are harvested and replanted, one after the other, over as many years as there are stands.) A third option is the so-called increasing stand level carbon accounting method:
– In stand level carbon accounting, the researcher may count a large emission event when the stand is harvested, followed by smaller, annual absorption amounts during the accumulation phase that continues until the stand has reached a mature age and is harvested again.
– Likewise, in increasing stand level accounting, the researcher counts a large emission event when the stand is harvested, followed by absorption of smaller quantities of carbon each year during the accumulation period. However, one year after the first harvest, a new stand is harvested. The researcher do not count the carbon that was absorbed in this second stand after the first, neighbouring stand was harvested, only the large emission at the harvest event of the second stand. The next year the same procedure repeats for the third stand; the carbon that was absorbed by this stand after the harvest of the first and second stand is not counted, while a large emission amount is counted when the third stand is harvested. In other words, in increasing stand level accounting the whole carbon account is composed of a number of individual stand-level accounts, each with its own, individual starting point.
– In landscape level accounting, the researcher counts a large emission event when the first stand is harvested, followed by absorption of smaller quantities of carbon each year during the accumulation period for this particular stand. Like with increasing stand level accounting, a new stand is harvested the second and third year etc., and these emission events are all counted. Unlike with increasing stand level accounting however, the researcher also counts the carbon that is absorbed by all stands after the harvest of the first stand in the forest landscape. In other words, instead of calculating carbon emissions from a lot of different starting points, forest landscape accounting uses only one, common starting point for the whole forest landscape, namely the year the first stand was harvested.[37]
So, the researcher has to decide whether to focus on the individual stand, an increasing number of stands, or the whole forest landscape.
According to Lamers et al., the stand level spatial boundary choice is typical for early carbon modeling, and it leads to carbon cycles that resemble sawteeth (dramatic increases in emissions at harvest, followed by slow declines as the forest stand absorb carbon.) The key benefit of stand-level analysis is its simplicity, and this is the primary reason for it still being part of today's carbon analyses. However, while the study of single stands provide easily comprehensible results (for example on the carbon effects of different harvesting choices), real-world timber/woody biomass supply areas consist of several stands of different maturity, for instance 80. Over a time period of 80 years then, all stands are successively harvested and replanted. To accurately calculate the carbon flow over such large areas the spatial boundary of the calculation has to increase from stand level to landscape level, as the forest "landscape" contains all the individual forest stands.[38] Cowie et al. argue that landscape level accounting is more representative of the way the forestry sector manages to produce a continuous supply of wood products.[lower-alpha 67] The IPCC recommends landscape-level carbon accounting as well (see Short-term urgency below).
Further, the researcher has to decide whether emissions from direct/indirect land use change should be included in the calculation. Most researchers include emissions from direct land use change, for instance the emissions caused by cutting down a forest in order to start some agricultural project there instead. The inclusion of indirect land use change effects is more controversial, as they are difficult to quantify accurately.[lower-alpha 68][lower-alpha 69] Other choices involve defining the likely spatial boundaries of forests in the future. For instance, is increased harvesting and perhaps even forest expansion more realistic than forest protection in a situation with high demand for forest products? Or alternatively, is smaller forests perhaps more realistic than forest protection in a situation with low demand for forest products and high demand for new land or new areas for housing and urban development? Lamers & Junginger argue that from a nature conservation and carbon strategy evaluation perspective, forest protection is a valid option. However, protection is unlikely for forest plantations – in the absence of demand for forest products (e.g., timber, pulp or pellets), "[...] options such as conversion to agriculture or urban development may be more realistic alternatives [...]."[lower-alpha 70] Cowie et al. argue that privately owned forests are often used to create income and therefore generally sensitive to market developments. Forest protection is an unrealistic scenario for most of the privately owned forests, unless forest owners can be compensated for their loss of income.[lower-alpha 71] According to the EU's Joint Research Centre, 60% of the European forests are privately owned.[39] In the US, over 80% is privately owned in the east, and over 80% publicly owned in the west.[40]
Efficiency-related system boundaries


The efficiency-related boundaries define a range of fuel substitution efficiencies for different biomass-combustion pathways. Different supply chains emit different amounts of carbon per supplied energy unit, and different combustion facilities convert the chemical energy stored in different fuels to heat or electrical energy with different efficiencies. The researcher has to know about this and choose a realistic efficiency range for the different biomass-combustion paths under consideration. The chosen efficiencies are used to calculate so-called "displacement factors" – single numbers that shows how efficient fossil carbon is substituted by biogenic carbon.[lower-alpha 72] If for instance 10 tonnes of carbon are combusted with an efficiency half that of a modern coal plant, only 5 tonnes of coal would actually be counted as displaced (displacement factor 0.5). Schlamadinger & Marland describes how such low efficiency lead to high parity times when bioenergy and coal-based forest protection scenarios are compared, and on the other hand how an efficiency identical to the coal scenario lead to low parity times.[43] Generally, fuel burned in inefficient (old or small) combustion facilities gets assigned lower displacement factors than fuel burned in efficient (new or large) facilities, since more fuel has to be burned (and therefore more CO2 released) in order to produce the same amount of energy.[lower-alpha 73]
Likewise, since the production of wood based construction materials demand lower fossil fuel input than the production of fossil based construction materials (e.g. cement or steel), the wood based construction materials get assigned displacement factors when substitution of cement and steel based construction materials is realistic, i.e. when they have the same utility in construction. The more fossil fuel emissions avoided by using utility-equivalent wood construction products, the higher the assigned displacement factors.[lower-alpha 74] Additionally, the carbon stored in wood products during the products' service life, and the fossil carbon that is displaced when the wood products are combusted for energy at the end of their service life, can both be included in the displacement factor calculations. However, so far this is not common practice.[lower-alpha 75] (52% of the harvested forest biomass in the EU is used for materials.)[44]
Sathre & O'Connor examined 21 individual studies and found displacement factors of between −2.3 and 15 for construction wood products, with the average at 2.1, which means that for each tonne of biogenic carbon produced, on average 2.1 tonnes of fossil carbon is displaced.[45] For wood based biofuels, the displacement factors varied between roughly 0.5 and 1, "[...] depending largely on the type of fossil fuel replaced and the relative combustion efficiencies."[46] The authors write that when construction wood products are combusted for energy at the end of their service life, the displacement effect is sometimes added to the calculation, "[...] as the GHG benefits of both material substitution and fuel substitution accrue."[47] In another meta study on construction wood products, where this additional end-of-life combustion substitution effect was excluded, the authors found somewhat lower displacement factors. The combustion-specific displacement factors were similar but with a wider range (see charts on the right.)[48]
The displacement factor varies with the carbon intensity of both the biomass fuel and the displaced fossil fuel. If or when bioenergy can achieve negative emissions (e.g. from afforestation, energy grass plantations and/or bioenergy with carbon capture and storage (BECCS),[lower-alpha 76] or if fossil fuel energy sources with higher emissions in the supply chain start to come online (e.g. because of fracking, or increased use of shale gas), the displacement factor will start to rise. On the other hand, if or when new baseload energy sources with lower emissions than fossil fuels start to come online, the displacement factor will start to drop. Whether a displacement factor change is included in the calculation or not, depends on whether or not it is expected to take place within the time period covered by the relevant scenario's temporal system boundaries.[lower-alpha 77]
Economic system boundaries
The economic boundaries define which market effects to include in the calculation, if any. Changed market conditions can lead to small or large changes in carbon emissions and absorptions from supply chains and forests,[lower-alpha 78] for instance changes in forest area as a response to changes in demand. Miner et al. describe how researchers have begun to examine forest bioenergy in a broader, integrated framework that also addresses market impacts. Based both on empirical data and modeling, these studies have determined that increased demand often leads to investments in forestry that increase forest area and incentivize improvements in forest management. Depending on circumstances, this dynamic can increase forest carbon stocks. Where growth rates are relatively high and the investment response strong, net GHG benefits from increased use of trees for energy can be realized within a decade or two, depending on the fossil fuel being displaced and the timing of the investment response. Where tree growth is slow and the investment response is lacking, many decades may be required to see the net benefits from using roundwood for energy. The investment response has been found to be especially important in places such as the US South, where economic returns to land have been shown to directly affect gains and losses in forest area.[49] Abt et al. argue that the US South is the world's largest timber producer, and that the forest is privately owned and therefore market driven.[50] Further, EU's Joint Research Centre argue that macroeconomic events/policy changes can have impacts on forest carbon stock.[lower-alpha 79] Like with indirect land use changes, economic changes can be difficult to quantify however, so some researchers prefer to leave them out of the calculation.[lower-alpha 80]
System boundary impacts
The chosen system boundaries are very important for the calculated results.[lower-alpha 81] Shorter payback/parity times are calculated when fossil carbon intensity, forest growth rate and biomass conversion efficiency increases, or when the initial forest carbon stock and/or harvest level decreases.[51] Shorter payback/parity times are also calculated when the researcher choose landscape level over stand level carbon accounting (if carbon accounting starts at the harvest rather than at the planting event.) Conversely, longer payback/parity times are calculated when carbon intensity, growth rate and conversion efficiency decreases, or when the initial carbon stock and/or harvest level increases, or the researcher choose stand level over landscape level carbon accounting.[lower-alpha 82]
Critics argue that unrealistic system boundary choices are made,[lower-alpha 83] or that narrow system boundaries lead to misleading conclusions.[lower-alpha 84] Others argue that the wide range of results shows that there is too much leeway available and that the calculations therefore are useless for policy development.[lower-alpha 85] EU's Join Research Center agrees that different methodologies produce different results,[lower-alpha 86] but also argue that this is to be expected, since different researchers consciously or unconsciously choose different alternative scenarios/methodologies as a result of their ethical ideals regarding man's optimal relationship with nature. The ethical core of the sustainability debate should be made explicit by researchers, rather than hidden away.[lower-alpha 87]
Climate impacts expressed as varying with time
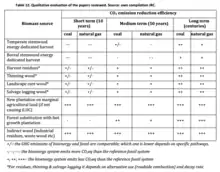
According to EU's Joint Research Centre, the use of boreal stemwood harvested exclusively for bioenergy have a positive climate impact only in the long term, while the use of wood residues have a positive climate impact also in the short to medium term.[lower-alpha 88] See chart on the right for an overview over expected emission reductions from different forest bioenergy pathways, including stemwood, residues and new plantations, compared against energy generation from coal and natural gas in the alternative scenarios. Stems from short-rotation coppices or short-rotation forests also have positive climate effects in the short to medium term (see below.)
Short carbon payback/parity times for forest residues
Short carbon payback/parity times are produced when the most realistic no-bioenergy scenario is a traditional forestry scenario where "good" wood stems are harvested for lumber production, and residues are burned or left behind in the forest or in landfills. The collection of such residues provides material which "[...] would have released its carbon (via decay or burning) back to the atmosphere anyway (over time spans defined by the biome's decay rate) [...]."[52] In other words, payback and parity times depend on the decay speed. The decay speed depends on a.) location (because decay speed is "[...] roughly proportional to temperature and rainfall [...]"[53]), and b.) the thickness of the residues.[lower-alpha 89] Residues decay faster in warm and wet areas, and thin residues decay faster than thick residues. Thin residues in warm and wet temperate forests therefore have the fastest decay, while thick residues in cold and dry boreal forests have the slowest decay. If the residues instead are burned in the no-bioenergy scenario, e.g. outside the factories or at roadside in the forests, emissions are instant. In this case, parity times approach zero.[lower-alpha 90]
Madsen & Bentsen examined emissions from both forest residues and coal, combusted in the same, real Northern European CHP (combined heat and power) plant, and found that the carbon parity time was 1 year.[lower-alpha 91] The low parity time was mainly the result of the use of residues, the generally high conversion efficiencies of CHP plants compared to regular power plants (in this case 85.9%), and longer transport distance for coal.[lower-alpha 92] The authors note that most bioenergy emission studies use hypothetical rather than real field data, and that 16 times more biomass is combusted in CHP plants than in pure electricity plants in the EU.[lower-alpha 93] In other words, it is heat-related payback/parity times such as these that are the most relevant for the current situation. Other researchers found similar parity times, including Cintas et al. (0 years, Sweden),[lower-alpha 94] Zetterberg & Chen (0 years, Sweden),[54] Repo et al. (0 years, Finland),[55] and Zanchi et al. (0 years, Austria).[lower-alpha 95] In general, such low parity times depend on a coal use alternative scenario where the forest is not used for bioenergy at all, but continues to be used for lumber production. If the lumber production remains the same but coal is replaced by natural gas in the alternative scenario, most researchers found parity times of approximately 5–20 years, depending on residue thickness and location.[lower-alpha 96] IRENA recommends CHP plants over solar thermal, heat pumps or geothermal because CHP can produce process heat cheaper and with the necessary temperatures.[lower-alpha 18]
Holmgren studied climate effects from actual forestry practices in a whole country over a 40-year time period (Sweden 1980–2019), and found that at the national landscape level, no carbon debt accrued at any point in time during this period. The actual forestry practice was compared to two alternative forest protection scenarios. The counted emissions caused by the initial harvest in the actual forestry scenario did not lead to a carbon debt because 1.) the initial harvest-related carbon emission was outweighed by carbon absorption caused by growth elsewhere in the forest (a trend that is expected to continue in the future), and 2.) because a national forest protection policy would cause large initial emissions from the national wood-based products and energy infrastructure when it is converted to work with fossil fuels.[lower-alpha 97] The conversion is described as a "[...] one-off transformation, representing major and required modifications to energy systems, infrastructure, industrial processing, building sector, manufacturing of consumer products and other economic activities towards fossil-based production if a no-harvest scenario were to be implemented."[56] Of course, if the bioenergy scenario's initial harvest-related emission event is outweighed by 1.) forest growth elsewhere, and 2.) infrastructure conversion emissions (in the forest protection scenario), no carbon debt accrues at all, and the payback and parity times reduce to zero. The author argue that since forest protection most likely will cause fossil carbon to be emitted instead of biogenic carbon, the practical effect of forest protection is simply a transfer of carbon from the underground fossil carbon pool via combustion to the atmospheric carbon pool, and then via photosynthesis to the forest carbon pool. However, when carbon is stored in forests instead of underground fossil reservoirs, it is more unstable, that is, easier to convert to CO2 because of natural disturbances.[57] A conservative displacement factor of 0.78 tonnes of fossil carbon displaced per tonne of biogenic carbon produced is used for both harvested wood products (HWP) and energy combined.[lower-alpha 98] The author criticizes studies that limit carbon accounting to the carbon flows within the forests themselves and leave out fossil displacement effects, and argues that this narrow system boundary essentially works as "[...] a justification for continued fossil emissions elsewhere with no net gain for the global climate."[58] In Sweden, the biomass that is available for energy is mainly used in heating facilities (7.85 Mtoe used for heating, 0.84 Mtoe for electricity.)[59]
In the US, Walker et al. found parity times of 10 years or less when using forest residues in New England to replace coal in a regular, utility-scaled electricity plant.[60] Likewise, Miner et al. argue that in the eastern parts of the US, all kinds of forest residues can be used for bioenergy with climate benefits within 10 years compared to a coal-based alternative scenario, and within 20 years compared to a natural gas-based alternative scenario.[lower-alpha 99]
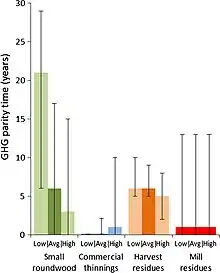
Hanssen et al. compared a bioenergy scenario that included continued pellet production in the Southeast USA to three alternative fossil fuel mix scenarios, all seen as more realistic scenarios than forest protection: 1.) Use all harvested biomass to produce paper, pulp or wood panels, 2.) quit the thinning practice, i.e., leave the small trees alone, so more of their growth potential is realized, and 3.) leave the residues alone, so they decay naturally over time, rather than being burned almost immediately in power plants. Three different levels of demand (low, average, high) was included for each alternative scenario. Parity times ranged from 0–21 years in all demand scenarios, and 0–6 years in the average demand scenarios (see chart on the right). The authors used landscape level carbon accounting, rotation time was 25 years, and market effects were included.[lower-alpha 100]

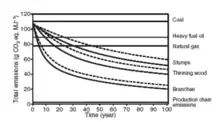
Lamers & Junginger examined a number of studies on (sub)-boreal forest residues (including stumps in some cases), and found carbon parity times of between 0 and 16 years. The bioenergy scenario was compared against an alternative reference scenario where the residues either were left in the forests to decay naturally, or was incinerated at the roadside. The parity time was 0 years compared to a scenario where the residues was burned at roadside and electricity instead produced by coal plants. However, parity times increased to 3–24 years when roadside burning was exchanged with natural decay, and coal exchanged with oil. Parity times increased further to 4–44 years when oil was replaced with natural gas. All bioenergy scenarios used landscape level carbon accounting.[63]
Zanchi et al. agree that there are climate benefits from the beginning when using easily decomposable forest residues for bioenergy. They also write that "[...] new bioenergy plantations on lands with low initial C [carbon] stocks, such as marginal agricultural land, has the clearest advantages in terms of emission reductions."[64] The reason is that newly planted areas (which now has a large growing stock of trees or other plants), absorb much more carbon than earlier. Such areas build up a carbon credit instead of a carbon debt, where the credit is used later (at harvest) to acquire "debt free" biomass. In general, "early" carbon accounting like this, which starts at the planting event rather than at the harvest event (cf. Temporal system boundaries above), is seen as uncontroversial for new bioenergy plantations on land areas with very little vegetation. On the other hand, for areas where there already is a large amount of vegetation in place, "late" carbon accounting is often preferred. In this case, carbon accounting starts at harvest, with no build-up of a prior carbon credit. With this type of carbon accounting, the calculated results show that there are short to medium term negative impacts when trees are felled exclusively for bioenergy (so-called "additional fellings"). The situation gets worse if residues are left to rot on the forest floor. There is also a risk for negative impacts if areas with large amounts of biomass such as forests are clear-cut in order to make room for low-productivity forest plantations.[65]
The assessment of such "additional fellings" from "new" bioenergy plantations after the first rotation is complete, depends on the chosen carbon accounting method. If the "early" carbon accounting continues, there will be a build-up of a carbon credit also after the first rotation, i.e. from the moment in time when the trees have been replanted. If the researcher at that time change to "late" carbon accounting, no carbon credit will be calculated, and at the end of the second rotation (at harvest) a large carbon debt will be created instead, causing payback and parity times to increase dramatically.
Long carbon payback/parity times for forest residues
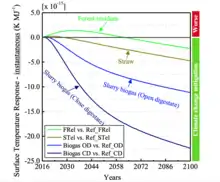
EU's Joint Research Centre provides time-dependent emission estimates for electricity production on a large scale from residue-based wood pellets, cereal straw and biogas from slurry, compared against a no-bioenergy scenario with emissions equal to EU's current electricity mix. Conversion efficiencies are 34%, 29% and 36% for wood pellets, straw and biogas, respectively. If not used for electricity production, the forest residues would have been left to decay on the forest floor, the straw residues would also have been left behind in the fields, and the raw manure would have been used as organic fertilizer. The results show that if these biomass types instead were used to produce electricity, a global warming mitigation effect would start after approximately 50, 10 and 5 years of use, for wood, straw and biogas respectively. The main cause for the long parity time for wood pellets is the comparison with electricity from EU's electricity mix (which includes electricity from solar, wind and fossil fuels with lower emissions than coal). Also, the forest residue category includes stumps.[lower-alpha 103]
EU's Joint Research Centre also found that in Finland, parity times are 0 years for all types of residues, including stumps, when compared against a coal-based alternative scenario. However, when compared against a natural gas-based alternative scenario, stumps reach parity times of 30–50 years, depending on latitude (see graph on the right.)[lower-alpha 102] Accordingly, the JRC write: "Coal replacement gives an almost immediate CRF [cumulative radiative forcing] reduction [temperature reduction], but replacing oil and natural gas, despite resulting in long-term CRF reduction, causes an increment in the CRF during the first 10-25 years."[66]
The JRC also found parity[lower-alpha 104] times ranging from 0 to 35 years for harvest residues (including branches, thinnings and stumps), when compared to some other alternative scenarios. In Finland, parity times for stumps were 22 years compared against oil, and 35 years compared against natural gas, with stand level carbon accounting. In Canada, parity time increased from 16 to 74 years when the harvested biomass was used to produce ethanol instead of wood pellets, and compared against a gasoline-based alternative scenario instead of a coal-based alternative scenario.[lower-alpha 105] Ethanol production from whole trees removed from old-growth forests in Oregon, USA, (categorized as residues because the trees were felled to prevent wildfire) increased parity time dramatically, with the worst-case scenario at 459 years. The authors used stand level carbon accounting starting with the harvest event, assumed an additional, controlled burning every 25 years, and compared this to a scenario with no wildfire-preventive fellings and a severe wildfire every 230 years.[67] The trees in question were huge western hemlock and coast Douglas fir trees which both take hundreds of years to mature and can withstand wildfires due to very thick stems. Since energy-intensive ethanol production caused a low displacement factor of only 0.39, a long parity time was calculated.[68] Generally, the JRC's reported parity times were influenced by displacement factor, alternative scenario, residue size and climate type. See chart above.
Short carbon payback/parity times for stemwood
If an existing natural forest is clear-cut in order to make room for forest plantations, the implied carbon change create a significant carbon debt roughly equal to the amount of carbon residing in the felled trees (fossil based forestry operations create an additional, small debt.) But for new plantations on "empty" land like agricultural or marginal land, with no standing vegetation, no carbon is removed. In this case, a carbon credit is instead soon built up as the trees mature. When those trees later are felled, the amount of carbon that resides in the trees is subtracted from the built up carbon credit (not the carbon amount in the standing trees), so in this case no carbon debt is created. With no carbon debt created at harvest, carbon payback/parity times will be zero or very low, for residues and stemwood alike.[lower-alpha 106]
Short-rotation forests also have low parity times. Lamers & Junginger studied a number of individual reports on stemwood[lower-alpha 107] harvest for bioenergy in plantation forests in the southern USA. These trees have a rotation time of 20–25 years (the rotation time is the time it takes for new trees to grow to the same size as the harvested trees.) In the bioenergy scenarios the wood stems were harvested exclusively for electricity production. The bioenergy scenarios had carbon parity times of 12 to 46 years when compared to different alternative scenarios where the forest was instead protected and the electricity produced by coal plants. Parity times increased to between 35 and 50 years when the rotation time increased to 35 years and coal was exchanged with a fossil fuel mix in the alternative scenarios. The authors also found that natural (unmanaged) boreal forests in British Columbia (Canada) had a parity time of 0 years when trees were killed by insects and subsequently harvested for bioenergy, with a coal-based alternative scenario. However, when live trees in three other slow-growing boreal forest areas were harvested for bioenergy, the parity times reached a maximum of 105 years, also compared against a coal-based alternative scenario. The authors note however that "[...] it is highly unlikely that sawlog quality stemwood systematically ends up as bioenergy feedstock."[69]
Jonker et al. calculated both carbon payback and carbon parity times for stemwood with rotation times of 20–25 years harvested from southeastern forests in the US, using both stand level, increasing stand level, and landscape level carbon accounting. With stand-level carbon accounting, the authors found carbon payback times of 5, 7 and 11 years in the high, medium and low yield scenario, respectively. With increasing stand level accounting, the payback times were 12, 13 and 18 years in the high, medium and low yield scenario, respectively. With landscape level accounting, the payback time was below 1 year for all yield scenarios.[37] The authors also calculated parity times for a scenario where wood pellets from stems only (no residue collection) were used for co-firing in an average, coal-based electricity plant. The conversion efficiency was 41%, which together with an efficient supply chain leads to a relatively high displacement factor of 0.92. The alternative scenario was a no-bioenergy scenario where the stemwood was instead used for lumber production, so no co-firing at all in this case (electricity from coal exclusively.) When using the increasing stand level accounting principle, the authors calculated parity times of 17, 22 and 39 years for the high, medium and low yield scenario, respectively. When using the landscape level accounting principle, the authors calculated parity times of 12, 27 and 46 years for the high, medium and low yield scenario, respectively. A different alternative scenario was a forest protection scenario where no biomass was extracted from the forest at all; not for lumber, and not for bioenergy. The forest was simply left to itself and therefore regrew rather slowly. Landscape level parity times for this scenario was 3, 3, and 30 years for the high, medium and low yield scenario, respectively (stand level or increasing stand level parity times were not provided.)[70]
The authors note that "the result of the carbon balances clearly demonstrate that the choice of carbon accounting method has a significant impact on the carbon payback and carbon offset parity point calculations."[71] They argue that the short parity times are caused by the fast growth rates (10–12 tonnes dry mass per hectare per year) in softwood plantations in the southeastern USA. Other researchers have often based their calculations on the slow growth rates typical for hardwood in natural boreal forests, which generates much higher payback and parity times. The authors also argue that for established softwood plantations, there is no carbon debt caused by land use change. Also, the displacement factor is higher here than in some other studies, due to the efficient supply chain and the high conversion efficiency achieved when wood pellets are used for co-firing in regular coal plants rather than in small-scale bioenergy plants; the latter often assumed to be the case in other studies. In effect, these favourable system boundaries cause the parity time to reduce to one or two rotations. The carbon debt is small before the parity point, and the subsequent carbon credit rises high after the parity point has been passed: "It is also clear that the absolute size of the temporary negative carbon balance is limited, whereas the positive carbon balance after break-even soon reaches levels many times greater."[72] The authors argue that the no-bioenergy and the forest protection scenario is unrealistic in the study area, since the forests here are privately owned and there is a large wood processing industry already in place. In this situation (without viable alternative scenarios) the authors argue that the most relevant temporal metric is the carbon payback time of below 1 year for all yield scenarios, based on the landscape level carbon accounting principle.[73] Abt et al. also argue that in the southeastern USA, forest protection scenarios are unrealistic since the forests are privately owned.[50]
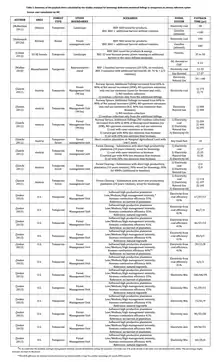
EU's Joint Research Centre reviewed a number of studies and found that if stemwood is harvested for both bioenergy and wood products, continued harvesting works better for the climate than forest protection given a 40 years timeframe.[lower-alpha 108] The reason is the larger displacement effect of wood products compared to bioenergy. If wood products are used for energy when reaching their end of life (so-called "cascading"), the displacement effect grows even larger, and under optimal conditions, parity times can reduce from several centuries to zero. The JRC therefore argue that studies that fail to include the wood for material displacement effect may come to misleading conclusions.[lower-alpha 109] On the other hand, if a forest is harvested exclusively for bioenergy, there is no displacement effects happening for wood products, which means a lower displacement factor and therefore a net increase in calculated CO2 emissions "[...] in the short-and medium term (decades) [...]" when compared to fossil fuels, except when it is harvested from new plantations on marginal, agricultural or grazing land. In this case there is an immediate net increase in carbon at the site, as planting without prior tree felling increases the amount of biomass there.[lower-alpha 110] Again, when there is no carbon debt, the payback and parity times reduce to zero.[lower-alpha 111]
Long carbon payback/parity times for stemwood
Zanchi et al. found that parity times can reach 175 years with a coal-based alternative scenario and 300 years with a natural gas-based alternative scenario if spruce stems in the Austrian Alps are harvested exclusively for bioenergy. The main reason is the long rotation time for these trees (90 years). Generally, trees take 70–120 years to mature in boreal forests.[75] Critics reply that stems that meet quality requirements are used to produce high-value products such as sawn wood and engineered wood products such as cross laminated timber, rather than low-value products such as wood pellets.[lower-alpha 112] In a different scenario where forests of this type is clear-cut and used 50/50 for bioenergy and solid wood products, and then subsequently replaced with short rotation forest, parity times varies between 17 and 114 years for the coal alternative scenario, with the shortest parity time achieved by the forest with the shortest rotation time and highest yield (10 years rotation time with a yield of 16 tonnes per hectare per year.) Parity times increased to between 20 and 145 years when compared to an oil-based electricity alternative case, and between 25 and 197 years when compared to a natural gas-based electricity alternative case. For an afforestation vs. fossil fuel mix scenario, a parity time of 0 years was reported.
The authors note that these scenarios are "illustrative examples" and that "results are strongly influenced by the assumptions made." The authors assumed that residues were left un-collected on the forest floor, where they decay and therefore produce emissions. If these residues instead are collected and used for bioenergy, the parity times decrease by 100 years. The extra emissions produced by the longer supply routes for fossil fuels compared to wood fuel were not included in the calculation.[lower-alpha 113] Extra emissions from pests, windthrows and forest fires (normally expected to increase when unmanaged forests age), were also not included in the calculation. Market effects were not included. On the other hand, landscape level carbon accounting was used, and the assumed conversion efficiency for bioenergy and coal were the same.[76]
Like other scientists, the JRC staff note the high variability in carbon accounting results, and attribute this to different methodologies.[lower-alpha 114] In the studies examined, the JRC found carbon parity times of 0 to 400 years (see chart on the right) for stemwood harvested exclusively for bioenergy, depending on different characteristics and assumptions for both the forest/bioenergy system and the alternative fossil system, with the emission intensity of the displaced fossil fuels seen as the most important factor, followed by conversion efficiency and biomass growth rate/rotation time. Other factors relevant for the carbon parity time are the initial carbon stock and the existing harvest level; both higher initial carbon stock and higher harvest level means longer parity times.[77] Liquid biofuels have high parity times because about half of the energy content of the biomass is lost in the processing.[lower-alpha 115]
Static emission estimates for a number of bioenergy pathways
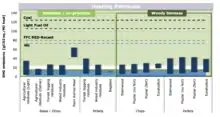
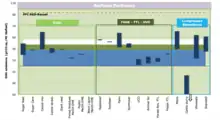
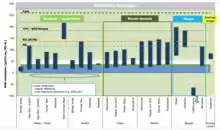
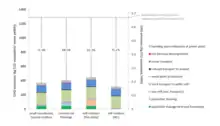
EU's Joint Research Centre has examined a number of bioenergy emission estimates found in literature, and calculated greenhouse gas savings percentages for bioenergy pathways in heat production, transportation fuel production and electricity production, based on those studies (see charts on the right). The calculations are based on the attributional LCA accounting principle. It includes all supply chain emissions, from raw material extraction, through energy and material production and manufacturing, to end-of-life treatment and final disposal. It also includes emissions related to the production of the fossil fuels used in the supply chain. It excludes emission/absorption effects that takes place outside its system boundaries, for instance market related, biogeophysical (e.g. albedo), and time-dependent effects. Because market related calculations are excluded, the results are only seen as valid for small-scale energy production.[80] Also, the bioenergy pathways have typical small-scale conversion efficiencies. Solid biofuels for electricity production have 25% efficiency in most cases, and 21–34% in a few cases. Biogas for electricity production have 32–38%. Heat pathways have 76–85%. The forest residue category include logs and stumps, which increases carbon intensity especially in forests with slow decay rates.[81]
The charts have vertical bars that represent the emission range found for each bioenergy pathway (since emissions for the same pathway vary from study to study.) The higher end of the range represents emission levels found in studies that assume for instance long transport distances, low conversion efficiencies and no fossil fuel displacement effect. The lower end of the range represents emission levels found in studies that assume optimized logistics, higher conversion efficiencies, use of renewable energy to supply process-heat and process-electricity, and include displacement effects from the substitution of fossil fuels.[lower-alpha 117] The bars can be compared with emission levels associated with multiple alternative energy systems available in the EU. The dotted, coloured areas represent emission savings percentages for the pathways when compared to fossil fuel alternatives.[79] The authors conclude that "[m]ost bio-based commodities release less GHG than fossil products along their supply chain; but the magnitude of GHG emissions vary greatly with logistics, type of feedstocks, land and ecosystem management, resource efficiency, and technology."[82]
Because of the varied climate mitigation potential for different biofuel pathways, governments and organizations set up different certification schemes to ensure that biomass use is sustainable, for instance the RED (Renewable Energy Directive) in the EU and the ISO standard 13065 by the International Organization for Standardization.[83] In the US, the RFS (Renewables Fuel Standard) limit the use of traditional biofuels and defines the minimum life-cycle GHG emissions that are acceptable. Biofuels are considered traditional if they achieve up to 20% GHG emission reduction compared to the petrochemical equivalent, advanced if they save at least 50%, and cellulosic if the save more than 60%.[lower-alpha 118]
Static emission estimates for wood pellets
Consistent with the charts, the EU's Renewable Energy Directive (RED) states that the typical greenhouse gas emissions savings when replacing fossil fuels with wood pellets from forest residues for heat production varies between 69% and 77%, depending on transport distance: When the distance is between 0 and 2500 km, emission savings is 77%. Emission savings drop to 75% when the distance is between 2500 and 10 000 km, and to 69% when the distance is above 10 000 km. When stemwood is used, emission savings varies between 70% and 77%, depending on transport distance. When wood industry residues are used, savings varies between 79% and 87%.[lower-alpha 119]
Based on a similar methodology, Hanssen et al. found that greenhouse gas emissions savings from electricity production based on wood pellets produced in the US southeast and shipped to the EU, varies between 65% and 75%, compared to EU's fossil fuel mix.[lower-alpha 120] They estimate that average net GHG emission from wood pellets imported from the US and burnt for electricity in the EU amounts to approximately 0.2 kg CO2 equivalents per kWh, while average emissions from the mix of fossil fuels that is currently burnt for electricity in the EU amounts to 0.67 kg CO2-eq per kWh (see chart on the right). Ocean transport emissions amounts to 7% of the displaced fossil fuel mix emissions per produced kWh.[lower-alpha 121]
Likewise, IEA Bioenergy estimates that in a scenario where Canadian wood pellets totally replace coal in a European coal plant, the ocean transport related emissions (for the distance Vancouver – Rotterdam) amounts to approximately 2% of the plant's total coal-related emissions.[84] The lower percentage here is caused by the alternative scenario being a particular coal plant, not EU's fossil fuel mix. Cowie et al. argue that calculations from actual supply chains show low emissions from intercontinental biomass transport, for instance the optimized wood pellet supply chain from the southeastern USA to Europe.[lower-alpha 122] Lamers & Junginger argue that future EU import of wood pellets "[...] will likely continue to be dominated by North America, especially from the South-East USA [...]."[85] In 2015, 77% of the imported pellets came from the USA.[lower-alpha 123]
Static emission estimates for short rotation energy crops
While regular forest stands have rotation times spanning decades, short rotation forestry (SRF)[lower-alpha 22] stands have a rotation time of 8–20 years, and short rotation coppicing (SRC)[lower-alpha 21] stands 2–4 years.[86] 12% of the EU forests is coppice forests.[lower-alpha 124] Perennial grasses have a rotation time of one year in temperate areas, and 4–12 months in tropical areas.[87] Food crops like wheat and maize also have rotation times of one year.
Because short rotation energy crops only have managed to grow/accumulate carbon for a short amount of time before they are harvested, it is relatively easy to pay back the harvest-related carbon debt, provided that there is no additional large carbon debt from land use change to deal with (for instance created by clear-cutting a natural forest in order to use this land area for energy crops), and no better climate-related use for the areas in question. Schlamadinger & Marland write that "[...] short-rotation energy crops will provide much earlier and larger C [carbon] mitigation benefits if implemented on previously unforested land than if an initial forest is harvested to provide space for the plantation."[88] EU's Joint Research Centre state: "In case that there is no raw material displacement from other sectors such as food, feed, fibers or changes in land carbon stocks due to direct or indirect land use change, the assumption of carbon neutrality can still be considered valid for annual crops, agriresidues, short-rotation coppices and energy grasses with short rotation cycles. This can also be valid for analysis with time horizons much longer than the feedstock growth cycles."[89] Other researchers argue that the small carbon debts associated with energy crop harvests means short carbon payback and parity times, often less than a year.[lower-alpha 125] IRENA argues that short-rotation energy crops and agricultural residues are carbon neutral since they are harvested annually.[lower-alpha 126] IEA writes in its special report on how to reach net zero emissions in 2050 that the "[...] energy‐sector transformation in the NZE [Net Zero Emissions scenario) would reduce CO2 emissions from AFLOU [Agriculture, Forestry and Other Land Use] in 2050 by around 150 Mt CO2 given the switch away from conventional crops and the increase in short rotation advanced‐bioenergy crop production on marginal lands and pasture land."[90]
Since the long payback and parity times calculated for some forestry projects is seen as a non-issue for energy crops (except in the cases mentioned above), researchers instead calculate static climate mitigation potentials for these crops, using LCA-based carbon accounting methods. A particular energy crop-based bioenergy project is considered carbon positive, carbon neutral or carbon negative based on the total amount of CO2 equivalent emissions and absorptions accumulated throughout its entire lifetime: If emissions during agriculture, processing, transport and combustion are higher than what is absorbed (and stored) by the plants, both above and below ground, during the project's lifetime, the project is carbon positive. Likewise, if total absorption is higher than total emissions, the project is carbon negative. In other words, carbon negativity is possible when net carbon accumulation more than compensates for net lifecycle greenhouse gas emissions.
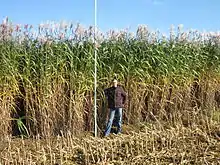
The most climate friendly energy crops seems to be perennial energy grasses, because of low energy inputs and large amounts of carbon stored in the soil. Researchers argue that the mean energy input/output ratios for the perennial crop miscanthus is 10 times better than for annual crops, and that greenhouse gas emissions are 20-30 times better than for fossil fuels.[lower-alpha 127] Miscanthus chips for heating saved 22.3 tonnes of CO2 emissions per hectare per year in the UK, while maize for heating and power saved 6.3. Rapeseed for biodiesel saved 3.2.[lower-alpha 128] Other researchers have similar conclusions.[lower-alpha 129]
Typically, perennial crops sequester more carbon than annual crops because the root buildup is allowed to continue undisturbed over many years. Also, perennial crops avoid the yearly tillage procedures (plowing, digging) associated with growing annual crops. Tilling helps the soil microbe populations to decompose the available carbon, producing CO2.[lower-alpha 130][lower-alpha 131] Soil organic carbon has been observed to be greater below switchgrass crops than under cultivated cropland, especially at depths below 30 cm (12 in).[91] A meta-study of 138 individual studies, done by Harris et al., revealed that the perennial grasses miscanthus and switchgrass planted on arable land on average store five times more carbon in the ground than short rotation coppice or short rotation forestry plantations (poplar and willow).[lower-alpha 132] McCalmont et al. compared a number of individual European reports on Miscanthus × giganteus carbon sequestration, and found accumulation rates ranging from 0.42 to 3.8 tonnes per hectare per year,[lower-alpha 133] with a mean accumulation rate of 1.84 tonne,[lower-alpha 134] or 25% of total harvested carbon per year.[lower-alpha 135]
Fundamentally, the below-ground carbon accumulation works as a greenhouse gas mitigation tool because it removes carbon from the above-ground carbon circulation (the circulation from plant to atmosphere and back into new plants.) The circulation is driven by photosynthesis and combustion: First, a plant absorbs CO2 and assimilates it as carbon in its tissue both above and below ground. When the above-ground carbon is harvested and then burned, the CO2 molecule is formed yet again and released back into the atmosphere. Then, an equivalent amount of CO2 is absorbed back by next season's growth, and the cycle repeats.
_life_cycle_emissions_for_Miscanthus_x_giganteus_and_SRC_Poplar.jpg.webp)
This above-ground circulation has the potential to be carbon neutral, but of course the human involvement in operating and guiding it means additional energy input, often coming from fossil sources. If the fossil energy spent on the operation is high compared to the amount of energy produced, the total CO2 footprint can approach, match or even exceed the CO2 footprint originating from burning fossil fuels exclusively, as has been shown to be the case for several first-generation biofuel projects.[lower-alpha 137][lower-alpha 138][lower-alpha 139] Transport fuels might be worse than solid fuels in this regard.[lower-alpha 140]
The problem can be dealt with both from the perspective of increasing the amount of carbon that is stored below ground, and from the perspective of decreasing fossil fuel input to the above-ground operation. If enough carbon is stored below ground, it can compensate for the total lifecycle emissions of a particular biofuel. Likewise, if the above-ground emissions decreases, less below-ground carbon storage is needed for the biofuel to become carbon neutral or negative.
.jpg.webp)
Whitaker et al. argue that a miscanthus crop with a yield of 10 tonnes per hectare per year store enough carbon to compensate for both agriculture, processing and transport related emissions. The chart on the right displays two carbon negative miscanthus production pathways, and two carbon positive poplar production pathways, represented in gram CO2-equivalents per megajoule. The bars are sequential and move up and down as atmospheric CO2 is estimated to increase and decrease. The grey/blue bars represent agriculture, processing and transport related emissions, the green bars represents soil carbon change, and the yellow diamonds represent total final emissions.[lower-alpha 136] The second chart displays the mean yields necessary to achieve long-term carbon negativity for soils with different amounts of existing carbon. The higher the yield, the more likely carbon negativity becomes. Other researchers make the same claim about carbon negativity for miscanthus in Germany, with a yield of 15 dry tonnes per hectare per year, and carbon storage of 1.1 tonnes per hectare per year.[lower-alpha 141]
Successful storage is dependent on planting sites, as the best soils are those that are currently low in carbon.[lower-alpha 142] For the UK, successful storage is expected for arable land over most of England and Wales, with unsuccessful storage expected in parts of Scotland, due to already carbon rich soils (existing woodland). Also, for Scotland, the relatively lower yields in this colder climate makes carbon negativity harder to achieve. Soils already rich in carbon include peatland and mature forest. The most successful carbon storage in the UK takes place below improved grassland.[lower-alpha 143] However, since the carbon content of grasslands vary considerably, so does the success rate of land use changes from grasslands to perennial.[lower-alpha 144] Even though the net carbon storage below perennial energy crops like miscanthus and switchtgrass greatly exceeds the net carbon storage below regular grassland, forest and arable crops, the carbon input is simply too low to compensate for the loss of existing soil carbon during the early establishment phase.[93] Over time however, soil carbon may increase, also for grassland.[94]
Researchers argue that after some initial discussion, there is now (2018) consensus in the scientific community that "[...] the GHG [greenhouse gas] balance of perennial bioenergy crop cultivation will often be favourable [...]", also when considering the implicit direct and indirect land use changes.[lower-alpha 145]
Climate impacts from albedo and evapotranspiration
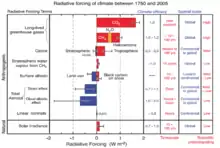
Plants change the color of the surface of the earth, and this has an effect on the surface reflectivity (the so-called "albedo" effect.) Lighter colors tend to reflect heat, and darker colors tend to absorb heat. For example, when an area changes color from earthy brown to green, less heat is absorbed. Conversely, when a snowy area changes color from white to green, more heat is absorbed. Research show that afforestation have a net warming effect in snowy, boreal areas (also after carbon absorption caused by afforestation have been accounted for), because the color of the trees is darker than the color of the snow. In other words, the albedo effect helps compensate for the long payback and parity times caused by logging in such areas. Forest albedo has a slight cooling effect globally.[lower-alpha 146]
Plants causes more evapotranspiration and therefore increased local humidity. The increased humidity causes more of the incoming solar energy to be spent evaporating water rather than heating the ground, thereby creating a cooling effect. In tropical forests, evapotranspiration can also create low-hanging clouds that reflects sunlight, adding to the albedo effect. Forests release small particles called organic carbon, both via combustion and directly from live trees. The particles reflect sunlight, so have a cooling effect on their own, but also helps create clouds, since water vapor condense around the particles. In both cases, the reflection creates a cooling effect.[lower-alpha 147]
If annual crops across the central USA were replaced by perennial grasses, it would cause significant global cooling, mostly from evapotranspiration effects but also from albedo. The albedo effect alone was six times larger than the grasses' fossil fuel displacement effect. The reason for the albedo effect in this case was that perennial grasses keep the surface green for a longer period of time during the year, compared to annual crops.[lower-alpha 148][95]
Environmental impact
Surface power production densities
The environmental impact caused by biomass or other renewable energy production depends to some extent on its land use requirements. To calculate land use requirements, it is essential to know the relevant surface power production densities (e.g. power production per square metre). Vaclav Smil estimates that the average lifecycle surface power densities for modern biofuels, wind, hydro and solar power production are 0.3 W/m2, 1 W/m2, 3 W/m2 and 5 W/m2, respectively (power in the form of heat for biofuels, and electricity for wind, hydro and solar).[96] Lifecycle surface power density includes land used by all supporting infrastructure, manufacturing, mining/harvesting and decommissioning. Van Zalk et al. estimates 0.08 W/m2 for biofuel, 0.14 W/m2 for hydro, 1.84 W/m2 for wind, and 6.63 W/m2 for solar (median values, with none of the renewable sources exceeding 10 W/m2). Fossil gas has the highest surface density at 482 W/m2 while nuclear power at 240 W/m2 is the only high-density and low-carbon energy source.[97] The average human power consumption on ice-free land is 0.125 W/m2 (heat and electricity combined),[98] although rising to 20 W/m2 in urban and industrial areas.[99]
The reason for the low power density for some of the biofuels is a combination of low yields and only partial utilization of the plant (for instance, ethanol is typically made from sugarcane's sugar content or corn's starch content, while biodiesel is often made from the oil content in rapeseed or soybean).

When used for ethanol production, miscanthus plantations with a yield of 15 tonnes per hectare per year generate 0.40 W/m2.[100] Corn fields generate 0.26 W/m2 (yield 10 t/ha).[101] In Brazil sugarcane fields typically generate 0.41 W/m2.[101] Winter wheat (USA) generates 0.08 W/m2 and German wheat generates 0.30 W/m2.[102] When grown for jet fuel, soybean generates 0.06 W/m2, while palm oil generates 0.65 W/m2.[103] Jathropa grown on marginal land generate 0.20 W/m2.[103] When grown for biodiesel, rapeseed generate 0.12 W/m2 (EU average).[104] Liquid biofuel production require large energy inputs compared to solid biofuel production.[lower-alpha 149] When these inputs are compensated for (i.e. when used energy is subtracted from produced energy), power density drops further down: Rapeseed based biodiesel production in the Netherlands have the highest energy efficiency in the EU with an adjusted power density of 0.08 W/m2, while sugar beets based bioethanol produced in Spain have the lowest, at only 0.02 W/m2.[105]
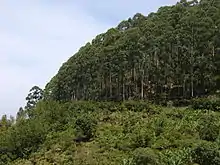
Using solid biomass for energy purposes is more efficient than using liquids, as the whole plant can be utilized. For instance, corn plantations producing solid biomass for combustion generate more than double the amount of power per square metre compared to corn plantations producing for ethanol, when the yield is the same: 10 t/ha generates 0.60 W/m2 and 0.26 W/m2 respectively, without compensating for energy input.[106] It has been estimated that large-scale plantations with pines, acacias, poplars and willows in temperate regions achieve yields of 5–15 dry tonnes per hectare per year, which means a surface power production density of 0.30–0.90 W/m2.[107] For similarly large plantations, with eucalyptus, acacia, leucaena, pinus and dalbergia in tropical and subtropical regions, yields are typically 20–25 t/ha, which means a surface power production density of 1.20–1.50 W/m2. This yield put these plantations' power densities in-between the densities of wind and hydro.[107] In Brazil, the average yield for eucalyptus is 21 t/ha, but in Africa, India and Southeast Asia, typical eucalyptus yields are below 10 t/ha.[108]
Oven dry biomass in general, including wood, miscanthus[109] and napier[110] grass, have a calorific content of roughly 18 GJ/t.[111] When calculating power production per square metre, every t/ha of dry biomass yield increases a plantation's power production by 0.06 W/m2.[lower-alpha 150] As mentioned above, the world average for wind, hydro and solar power production is 1 W/m2, 3 W/m2 and 5 W/m2 respectively. In order to match these surface power densities, plantation yields must reach 17 t/ha, 50 t/ha and 83 t/ha for wind, hydro and solar respectively. This seems achievable for the tropical plantations mentioned above (yield 20–25 t/ha) and for elephant grasses, e.g. miscanthus (10–40 t/ha), and napier (15–80 t/ha), but unlikely for forest and many other types of biomass crops. To match the world average for biofuels (0.3 W/m2), plantations need to produce 5 tonnes of dry mass per hectare per year. When instead using the Van Zalk estimates for hydro, wind and solar (0.14, 1.84, and 6.63 W/m2 respectively), plantation yields must reach 2 t/ha, 31 t/ha and 111 t/ha in order to compete. Only the first two of those yields seem achievable, however.
Note that in the case of old combustion facilities, yields need to be adjusted to compensate for the amount of moisture in the biomass (evaporating moisture in order to reach the ignition point is wasted energy unless the resulting steam can be harnessed for energy).[lower-alpha 151] The moisture of biomass straw or bales varies with the surrounding air humidity and eventual pre-drying measures, while pellets have a standardized (ISO-defined) moisture content of below 10% (wood pellets)[lower-alpha 152] and below 15% (other pellets).[lower-alpha 153] Likewise, for wind, hydro and solar, power line transmission losses amounts to roughly 8% globally and should be accounted for.[lower-alpha 154] If biomass is to be utilized for electricity production rather than heat production, yields has to be roughly tripled in order to compete with wind, hydro and solar, as the current heat to electricity conversion efficiency is only 30-40%.[112] When simply comparing the surface power production densities of biofuel, wind, hydro and solar, without regard for cost, this effectively pushes both hydro and solar power out of reach of even the highest yielding plantations, power density wise.[lower-alpha 155]
Biodiversity
Gasparatos et al. reviews current research about the side effects of all kinds of renewable energy production and argue that in general there is a conflict between "[...] site/local-specific conservation goals and national energy policy/climate change mitigation priorities [...]." The authors argue that for instance biodiversity should be seen as an equally "[...] legitimate goal of the Green Economy as curbing GHG emissions."[113] Oil palm and sugar cane are examples of crops that have been linked to reduced biodiversity.[114] Other problems are pollution of soil and water from fertiliser/pesticide use,[115] and emission of ambient air pollutants, mainly from open field burning of residues.[116]
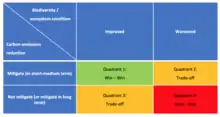
.png.webp)
The authors note that the extent of the environmental impact "[...] varies considerably between different biomass energy options."[114] For impact mitigation, they recommend "[...] adopting environmentally-friendly bioenergy production practices, for instance limiting the expansion of monoculture plantations, adopting wildlife-friendly production practices, installing pollution control mechanisms, and undertaking continuous landscape monitoring."[118] They also recommend "[...] multi-functional bioenergy landscapes."[118] Other measures include "[...] careful feedstock selection, as different feedstocks can have radically different environmental trade-offs. For example, US studies have demonstrated that 2nd generation feedstocks grown in unfertilized land could provide benefits to biodiversity when compared to monocultural annual crops such as maize and soy that make extensive use of agrochemicals."[118] Miscanthus and switchgrass are examples of such crops.[119]
Since biodiversity has been defined by the EU as an important policy goal, EU's Joint Research Centre has examined ways to ensure that increased use of bioenergy does not negatively effect biodiversity in European forests.[lower-alpha 157] Only bioenergy pathways that provides additional bioenergy resources compared to the existing forestry practices were considered, namely 1.) increased use of logging residues, 2.) afforestation of unused land areas and 3.) conversion of natural forests to more productive forest plantations.[lower-alpha 158] The authors divided the results into four categories, depending on their potential for climate and biodiversity mitigation: 1.) Win-win scenarios (green quadrant in the chart to the right) have positive consequences for both the climate and for biodiversity, 2.) win-lose scenarios (yellow quadrant) are trade-off scenarios with positive consequences for the climate but negative consequences for biodiversity, 3.) lose-win scenarios (yellow quadrant) are trade-off scenarios with negative consequences for the climate but positive consequences for biodiversity, and 4.) lose-lose scenarios (red quadrant) have negative consequences for both the climate and for biodiversity (see chart on the right.)
Long term, increased bioenergy may have a positive impact on biodiversity because "[...] climate change in itself is a major driver of biodiversity loss." However, this is hard to quantify, so as a conservative measure, the authors chose to only recommend bioenergy pathways with consequences for biodiversity seen as positive in the short term.[lower-alpha 159] The same goes for climate effects; only bioenergy pathways with positive short-term consequences were recommended (short-term is defined as a period of 0–20 years, medium-term 30–50 years, and long-term over 50 years.) The alternative scenario for all bioenergy scenarios was a fossil fuel mix ("fossil sources"), i.e. not coal exclusively.[120] No market effects were considered, so the results are only seen as valid for small-scale bioenergy deployment.[lower-alpha 160]
Win-win scenarios include increased use of whole trees from coppice forests, increased use of thin forest residues from boreal forests with slow decay rates, and increased use of all kinds of residues from temperate forests with faster decay rates. Win-win scenarios also include afforestation of former agricultural land with mixed or naturally regenerating forests.[lower-alpha 161] Win-lose scenarios (good for the climate, bad for biodiversity) include afforestation on ancient, biodiversity-rich grassland ecosystems which were never forests, and afforestation of former agricultural land with monoculture plantations.[lower-alpha 162] Lose-win scenarios (bad for the climate, good for biodiversity) include natural forest expansion on former agricultural land.[lower-alpha 163] Lose-lose scenarios include increased use of thick forest residues like stumps from some boreal forests with slow decay rates, and conversion of natural forests into forest plantations.[lower-alpha 164] Some of the negative consequences in the trade-off scenarios (yellow quadrants) can be minimized by implementing the RED II sustainability criteria, for instance no-go areas for biomass harvesting.[lower-alpha 165] However, as the European forests age, the authors expect a moderate harvest level increase because of "forest age dynamics" and in order to avoid emissions caused by forest fires, pests and windstorms.[lower-alpha 166] In general, scientists can describe the situation as they see it and provide policy options, but ultimately it should be up to the politicians to prioritize between climate and biodiversity mitigation in the trade-off scenarios because this prioritization is based on ethical value choices, not science.[lower-alpha 167]
Pollution
The traditional use of wood in cook stoves and open fires produces pollutants, which can lead to severe health and environmental consequences. However, a shift to modern bioenergy contribute to improved livelihoods and can reduce land degradation and impacts on ecosystem services.[lower-alpha 168] According to the IPCC, there is strong evidence that modern bioenergy have "large positive impacts" on air quality.[121] Likewise, the IEA argue that traditional bioenergy is inefficient and that the phasing out of this energy source both have large health benefits and large economic benefits.[lower-alpha 169] When combusted in industrial facilities, most of the pollutants originating from woody biomass reduce by 97-99%, compared to open burning.[122] A study of the giant brown haze that periodically covers large areas in South Asia determined that two thirds of it had been principally produced by residential cooking and agricultural burning, and one third by fossil-fuel burning.[123]
Local protests
While bioenergy is generally agreed to mitigate greenhouse gas emissions on a global scale, environmental activists argue that increased biomass demand can create significant social and environmental pressure in the locations where the biomass is produced.[124] The impact is primarily related to the low surface power density of biomass. The low surface power density has the effect that much larger land areas are needed in order to produce the same amount of energy, compared to for instance fossil fuels.
Feasibility assessments to replace coal in German power plants with bush biomass harvested in Namibia, which experiences bush encroachment on over 30 million hectares, have caused protests from environmental organisations. The organisations argue that the trees and bushes store carbon, and that burning them releases more CO2 upfront than burning coal.[125] Namibian researchers argue that bush encroaching causes lower income for farmers, lower biodiversity, lower groundwater level and displacement of wildlife.[126] Long-distance transport of biomass have been criticised as wasteful and unsustainable,[127] and there have been protests against forest biomass export in Sweden[128] and Canada.[129]
In Mississippi a company producing wood pellets for UK power plants was fined $2.5m for exceeding volatile organic compounds pollution for a number of years.[130] In some cases, large areas of natural forests have been logged illegally (e.g. in Romania[131] and Siberia[132]) and the remaining forest has been put on fire to cover up illegal operations.[133]
The forest biomass debate
Smokestack emissions from forest biomass compared to coal
Smokestack emissions per produced energy unit depend on moisture content in the fuel, chemical differences between fuels and conversion efficiencies. Moisture content in wood pellets is usually below 10%, as defined in the ISO standard 17225-2:2014.[134] The coal type anthracite typically contains below 15% moisture, while bituminous contains 2–15%, sub-bituminous 10–45%, and lignite 30–60%.[135] The most common coal type in Europe is lignite.[136]

When combusted in combustion facilities with the same heat-to-electricity conversion efficiency, oven dry wood emits slightly less CO2 per unit of heat produced, compared to oven dry coal.[lower-alpha 170] However, many biomass-only combustion facilities are relatively small and inefficient, compared to the typically much larger coal plants. Further, raw biomass (for instance wood chips) can have higher moisture content than coal (especially if the coal has been dried). When this is the case, more of the wood's inherent energy must be spent solely on evaporating moisture, compared to the drier coal, which means that the amount of CO2 emitted per unit produced heat will be higher.
Some researchers (e.g. the research group Chatham House) therefore argue that "[...] the use of woody biomass for energy will release higher levels of emissions than coal [...]."[137] Likewise, the Manomet Center for Conservation Sciences argues that for smaller scale utilities, with 32% conversion efficiency for coal, and 20-25% for biomass, coal emissions are 31% less than emissions from wood chips. The assumed moisture content for wood chips is 45%. Assumed moisture content for coal is not provided.[138]
Hektor et al. argue that the moisture problem is efficiently mitigated by modern combustion facilities.[lower-alpha 151] Cowie et al. argue that stack emissions for biomass and coal is the same when biomass is co-fired with coal in large power plants, and that torrefied biomass has a higher conversion efficiency than low-rank coals.[lower-alpha 171] Wood pellets combusted at Drax in the UK (the world's largest biomass power plant) have 7% moisture, and when combusted the plant has a higher conversion efficiency than what is average for coal plants in the UK (38.6 vs. 35.9%). Stack emissions were 2% higher than the UK average for coal in 2015.[lower-alpha 172] When emissions from the wood pellet supply chain is included (the pellets are shipped to the UK from the USA), Drax claims that emissions are reduced by over 80%, compared to coal.[lower-alpha 173]
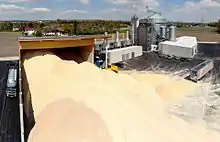
The bioenergy consultant group FutureMetrics argue that wood pellets with 6% moisture content emits 22% less CO2 for the same amount of produced heat, compared to sub-bituminous coal with 15% moisture, when both fuels are combusted in facilities with the same conversion efficiency (here 37%).[lower-alpha 174] Likewise, they state that "[...] dried wood at MC's [moisture content] below 20% have the same or less CO2 emission per MMBTU [million British thermal units] as most coal. Wood pellets at under 10% MC result in less CO2 emission than any coal under otherwise equal circumstances."[139] However, when raw wood chips are used instead (45% moisture content), this wood biomass emits 9% more CO2 than coal in general, for the same amount of produced heat.[139]
Taking into account the existing, small-scale biomass combustion facilities, IEA Bioenergy estimate that forest biomass on average produce 10% more CO2 than coal,[140] and the IPCC estimates 16%.[lower-alpha 175] Both research groups argue however that focusing on gross emissions misses the point, what counts is the net climate effect from emissions and absorption, taken together.[lower-alpha 176][lower-alpha 177] IEA Bioenergy concludes that the additional CO2 from biomass "[...] is irrelevant if the biomass is derived from sustainably managed forests."[140]
Sustainable forestry and forest protection
In the context of CO2 mitigation, the key measure regarding forest sustainability is the size of the forest carbon stock: "The core objective of all sustainable management programmes in production forests is to achieve a long-term balance between harvesting and regrowth. [...] [T]he practical effect of maintaining a balance between harvesting and regrowth is to keep long-term carbon stocks stable in managed forests."[141] The IPCC defines sustainable forestry in a similar manner, while including ecological, economic and social criteria.[lower-alpha 178]
Globally, the forest carbon stock has decreased 0.9% and tree cover 4.2% between 1990 and 2020, according to FAO.[142] IPCC states that there is disagreement about whether the global forest is shrinking or not, and quote research indicating that tree cover has increased 7.1% between 1982 and 2016.[lower-alpha 179] The IPCC writes: "While above-ground biomass carbon stocks are estimated to be declining in the tropics, they are increasing globally due to increasing stocks in temperate and boreal forests [...]."[143]
Some researchers seem to want more than "just" sustainably managed forests; they want to realize the forests full carbon storage potential. For instance the EASAC writes: "There is a real danger that present policy over-emphasises the use of forests in energy production instead of increasing forest stocks for carbon storage."[144] Further, they argue that "[...] it is the older, longer-rotation forests and protected old-growth forests that exhibit the highest carbon stocks."[145] Chatham House argues that old trees have a very high carbon absorption rate, and that felling old trees means that this large potential for future carbon absorption is lost. In addition, they argue that there is a loss of soil carbon due to the harvest operations.[146]
In Europe, 25% of all forests are protected,[147] including 89% of the primary/old-growth forests.[148] The new version of the Renewable Energy Directive (RED II), introduced in 2021, extended its sustainability criteria from liquid biofuel production to also include solid (and gaseous biofuels), which is more likely to be produced from forest biomass.[lower-alpha 180]
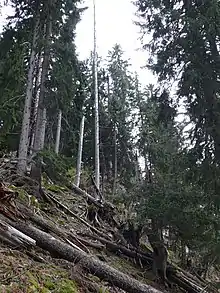
Stephenson et al. agree that old trees absorb more CO2 than young trees, because of the larger leaf area in full grown trees.[149] However, the old forest (as a whole) will eventually stop absorbing CO2 because CO2 emissions from dead trees cancel out the remaining living trees' CO2 absorption.[lower-alpha 181] The old forest (or forest stands) are also vulnerable for natural disturbances that produces CO2. The IPCC writes: "When vegetation matures or when vegetation and soil carbon reservoirs reach saturation, the annual removal of CO2 from the atmosphere declines towards zero, while carbon stocks can be maintained (high confidence). However, accumulated carbon in vegetation and soils is at risk from future loss (or sink reversal) triggered by disturbances such as flood, drought, fire, or pest outbreaks, or future poor management (high confidence)."[150] Summing up, IPCC writes that "[...] landscapes with older forests have accumulated more carbon but their sink strength is diminishing, while landscapes with younger forests contain less carbon but they are removing CO2 from the atmosphere at a much higher rate [...]."[151]
EU's Joint Research Centre write that the measured effects of harvest and replanting on soil carbon is "[...] slight in the short term, with carbon decreases concentrated in the forest floor and near the soil surface and carbon increases occurring in the deep mineral soil layers."[152] The JRC also argues that "[w]hole-tree harvesting for biomass production has little long-term effect on soil carbon stocks if surface soil layers containing organic material (O horizon) are left on site, nutrients are managed, and the site is allowed to regenerate [...]."[152] The IPCC state that the current scientific basis is not sufficient to provide soil carbon emission factors.[lower-alpha 182]
.jpg.webp)
The IPCC argues that the net climate effect from conversion of unmanaged to managed forest can be positive or negative, depending on circumstances. The carbon stock is reduced, but since managed forests grow faster than unmanaged forests, more carbon is absorbed. Positive climate effects are produced if the harvested biomass is used efficiently.[lower-alpha 183] There is a tradeoff between the benefits of having a maximized forest carbon stock, not absorbing any more carbon, and the benefits of having a portion of that carbon stock "unlocked", and instead working as a renewable fossil fuel replacement tool, for instance in sectors which are difficult or expensive to decarbonize.[lower-alpha 184][lower-alpha 185] When put to work, this carbon moves from the forest carbon pool into forest products and energy carriers, then via combustion into the atmosphere, and then back to the forest via photosynthesis. For each roundtrip, it displaces more and more of the fossil fuel carbon that is normally used in heat production, industry production and electricity production. After some roundtrips, the amount of displaced carbon far exceeds the amount of locked-away carbon: "The biomass produced cumulatively across subsequent rotations can far exceed the biomass produced in the no-bioenergy scenario, thus constituting ‘additional biomass', delivering cumulative net GHG savings that exceed the GHG cost of forest carbon stock reduction [...]."[153] Said differently: "If the forest is allowed to continue to grow, biomass energy will be replaced with fossil fuels and wood products will be replaced with alternate materials."[154] Miner argue that "in the long term, using sustainably produced forest biomass as a substitute for carbon-intensive products and fossil fuels provides greater permanent reductions in atmospheric CO2 than preservation does."[155]
Summing up the above, IEA Bioenergy writes: "As the IPCC has pointed out in several reports, forests managed for producing sawn timber, bioenergy and other wood products can make a greater contribution to climate change mitigation than forests managed for conservation alone, for three reasons. First, the sink strength diminishes as conservation forests approach maturity. Second, wood products displace GHG-intensive materials and fossil fuels. Third, carbon in forests is vulnerable to loss through natural events such as insect infestations or wildfires, as recently seen in many parts of the world including Australia and California. Managing forests can help to increase the total amount of carbon sequestered in the forest and wood products carbon pools, reduce the risk of loss of sequestered carbon, and reduce fossil fuel use."[156]
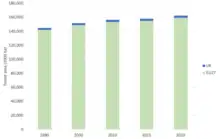
The IPCC argues that sustainable forest management "[...] aimed at providing timber, fibre, biomass and non-timber resources can provide long-term livelihood for communities, reduce the risk of forest conversion to non-forest uses (settlement, crops, etc.), and maintain land productivity, thus reducing the risks of land degradation [...]."[151] The connection between economic opportunities in forestry and increased forest size is emphasized by other researchers as well.[lower-alpha 186][lower-alpha 187] However, Cowie et al. argue that in some situations, "[...] such as high latitudes where forest productivity is very low, greater abatement may result from retaining and enhancing forest carbon stocks than harvesting forests for wood products including bioenergy, especially if the GHG savings from bioenergy use are small [...]."[153] They also argue that forests that produce income for private forest owners are unlikely to be protected. When forest products are in demand and forests therefore are managed for timber production, the most realistic no-bioenergy scenario is not forest protection but continued timber production without residues collection and utilization. In this case, the residues will instead decay on their own or be incinerated, which in both cases produce emissions without any fossil fuel displacement effect. The most realistic no-bioenergy scenarios in case of low demand for forest products is land use change to natural forests (with increased risk for wildfires), or clear-cutting to prepare for agriculture or urbanization.[lower-alpha 188]
Possibly strengthening the arguments above, data from FAO show that most wood pellets are produced in regions dominated by sustainably managed forests. Europe (including Russia) produced 54% of the world's wood pellets in 2019, and the forest carbon stock in this area increased from 158.7 to 172.4 Gt between 1990 and 2020. In the EU, above-ground forest biomass increases with 1.3% per year on average, however the increase is slowing down because the forests are maturing.[158] In 2020, the forested area covered 39.8% of EU's total land area.[157] Likewise, North America produced 29% of the worlds pellets in 2019, while forest carbon stock increased from 136.6 to 140 Gt in the same period. Carbon stock decreased from 94.3 to 80.9 Gt in Africa, 45.8 to 41.5 Gt in South and Southeast Asia combined, 33.4 to 33.1 Gt in Oceania,[lower-alpha 189] 5 to 4.1 Gt in Central America, and from 161.8 to 144.8 Gt in South America. Wood pellet production in these areas combined was 13.2% in 2019.[lower-alpha 190] However, Chatham House argues that "[f]orest carbon stock levels may stay the same or increase for reasons entirely unconnected with use for energy."[159]
Short-term urgency
Some research groups still argue that even if the European and North American forest carbon stock is increasing, it simply takes too long for harvested trees to grow back. EASAC for instance argues that since the world is on track to pass by the agreed target of 1.5 degrees temperature increase already in a decade or so, bioenergy from sources with high payback and parity times make it harder to achieve that goal. They therefore suggest that the EU should adjust its sustainability criteria so that only renewable energy with carbon payback times of less than 10 years is defined as sustainable,[lower-alpha 191] for instance wind, solar, biomass from wood residues and tree thinnings that would otherwise be burnt or decompose relatively fast, and biomass from short rotation coppicing (SRC).[160]
Cowie et al. argue that "[...] a 10-year payback time as a criterion for identifying suitable mitigation options is inconsistent with the long-term temperature goal of the Paris Agreement, which requires that a balance between emission and removals is reached in the second half of this century [...]."[lower-alpha 192] They also argue that emissions from bioenergy is fundamentally different from emissions from fossil fuels, since the former are circular and the latter linear.[lower-alpha 193] Biomass is compatible with the current energy infrastructure, so it works today, while proposed alternatives with low emissions "[...] may be restricted by immature development, high cost or dependence on new infrastructure."[lower-alpha 194]
Chatham House argues that there could be tipping points along the temperature scale where warming accelerates.[lower-alpha 195] Cowie et al. argues that tipping points are an uncertainty, but a global tipping point seems unlikely "[...] if warming does not exceed 2°C [...]."[lower-alpha 196] The IPCC argue that while there are "[...] arguments for the existence of regional tipping points, most notably in the Arctic [...]", there is "[...] no evidence for global-scale tipping points in any of the most comprehensive models evaluated to date in studies of climate evolution in the 21st century."[161]
An important presupposition for the "tree regrowth is too slow" argument is the view that carbon accounting should start when trees from particular, harvested forest stands are combusted, and not when the trees in those stands start to grow (see Temporal system boundaries, above.)[lower-alpha 197] It is within this frame of thought it becomes possible to argue that the combustion event creates a carbon debt that has to be repaid through regrowth of the harvested stands.[lower-alpha 198]
When instead assuming that carbon accounting should start when the trees start to grow, it becomes impossible to argue that the emitted carbon constitutes debt. FutureMetrics for instance argue that the harvested carbon is not a debt but "[...] a benefit that was earned by 30 years of management and growth [...]."[162] Likewise, Lamers & Junginger argue that owners of existing intensively managed, even-aged forests probably will consider the plantation establishment year as the logical start year for carbon accounting, and that harvesting redeems a carbon credit rather than creating a new debt. However, from a policy maker's perspective, [...] the main question is rather whether he/she should incentivize harvest for bioenergy or not."[163] In other words, "[...] what is important to climate policy is understanding the difference in future atmospheric GHG levels, with and without switching to woody biomass energy. Prior growth of the forest is irrelevant to the policy question [...]."[164] If this line of reasoning later is applied to new forest plantations planted on "empty" land areas as well (for instance agricultural or marginal lands), the onset of carbon accounting will shift from the planting event to the harvest event, for instance after the second rotation.
As mentioned in Spatial system boundaries above, some researchers limit their carbon accounting to particular forest stands, ignoring the carbon absorption that takes place in the rest of the forest.[lower-alpha 199] Other researchers include the whole forest landscape when doing their carbon accounting. FutureMetrics for instance argues that the whole forest continually absorbs CO2 and therefore immediately compensates for the relatively small amounts of biomass that is combusted in biomass plants from day to day.[lower-alpha 200] Likewise, IEA Bioenergy criticizes EASAC for ignoring the carbon absorption that is happening in the forest landscape, noting that there is no net loss of carbon if the annual harvest is smaller than the forest's annual growth.[lower-alpha 201]
IPCC argue along similar lines: "While individual stands in a forest may be either sources or sinks, the forest carbon balance is determined by the sum of the net balance of all stands."[165] IPCC also state that the only universally applicable approach to carbon accounting is the one that accounts for both carbon emissions and carbon removals (absorption) for managed lands (e.g. forest landscapes.)[lower-alpha 202] When the total is calculated, natural disturbances like fires and insect infestations are subtracted, and what remains is the human influence.[lower-alpha 203]
Roundwood and residues
Researchers also discuss the use of roundwood vs. logging residues. Roundwood is defined by the EU's Joint Research Centre as all woody material removed from the forest, and logging residues is the parts that would most likely remain in the forest in the case of no demand from bioenergy. 20% of the felled biomass is currently left in the forest as logging residues.[lower-alpha 204] Residues include tree tops, branches and stumps, but also pre-commercial thinnings (small, thin, young trees cleared away for increased productivity of the whole forest stand), salvage loggings and trees cleared away for fire hazard control.[lower-alpha 31] Stemwood is a type of roundwood; according to the JRC's definition the stem of the tree is cut at a height of 15 cm above ground, and extends in a straight manner up to a point where the diameter of the stem should be minimum 9 cm. See footnote for full definitions of roundwood, stemwood, fuelwood, salvage loggings, pulpwood and sawnwood.[lower-alpha 205] In general, residues and cascaded wood (wood products that are combusted for energy at the end of their service life) is seen as maximizing "the positive climate impact of bioenergy".[lower-alpha 206] In Europe, approximately 20% stemwood is used for bioenergy, with the rest from logging residues, processing residues and post consumer wood. At least half of the stemwood is sourced from short rotation coppice forests, which have low payback/parity times and provides ecosystem services.[lower-alpha 207]
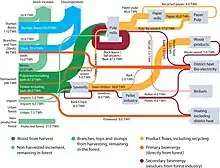
Chatham House argue that it would be better if some of the biomass defined as roundwood (most notably stems) was not harvested and used for wood pellets, as this would increase the growing carbon stock in the forest.[167] They also argue that "[...] trees that would not qualify as high-quality sawtimber could nevertheless be used for pulp, panels or laminated products."[168] In other words, it would be better if this low-value biomass was used as raw material for other products than for wood pellets, since carbon is stored for a longer period of time in the former case. Chatham House also argues that all available sawmill residue is already being used for pellet production, so there is no room for expansion. For the bioenergy sector to significantly expand in the future, more of the harvested pulpwood must go to pellet mills.[167]
Cowie et al. argue that approximately 20% "[...] roundwood (also referred to as stemwood), such as small stems from forest thinning [...]" is used for wood pellets in the USA. However, the use of stemwood from short-rotation forests have short parity times, and in long-rotation forests, the stemwood used for wood pellets usually consists of by-products from sawnwood production (thinnings or irregular/bent/damaged stem sections from larger trees.) Sawnwood production provides over 90% of foresters income and is the main reason forestry exist.[lower-alpha 112][lower-alpha 208] Without a market for the low-quality stem sections or thinnings, they would have been left in the forest to decay, or been incinerated at roadside. Cowie et al. also argue that using thinnings for bioenergy strengthens the carbon displacement effect of harvested wood products, since the thinning practice help produce more sawnwood.[lower-alpha 209]
Likewise, FutureMetrics argues that it makes no sense for foresters to sell sawlog-quality roundwood to pellet mills, since they get a lot more money for this part of the tree from sawmills. Foresters make 80-90% of their income from sawlog-quality roundwood and only 10-15% from pulpwood, defined as a.) the upper part of the stem that is too thin or too bent to be used for sawnwood production, plus branches, and b.) tree thinnings. This low-value biomass is mainly sold to pulp mills for paper production, but in some cases also to pellet mills for pellet production.[169] Pellets are typically made from sawmill residues in areas where there are sawmills, but also from pulpwood in areas without sawmills.[lower-alpha 210] Lamers & Junginger argue that the "[...] higher economic value for timber and cellulose [pulp] products makes large-scale use of whole-trees for energy purposes highly unlikely wherever there is regional competition for the fiber."[lower-alpha 211] According to EU's Joint Research Centre, both the bioenergy sector, the wood panel sector and the pulp sector "[...] are all dependant on the demand for sawnwood, and they compete for the same feedstocks."[lower-alpha 212]
Short-term vs long-term climate benefits
According to Cowie et al., "[...] the perceived attractiveness of specific forest bioenergy options is influenced by the priority given to near-term versus longer term climate objectives."[170] IPCC for instance states that forest carbon emission avoidance strategies always give a short-term mitigation benefit, but argue that the long-term benefits from sustainable forestry activities are more important:
Relative to a baseline, the largest short-term gains are always achieved through mitigation activities aimed at emission avoidance [...]. But once an emission has been avoided, carbon stocks on that forest will merely be maintained or increased slightly. [...] In the long term, sustainable forest management strategy aimed at maintaining or increasing forest carbon stocks, while producing an annual yield of timber, fibre, or energy from the forest, will generate the largest sustained mitigation benefit.[165]
Similarly, addressing the issue of climate consequences for modern bioenergy in general, the IPCC states: "Life-cycle GHG emissions of modern bioenergy alternatives are usually lower than those for fossil fuels [...]."[171] Consequently, most of IPCC's GHG mitigation pathways include substantial deployment of bioenergy technologies.[4] Limited or no bioenergy pathways leads to increased climate change or shifting bioenergy's mitigation load to other sectors.[lower-alpha 15] In addition, mitigation cost increases.[lower-alpha 213]
IEA Bioenergy argue that an exclusive focus on the short-term make it harder to achieve efficient carbon mitigation in the long term, and compare investments in new bioenergy technologies with investments in other renewable energy technologies that only provide emission reductions after 2030, for instance the scaling-up of battery manufacturing or the development of rail infrastructure.[lower-alpha 214] The National Association of University Forest Resources Programs recommends a time horizon of 100 years in order to produce a realistic assessment of cumulative emissions.[lower-alpha 215]
References
References |
|---|
Quotes and comments
Shortened footnotes
Bibliography
|
External links
See also
- Forestry
- Pellet fuel
- Woodchips
- Cogeneration
- Bioenergetics
- Bioenergy Action Plan
- Bioenergy in China
- Bioenergy Program
- Bioenergy village
- Bioenergy with carbon capture and storage
- Biomass heating system
- Biomass to liquid
- Bioproducts
- Biorefinery
- Biofuel
- Biochar
- Biogas
- Carbon accounting
- Carbon footprint
- Energy (disambiguation)
- Energy crop
- Miscanthus × giganteus
- Cenchrus purpureus
- Energy forestry
- Gasification
- Geothermal gradient
- Ghent Bio-Energy Valley
- Joint BioEnergy Institute
- Hydropower
- Renewable energy transition
- Solar energy
- Tidal power
- Vitalism
- Wave power
- Wind power
- World Bioenergy Association