Capnography
Capnography is the monitoring of the concentration or partial pressure of carbon dioxide (CO
2) in the respiratory gases. Its main development has been as a monitoring tool for use during anesthesia and intensive care. It is usually presented as a graph of CO
2 (measured in kilopascals, "kPa" or millimeters of mercury, "mmHg") plotted against time, or, less commonly, but more usefully, expired volume (known as volumetric capnography). The plot may also show the inspired CO
2, which is of interest when rebreathing systems are being used. When the measurement is taken at the end of a breath (exhaling), it is called "end tidal" CO
2 (PETCO2).[1]
| Capnography | |
|---|---|
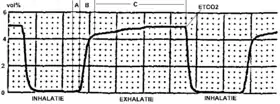
 Typical capnogram. Normal breath cycle. | |
| Other names | End tidal CO2 (PETCO2) |
| MeSH | D019296 |
The capnogram is a direct monitor of the inhaled and exhaled concentration or partial pressure of CO
2, and an indirect monitor of the CO
2 partial pressure in the arterial blood. In healthy individuals, the difference between arterial blood and expired gas CO
2 partial pressures is very small (normal difference 4-5 mmHg). In the presence of most forms of lung disease, and some forms of congenital heart disease (the cyanotic lesions) the difference between arterial blood and expired gas increases which can be an indication of new pathology or change in the cardiovascular-ventilation system.[2] [3]
Medical Use
Oxygenation and capnography, although related, remain distinct elements in the physiology of respiration. Ventilation refers to the mechanical process of which the lungs expand and exchange volumes of gasses, however respiration further describes the exchange of gasses (mainly CO
2 and O
2) at the level of the alveoli. The process of respiration can be divided into two main functions: elimination of CO
2 waste and replenishing tissues with fresh O
2. Oxygenation (typically measured via pulse oximetry) measures the latter portion of this system. Capnography describes the elimination of CO
2 which may reveal greater clinical use than oxygenation status.[4]
During the normal cycle of respiration, a single breath can be divided into two phases: inspiration and expiration. At the beginning of inspiration, the lungs expand and CO
2 free gasses fill the lungs. As the alveoli are filled with this new gas, the concentration of CO
2 that fills the alveoli is dependent on the ventilation of the alveoli and the perfusion (blood flow) that is delivering the CO
2 for exchange. Once expiration begins to occur, the lung volume decreases as air is forced out the respiratory tract. The volume of CO
2 that is exhaled at the end of exhalation is generated as a by product of metabolism from tissue throughout the body. The delivery of CO
2 to the alveoli for exhalation is dependent on an intact cardiovascular system to ensure adequate blood flow from the tissue to the alveoli. If cardiac output (the amount of blood that is pumped out of the heart) is decreased, the ability to transport CO
2 is also decreased which is reflected in a decreased expired amount of CO
2. The relationship of cardiac output and end tidal CO
2 is linear, such that as cardiac output increases or decreases, the amount of CO
2 is also adjusted in the same manner. Therefore the monitoring of end tidal CO
2 can provide vital information on the integrity of the cardiovascular system, specifically how well the heart is able to pump blood.[5]
The amount of CO
2 that is measured during each breath requires an intact cardiovascular system to delivery the CO
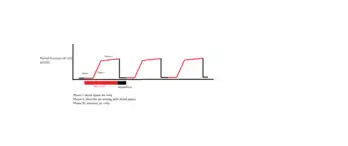
2 to the alveoli which is the functional unit of the lungs. During phase I of expiration, the CO
2 transported to the lungs gas occupies a given space that is not involved in gas exchange, called dead space. Phase II of expiration is when the CO
2 within the lungs is forced up the respiratory tract on its way to leave the body, which causes mixing of the air from the dead space with the air in the functional alveoli responsible for gas exchange. Phase III is the final portion of expiration which reflects CO
2 only from the alveoli and not the dead space. These three phases are important to understand in clinical scenarios since a change in the shape and absolute values can indicate respiratory and/or cardiovascular compromise.[6]

| Capnogram on Monitor | |
|---|---|
Applications
- Assessing Airway Integrity
- Confirmation of Endotracheal Tube Placement
- Predictor of Outcomes in the Intensive Care Unit
- Intraoperative Complications (ie. air embolism, thromboembolism, etc.)
- CPR use in ACLS (Advanced Cardiovascular Life Support)
- Procedural Sedation Monitoring
Anesthesia

During anesthesia, there is interplay between two components: the patient and the anesthesia administration device (which is usually a breathing circuit and a ventilator). The critical connection between the two components is either an endotracheal tube or a mask, and CO
2 is typically monitored at this junction. Capnography directly reflects the elimination of CO
2 by the lungs to the anesthesia device. Indirectly, it reflects the production of CO
2 by tissues and the circulatory transport of CO
2 to the lungs.[7]
When expired CO
2 is related to expired volume rather than time, the area beneath the curve represents the volume of CO
2 in the breath, and thus over the course of a minute, this method can yield the CO
2 per minute elimination, an important measure of metabolism. Sudden changes in CO
2 elimination during lung or heart surgery usually imply important changes in cardiorespiratory function.[8]
Capnography has been shown to be more effective than clinical judgement alone in the early detection of adverse respiratory events such as hypoventilation, esophageal intubation and circuit disconnection; thus allowing patient injury to be prevented. During procedures done under sedation, capnography provides more useful information, e.g. on the frequency and regularity of ventilation, than pulse oximetry.[9][10]
Capnography provides a rapid and reliable method to detect life-threatening conditions (malposition of tracheal tubes, unsuspected ventilatory failure, circulatory failure and defective breathing circuits) and to circumvent potentially irreversible patient injury.
Capnography and pulse oximetry together could have helped in the prevention of 93% of avoidable anesthesia mishaps according to an ASA (American Society of Anesthesiologists) closed claim study.[11]
Emergency medical services
Capnography is increasingly being used by EMS personnel to aid in their assessment and treatment of patients in the prehospital environment. These uses include verifying and monitoring the position of an endotracheal tube or a blind insertion airway device. A properly positioned tube in the trachea guards the patient's airway and enables the paramedic to breathe for the patient. A misplaced tube in the esophagus can lead to the patient's death if it goes undetected. [12]
A study in the March 2005 Annals of Emergency Medicine, comparing field intubations that used continuous capnography to confirm intubations versus non-use showed zero unrecognized misplaced intubations in the monitoring group versus 23% misplaced tubes in the unmonitored group.[13] The American Heart Association (AHA) affirmed the importance of using capnography to verify tube placement in their 2005 CPR and Emergency Cardiovascular Care Guidelines.[14]
The AHA also notes in their new guidelines that capnography, which indirectly measures cardiac output, can also be used to monitor the effectiveness of CPR and as an early indication of return of spontaneous circulation (ROSC). Studies have shown that when a person doing CPR tires, the patient's end-tidal CO
2 (PETCO2, the level of carbon dioxide released at the end of expiration) falls, and then rises when a fresh rescuer takes over. Other studies have shown when a patient experiences return of spontaneous circulation, the first indication is often a sudden rise in the PETCO2 as the rush of circulation washes untransported CO
2 from the tissues. Likewise, a sudden drop in PETCO2 may indicate the patient has lost pulses and CPR may need to be initiated.[15]
Paramedics are also now beginning to monitor the PETCO2 status of nonintubated patients by using a special nasal cannula that collects the carbon dioxide. A high PETCO2 reading in a patient with altered mental status or severe difficulty breathing may indicate hypoventilation and a possible need for the patient to be intubated. Low PETCO2 readings on patients may indicate hyperventilation.[16]
Capnography, because it provides a breath by breath measurement of a patient's ventilation, can quickly reveal a worsening trend in a patient's condition by providing paramedics with an early warning system into a patient's respiratory status. When compared to oxygenation which is measured by pulse oximetry, there are several disadvantages that capnography can help address to provide a more accurate reflection of cardiovascular integrity. One shortcoming of measuring pulse oximetry alone is that administration of supplemental oxygen (ie. via nasal cannula) can delay desaturation in a patient if they stopped breathing, therefore delaying medical intervention. Capnography provides a rapid way to directly assess ventilation status and indirectly assess cardiac function. Clinical studies are expected to uncover further uses of capnography in asthma, congestive heart failure, diabetes, circulatory shock, pulmonary embolus, acidosis, and other conditions, with potential implications for the prehospital use of capnography.[17]
Registered nurses
Registered nurses in critical care settings may use capnography to determine if a nasogastric tube, which is used for feeding, has been placed in the trachea as opposed to the esophagus.[18] Usually a patient will cough or gag if the tube is misplaced, but most patients in critical care settings are sedated or comatose. If a nasogastric tube is accidentally placed in the trachea instead of the esophagus, the tube feedings will go into the lungs, which is a life-threatening situation. If the monitor displays typical CO
2 waveforms then placement should be confirmed.[19]
Diagnostic usage
Capnography provides information about CO
2 production, pulmonary (lung) perfusion, alveolar ventilation, respiratory patterns, and elimination of CO
2 from the anesthesia breathing circuit and ventilator. The shape of the curve is affected by some forms of lung disease; in general there are obstructive conditions such as bronchitis, emphysema and asthma, in which the mixing of gases within the lung is affected.[20]
Conditions such as pulmonary embolism and congenital heart disease, which affect perfusion of the lung, do not, in themselves, affect the shape of the curve, but greatly affect the relationship between expired CO
2 and arterial blood CO
2. Capnography can also be used to measure carbon dioxide production, a measure of metabolism. Increased CO
2 production is seen during fever and shivering. Reduced production is seen during anesthesia and hypothermia.[21]
Working mechanism

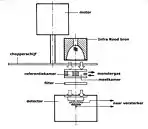
Capnographs work on the principle that CO
2 is a polyatomic gas and therefore absorbs infrared radiation. A beam of infrared light is passed across the gas sample to fall on a sensor. The presence of CO
2 in the gas leads to a reduction in the amount of light falling on the sensor, which changes the voltage in a circuit. The analysis is rapid and accurate, but the presence of nitrous oxide in the gas mix changes the infrared absorption via the phenomenon of collision broadening.[22] This must be corrected for measuring the CO
2 in human breath by measuring its infrared absorptive power. This was established as a reliable technique by John Tyndall in 1864, though 19th and early 20th century devices were too cumbersome for everyday clinical use.[23] Today, technologies have since improved and are able to measure the values of CO
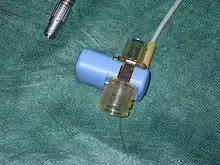
2 near instantaneously and has become a standard practice in medical settings. There are currently two main types of CO
2 sensors that are used in clinical practice: main-stream sensors and side-stream sensors. Both effectively serve the same function to quantify the amount of CO
2 that is being exhaled in each breath.
Capnogram model
The capnogram waveform provides information about various respiratory and cardiac parameters. The capnogram double-exponential model attempts to quantitatively explain the relationship between respiratory parameters and the exhalatory segment of a capnogram waveform.[24] According to the model, each exhalatory segment of capnogram waveform follows the analytical expression:
where
- represents the partial pressure of carbon dioxide measured by the capnogram as a function of time since the beginning of exhalation.
- represents the alveolar partial pressure of carbon dioxide.
- represents the inverse of the dead space fraction (i.e. the ratio of tidal volume to dead space volume).
- represents the pulmonary time constant (i.e. the product of pulmonary resistance and compliance)
In particular, this model explains the rounded "shark-fin" shape of the capnogram observed in patients with obstructive lung disease.
See also
Citations
- Bhavani-Shankar, Kodali; Philip, James (October 2000). "Defining segments and phases of a time capnogram". Anesth Analg. 91 (4): 973–977.
- Nunn, J; Hill, D (May 1960). "Respiratory dead space and arterial to end-tidal carbon dioxide tension difference in anesthetized man". J Appl Physiol. 15: 383–389.
- Williams, Emma; Dassios, Theodore; Greenough, Anne (October 2021). "Carbon dioxide monitoring in the newborn". Pediatr Pulmonol. 56 (10): 3148–3156.
- Lam, Thach; Nagappa, Mahesh; Wong, Jean; Singh, Mandeep; Wong, David; Chung, Frances (December 2017). "Continuous Pulse Oximetry and Capnography Monitoring for Postoperative Respiratory Depression and Adverse Events: A Systematic Review and Meta-analysis". Anesthesia & Analgesia. 125 (6): 2019–2029. doi:10.1213/ANE.0000000000002557. ISSN 0003-2999.
- Siobal, Mark (October 2016). "Monitoring Exhaled Carbon Dioxide". Respir Care. 61 (10): 1397–1416.
- Benumof, Jeffrey (April 1998). "Interpretation of capnography". AANA J. 661 (2): 169–176.
- Weil, Max; Bisera, Jose; Trevino; Rackow, Eric (October 2016). "Cardiac output and end-tidal carbon dioxide". Crit Care Med. 13 (11): 907–909.
- J. S. Gravenstein; Michael B. Jaffe; Nikolaus Gravenstein; David A. Paulus, eds. (17 March 2011). Capnography (2 ed.). Cambridge University Press. ISBN 978-0-521-51478-1. OCLC 1031490358.
- Lightdale, Jenifer R.; Goldmann, Donald A.; Feldman, Henry A.; Newburg, Adrienne R.; DiNardo, James A.; Fox, Victor L. (June 2006). "Microstream capnography improves patient monitoring during moderate sedation: a randomized, controlled trial". Pediatrics. 117 (6): e1170–1178. doi:10.1542/peds.2005-1709. ISSN 1098-4275. PMID 16702250.
- Burton, John H.; Harrah, John D.; Germann, Carl A.; Dillon, Douglas C. (May 2006). "Does end-tidal carbon dioxide monitoring detect respiratory events prior to current sedation monitoring practices?". Academic Emergency Medicine. 13 (5): 500–504. doi:10.1197/j.aem.2005.12.017. ISSN 1553-2712. PMID 16569750.
- John H. Tinker, David L. Dull, Robert A. Caplan, Richard J. Ward, Frederick W. Cheney; Role of Monitoring Devices in Prevention of Anesthetic Mishaps: A Closed Claims Analysis. Anesthesiology 1989; 71:541–546 doi: https://doi.org/10.1097/00000542-198910000-00010
- Katz, Steven; Falk, Jay (January 2001). "Misplaced endotracheal tubes by paramedics in an urban emergency medical services system". Ann Emerg Med. 37 (1): 32–37.
- Silvestri, Salvatore; Ralls, George A.; Krauss, Baruch; Thundiyil, Josef; Rothrock, Steven G.; Senn, Amy; Carter, Eric; Falk, Jay (May 2005). "The effectiveness of out-of-hospital use of continuous end-tidal carbon dioxide monitoring on the rate of unrecognized misplaced intubation within a regional emergency medical services system". Annals of Emergency Medicine. 45 (5): 497–503. doi:10.1016/j.annemergmed.2004.09.014. ISSN 1097-6760. PMID 15855946.
- Hazinski, Mary Fran; Nadkarni, Vinay M.; Hickey, Robert W.; O’Connor, Robert; Becker, Lance B.; Zaritsky, Arno (13 December 2005). "Major Changes in the 2005 AHA Guidelines for CPR and ECC". Circulation. 112 (24_supplement): IV–206. doi:10.1161/CIRCULATIONAHA.105.170809.
- Long, Brit; Koyfman, Alex; Vivirito, Michael A. (December 2017). "Capnography in the Emergency Department: A Review of Uses, Waveforms, and Limitations". The Journal of Emergency Medicine. 53 (6): 829–842. doi:10.1016/j.jemermed.2017.08.026. ISSN 0736-4679. PMID 28993038.
- Davis, Daniel; Dunford, James; Ochs, Mel; Park, Kenneth; Hoyt, David (April 2004). "The use of quantitative end-tidal capnometry to avoid inadvertent severe hyperventilation in patients with head injury after paramedic rapid sequence intubation". J Trauma. 56 (4): 808–814.
- "Experts: Where capnography is headed". EMS1. Retrieved 16 November 2021.
- Potter, Patricia Ann, and Anne Griffin Perry. "Nutrition." Essentials for nursing practice. Eighth ed. St. Louis: Elsevier, 2015. 940. Print.
- Roubenoff, Ronenn; Ravich, William (April 1998). "Pneumothorax due to nasogastric feeding tubes. Report of four cases, review of the literature, and recommendations for prevention". Arch Intern Med. 149 (1): 184–188.
- Yaron, Michael; Padyk, Paul; Hutsinpiller, Molly; Cairns, Charles (October 1996). "Utility of the expiratory capnogram in the assessment of bronchospasm". Ann Emerg Med. 28 (4): 403–407.
- Danzl, Daniel (February 2002). "Hypothermia system". Semin Respir Crit Care Med. 23 (1): 57–68.
- Raemer DB, Calalang I (April 1991). "Accuracy of end-tidal carbon dioxide tension analyzers". J Clin Monit. 7 (2): 195–208. doi:10.1007/BF01618124. PMID 1906531.
- Jaffe MB (September 2008). "Infrared measurement of carbon dioxide in the human breath: "breathe-through" devices from Tyndall to the present day". Anesth. Analg. 107 (3): 890–904. doi:10.1213/ane.0b013e31817ee3b3. PMID 18713902.
- Abid, Abubakar (May 2017). "Model-Based Estimation of Respiratory Parameters from Capnography, With Application to Diagnosing Obstructive Lung Disease". IEEE Transactions on Biomedical Engineering. 64 (12): 2957–2967. doi:10.1109/TBME.2017.2699972. PMID 28475040.