Electrocochleography
Electrocochleography (abbreviated ECochG or ECOG) is a technique of recording electrical potentials generated in the inner ear and auditory nerve in response to sound stimulation, using an electrode placed in the ear canal or tympanic membrane. The test is performed by an otologist or audiologist with specialized training, and is used for detection of elevated inner ear pressure (endolymphatic hydrops) or for the testing and monitoring of inner ear and auditory nerve function during surgery.[1]
Clinical applications
The most common clinical applications of electrocochleography include:
- Objective identification and monitoring of Ménière's disease and endolymphatic hydrops (EH)
- Intraoperative monitoring of auditory system function during surgery on the brainstem or cerebellum
- Enhancement of Wave I of the auditory brainstem response, particularly in patients who are hard of hearing[1]
- Diagnosis of auditory neuropathy
Cochlear physiology


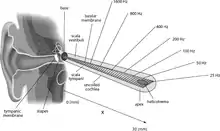
The basilar membrane and the hair cells of the cochlea function as a sharply tuned frequency analyzer.[2] Sound is transmitted to the inner ear via vibration of the tympanic membrane, leading to movement of the middle ear bones (malleus, incus, and stapes). Movement of the stapes on the oval window generates a pressure wave in the perilymph within the cochlea, causing the basilar membrane to vibrate. Sounds of different frequencies vibrate different parts of the basilar membrane, and the point of maximal vibration amplitude depends on the sound frequency.[3]
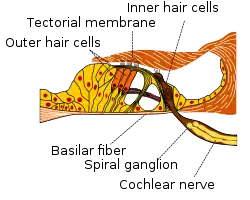
As the basilar membrane vibrates, the hair cells attached to this membrane are rhythmically pushed up against the tectorial membrane, bending the hair cell stereocilia. This opens mechanically gated ion channels on the hair cell, allowing influx of potassium (K+) and calcium (Ca2+) ions. The flow of ions generates an AC current through the hair cell surface, at the same frequency as the acoustic stimulus. This measurable AC voltage is called the cochlear microphonic (CM), which mimics the stimulus. The hair cells function as a transducer, converting the mechanical movement of the basilar membrane into electrical voltage, in a process requiring ATP from the stria vascularis as an energy source.
The depolarized hair cell releases neurotransmitters across a synapse to primary auditory neurons of the spiral ganglion. Upon reaching receptors on the postsynaptic spiral ganglion neurons, the neurotransmitters induce a postsynaptic potential or generator potential in the neuronal projections. When a certain threshold potential is reached, the spiral ganglion neuron fires an action potential, which enters the auditory processing pathway of the brain.
Cochlear potentials
A resting endolymphatic potential of a normal cochlea is + 80 mV. There are at least 3 other potentials generated upon cochlear stimulation:
- Cochlear microphonic (CM)
- Summating potential (SP)
- Action potential (AP)
As described above, the cochlear microphonic (CM) is an alternating current (AC) voltage that mirrors the waveform of the acoustic stimulus. It is dominated by the outer hair cells of the organ of Corti. The magnitude of the recording is dependent on the proximity of the recording electrodes to the hair cells. The CM is proportional to the displacement of the basilar membrane.[3] A fourth potential, the auditory nerve neurophonic, is sometimes dissociated from the CM. The neurophonic represents the neural part (auditory nerve spikes) phased-locked to the stimulus and is similar to the Frequency following response.[4]
The summating potential (SP), first described by Tasaki et al. in 1954, represents the direct current (DC) response of the hair cells as they move in conjunction with the basilar membrane,[5] as well as the DC response from dendritic and axonal potentials of the auditory nerve.[6] The SP is the stimulus-related potential of the cochlea. Although historically it has been the least studied, renewed interest has surfaced due to changes in the SP reported in cases of endolymphatic hydrops or Ménière's disease.
The auditory nerve action potential, also called the compound action potential (CAP), is the most widely studied component in ECochG. The AP represents the summed response of the synchronous firing of the nerve fibers. It also appears as an AC voltage. The first and largest wave (N1) is identical to wave I of auditory brainstem response (ABR). Following this is N2, which is identical to wave II of the ABR. The magnitude of the action potential reflects the number of fibers that are firing. The latency of the AP is measured as the time between the onset and the peak of the N1 wave.
Procedure and recording parameters
ECochG can be performed with either invasive or non-invasive electrodes. Invasive electrodes, such as transtympanic (TT) needles, give clearer, more robust electrical responses (with larger amplitudes) since the electrodes are very close to the voltage generators. The needle is placed on the promontory wall of the middle ear and the round window. Non-invasive, or extratympanic (ET), electrodes have the advantage of not causing pain or discomfort to the patient. Unlike with invasive electrodes, there is no need for sedation, anesthesia, or medical supervision. The responses, however, are smaller in magnitude.
Auditory stimuli in the form of broadband clicks 100 microseconds in duration are used. The stimulus polarity can be rarefaction polarity, condensation polarity, or alternating polarity. Signals are recorded from a primary recording (non-inverted) electrode located in the ear canal, tympanic membrane, or promontory (depending on type of electrode used). Reference (inverting) electrodes can be placed on the contralateral earlobe, mastoid, or ear canal.
The signal is processed, including signal amplification (by as much as a factor 100000 for extratympanic electrode recordings), noise filtration, and signal averaging. A band-pass filter from 10 Hz to 1.5 kHz is often used.
Interpretation of results
The CM, SP, and AP are all used in the diagnosis of endolymphatic hydrops and Ménière's disease. In particular, abnormally high SP and a high SP:AP ratio are signs of Ménière's disease. An SP:AP ratio of 0.45 or greater is considered abnormal.
History
The CM was first discovered in 1930 by Ernest Wever and Charles Bray in cats.[7] Wever and Bray mistakenly concluded that this recording was generated by the auditory nerve. They named the discovery the "Wever-Bray effect". Hallowell Davis and A.J. Derbyshire from Harvard replicated the study and concluded that the waves were in fact cochlear origin and not from the auditory nerve.[8]
Fromm et al. were the first investigators to employ the ECochG technique in humans by inserting a wire electrode through the tympanic membrane and recording the CM from the niche of the round window and cochlear promontory. Their first measurement of the CM in humans was in 1935.[9] They also discovered the N1, N2, and N3 waves following the CM, but it was Tasaki who identified these waves as auditory nerve action potentials.
Fisch and Ruben were the first to record the compound action potentials from both the round window and the eighth cranial nerve (CN VIII) in cats and mice.[10] Ruben was also the first person to use CM and AP clinically.
The summating potential, a stimulus-related hair cell potential, was first described by Tasaki and colleagues in 1954.[5] Ernest J. Moore was the first investigator to record the CM from surface electrodes. In 1971, Moore conducted five experiments in which he recorded CM and AP from 38 human subjects using surface electrodes. The purpose of the experiment was to establish the validity of the responses and to develop an artifact-free earphone system.[11] Unfortunately, bulk of his work was never published.
References
- Ferraro, John A. (November 15, 2000). "Clinical Electrocochleography: Overview of Theories, Techniques and Applications". Audiology Online. Retrieved 15 September 2014.
- Kohlloffel LUE (1972). "A study of basilar membrane vibrations III: The basilar membrane frequency response curve in the living guinea pig". Acustica. 27: 82.
- Eggermont JJ (1974). "Basic Principles for Electrocochleography". Acta Oto-Laryngologica Supplementum. 316: 7–16. doi:10.1080/16512251.1974.11675742. PMID 4525558.
-
Snyder RL, Schreiner CE (1984). "The auditory neurophonic: basic properties". Hearing Research. 15 (3): 261–80. doi:10.1016/0378-5955(84)90033-9. PMID 6501114. S2CID 41111768.
{{cite journal}}: CS1 maint: uses authors parameter (link) - Tasaki I, et al. (1954). "Exploration of cochlear potentials in guinea pigs with a micro-electrode". Journal of the Acoustical Society of America. 26 (5): 765. Bibcode:1954ASAJ...26..765T. doi:10.1121/1.1907415.
-
Lutz BT; et al. (2022). "Neural Contributions to the Cochlear Summating Potential: Spiking and Dendritic Components". JARO. 23 (3): 351–363. doi:10.1007/s10162-022-00842-6. PMC 9085993. PMID 35254541. S2CID 247252398.
{{cite journal}}: CS1 maint: multiple names: authors list (link) - Wever EG, Bray CW (1930). "Auditory Nerve Impulses". Science. 71 (1834): 215. doi:10.1126/science.71.1834.215. PMID 17818230.
- Moore EJ (1983). Bases of auditory brain-stem evoked responses. Grune & Stratton, Inc.
- Fromm B, et al. (1934–1935). "Studies in the mechanism of the Wever-Bray effect". Acta Oto-Laryngologica. 22 (3): 477–486. doi:10.3109/00016483509118125.
- Fisch UP, Ruben RJ (1962). "Electrical acoustical response to click stimulation after section of the eighth nerve". Acta Oto-Laryngologica. 54 (1–6): 532–42. doi:10.3109/00016486209126971. PMID 13893094.
- Moore EJ (1971). Human cochlear microphonics and auditory nerve action potentials from surface electrodes. Unpublished Ph.D. dissertation, University of Wisconsin. Madison, Wisconsin.