Resonance
Resonance describes the phenomenon of increased amplitude that occurs when the frequency of an applied periodic force (or a Fourier component of it) is equal or close to a natural frequency of the system on which it acts. When an oscillating force is applied at a resonant frequency of a dynamic system, the system will oscillate at a higher amplitude than when the same force is applied at other, non-resonant frequencies.[3]
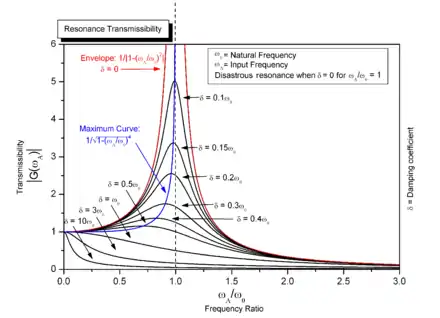
Frequencies at which the response amplitude is a relative maximum are also known as resonant frequencies or resonance frequencies of the system.[3] Small periodic forces that are near a resonant frequency of the system have the ability to produce large amplitude oscillations in the system due to the storage of vibrational energy.
Resonance phenomena occur with all types of vibrations or waves: there is mechanical resonance, Orbital resonance, acoustic resonance, electromagnetic resonance, nuclear magnetic resonance (NMR), electron spin resonance (ESR) and resonance of quantum wave functions. Resonant systems can be used to generate vibrations of a specific frequency (e.g., musical instruments), or pick out specific frequencies from a complex vibration containing many frequencies (e.g., filters).
The term resonance (from Latin resonantia, 'echo', from resonare, 'resound') originated from the field of acoustics, particularly the sympathetic resonance observed in musical instruments, e.g., when one string starts to vibrate and produce sound after a different one is struck.
Overview
Resonance occurs when a system is able to store and easily transfer energy between two or more different storage modes (such as kinetic energy and potential energy in the case of a simple pendulum). However, there are some losses from cycle to cycle, called damping. When damping is small, the resonant frequency is approximately equal to the natural frequency of the system, which is a frequency of unforced vibrations. Some systems have multiple, distinct, resonant frequencies.
Examples

A familiar example is a playground swing, which acts as a pendulum. Pushing a person in a swing in time with the natural interval of the swing (its resonant frequency) makes the swing go higher and higher (maximum amplitude), while attempts to push the swing at a faster or slower tempo produce smaller arcs. This is because the energy the swing absorbs is maximized when the pushes match the swing's natural oscillations.
Resonance occurs widely in nature, and is exploited in many devices. It is the mechanism by which virtually all sinusoidal waves and vibrations are generated. Many sounds we hear, such as when hard objects of metal, glass, or wood are struck, are caused by brief resonant vibrations in the object. Light and other short wavelength electromagnetic radiation is produced by resonance on an atomic scale, such as electrons in atoms. Other examples of resonance:
- Timekeeping mechanisms of modern clocks and watches, e.g., the balance wheel in a mechanical watch and the quartz crystal in a quartz watch
- Tidal resonance of the Bay of Fundy
- Acoustic resonances of musical instruments and the human vocal tract
- Shattering of a crystal wineglass when exposed to a musical tone of the right pitch (its resonant frequency)
- Friction idiophones, such as making a glass object (glass, bottle, vase) vibrate by rubbing around its rim with a fingertip
- Electrical resonance of tuned circuits in radios and TVs that allow radio frequencies to be selectively received
- Creation of coherent light by optical resonance in a laser cavity
- Orbital resonance as exemplified by some moons of the Solar System's gas giants
- Material resonances in atomic scale are the basis of several spectroscopic techniques that are used in condensed matter physics
- Electron spin resonance
- Mössbauer effect
- Nuclear magnetic resonance
Linear systems
Resonance manifests itself in many linear and nonlinear systems as oscillations around an equilibrium point. When the system is driven by a sinusoidal external input, a measured output of the system may oscillate in response. The ratio of the amplitude of the output's steady-state oscillations to the input's oscillations is called the gain, and the gain can be a function of the frequency of the sinusoidal external input. Peaks in the gain at certain frequencies correspond to resonances, where the amplitude of the measured output's oscillations are disproportionately large.
Since many linear and nonlinear systems that oscillate are modeled as harmonic oscillators near their equilibria, this section begins with a derivation of the resonant frequency for a driven, damped harmonic oscillator. The section then uses an RLC circuit to illustrate connections between resonance and a system's transfer function, frequency response, poles, and zeroes. Building off the RLC circuit example, the section then generalizes these relationships for higher-order linear systems with multiple inputs and outputs.
The driven, damped harmonic oscillator
Consider a damped mass on a spring driven by a sinusoidal, externally applied force. Newton's second law takes the form
|
(1) |
where m is the mass, x is the displacement of the mass from the equilibrium point, F0 is the driving amplitude, ω is the driving angular frequency, k is the spring constant, and c is the viscous damping coefficient. This can be rewritten in the form
|
(2) |
where
- is called the undamped angular frequency of the oscillator or the natural frequency,
- is called the damping ratio.
Many sources also refer to ω0 as the resonant frequency. However, as shown below, when analyzing oscillations of the displacement x(t), the resonant frequency is close to but not the same as ω0. In general the resonant frequency is close to but not necessarily the same as the natural frequency.[4] The RLC circuit example in the next section gives examples of different resonant frequencies for the same system.
The general solution of Equation (2) is the sum of a transient solution that depends on initial conditions and a steady state solution that is independent of initial conditions and depends only on the driving amplitude F0, driving frequency ω, undamped angular frequency ω0, and the damping ratio ζ. The transient solution decays in a relatively short amount of time, so to study resonance it is sufficient to consider the steady state solution.
It is possible to write the steady-state solution for x(t) as a function proportional to the driving force with an induced phase change φ,
|
(3) |
where
The phase value is usually taken to be between −180° and 0 so it represents a phase lag for both positive and negative values of the arctan argument.

Resonance occurs when, at certain driving frequencies, the steady-state amplitude of x(t) is large compared to its amplitude at other driving frequencies. For the mass on a spring, resonance corresponds physically to the mass's oscillations having large displacements from the spring's equilibrium position at certain driving frequencies. Looking at the amplitude of x(t) as a function of the driving frequency ω, the amplitude is maximal at the driving frequency
ωr is the resonant frequency for this system. Again, note that the resonant frequency does not equal the undamped angular frequency ω0 of the oscillator. They are proportional, and if the damping ratio goes to zero they are the same, but for non-zero damping they are not the same frequency. As shown in the figure, resonance may also occur at other frequencies near the resonant frequency, including ω0, but the maximum response is at the resonant frequency.
Also note that ωr is only real and non-zero if , so this system can only resonate when the harmonic oscillator is significantly underdamped. For systems with a very small damping ratio and a driving frequency near the resonant frequency, the steady state oscillations can become very large.
The pendulum
For other driven, damped harmonic oscillators whose equations of motion do not look exactly like the mass on a spring example, the resonant frequency remains
but the definitions of ω0 and ζ change based on the physics of the system. For a pendulum of length ℓ and small displacement angle θ, Equation (1) becomes
and therefore
RLC series circuits

Consider a circuit consisting of a resistor with resistance R, an inductor with inductance L, and a capacitor with capacitance C connected in series with current i(t) and driven by a voltage source with voltage vin(t). The voltage drop around the circuit is
-
(4)
Rather than analyzing a candidate solution to this equation like in the mass on a spring example above, this section will analyze the frequency response of this circuit. Taking the Laplace transform of Equation (4),
where I(s) and Vin(s) are the Laplace transform of the current and input voltage, respectively, and s is a complex frequency parameter in the Laplace domain. Rearranging terms,
Voltage across the capacitor
An RLC circuit in series presents several options for where to measure an output voltage. Suppose the output voltage of interest is the voltage drop across the capacitor. As shown above, in the Laplace domain this voltage is
or
Define for this circuit a natural frequency and a damping ratio,
The ratio of the output voltage to the input voltage becomes
H(s) is the transfer function between the input voltage and the output voltage. Note that this transfer function has two poles–roots of the polynomial in the transfer function's denominator–at
|
(5) |
and no zeros–roots of the polynomial in the transfer function's numerator. Moreover, note that for ζ ≤ 1, the magnitude of these poles is the natural frequency ω0 and that for ζ < 1/, our condition for resonance in the harmonic oscillator example, the poles are closer to the imaginary axis than to the real axis.
Evaluating H(s) along the imaginary axis s = iω, the transfer function describes the frequency response of this circuit. Equivalently, the frequency response can be analyzed by taking the Fourier transform of Equation (4) instead of the Laplace transform. The transfer function, which is also complex, can be written as a gain and phase,
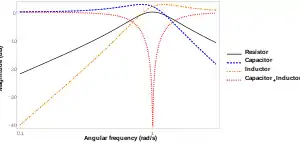
A sinusoidal input voltage at frequency ω results in an output voltage at the same frequency that has been scaled by G(ω) and has a phase shift Φ(ω). The gain and phase can be plotted versus frequency on a Bode plot. For the RLC circuit's capacitor voltage, the gain of the transfer function H(iω) is
|
(6) |
Note the similarity between the gain here and the amplitude in Equation (3). Once again, the gain is maximized at the resonant frequency
Here, the resonance corresponds physically to having a relatively large amplitude for the steady state oscillations of the voltage across the capacitor compared to its amplitude at other driving frequencies.
Voltage across the inductor
The resonant frequency need not always take the form given in the examples above. For the RLC circuit, suppose instead that the output voltage of interest is the voltage across the inductor. As shown above, in the Laplace domain the voltage across the inductor is
using the same definitions for ω0 and ζ as in the previous example. The transfer function between Vin(s) and this new Vout(s) across the inductor is
Note that this transfer function has the same poles as the transfer function in the previous example, but it also has two zeroes in the numerator at s = 0. Evaluating H(s) along the imaginary axis, its gain becomes
Compared to the gain in Equation (6) using the capacitor voltage as the output, this gain has a factor of ω2 in the numerator and will therefore have a different resonant frequency that maximizes the gain. That frequency is
So for the same RLC circuit but with the voltage across the inductor as the output, the resonant frequency is now larger than the natural frequency, though it still tends towards the natural frequency as the damping ratio goes to zero. That the same circuit can have different resonant frequencies for different choices of output is not contradictory. As shown in Equation (4), the voltage drop across the circuit is divided among the three circuit elements, and each element has different dynamics. The capacitor's voltage grows slowly by integrating the current over time and is therefore more sensitive to lower frequencies, whereas the inductor's voltage grows when the current changes rapidly and is therefore more sensitive to higher frequencies. While the circuit as a whole has a natural frequency where it tends to oscillate, the different dynamics of each circuit element make each element resonate at a slightly different frequency.
Voltage across the resistor
Suppose that the output voltage of interest is the voltage across the resistor. In the Laplace domain the voltage across the resistor is
and using the same natural frequency and damping ratio as in the capacitor example the transfer function is
Note that this transfer function also has the same poles as the previous RLC circuit examples, but it only has one zero in the numerator at s = 0. For this transfer function, its gain is
The resonant frequency that maximizes this gain is
and the gain is one at this frequency, so the voltage across the resistor resonates at the circuit's natural frequency and at this frequency the amplitude of the voltage across the resistor equals the input voltage's amplitude.
Antiresonance
Some systems exhibit antiresonance that can be analyzed in the same way as resonance. For antiresonance, the amplitude of the response of the system at certain frequencies is disproportionately small rather than being disproportionately large. In the RLC circuit example, this phenomenon can be observed by analyzing both the inductor and the capacitor combined.
Suppose that the output voltage of interest in the RLC circuit is the voltage across the inductor and the capacitor combined in series. Equation (4) showed that the sum of the voltages across the three circuit elements sums to the input voltage, so measuring the output voltage as the sum of the inductor and capacitor voltages combined is the same as vin minus the voltage drop across the resistor. The previous example showed that at the natural frequency of the system, the amplitude of the voltage drop across the resistor equals the amplitude of vin, and therefore the voltage across the inductor and capacitor combined has zero amplitude. We can show this with the transfer function.
The sum of the inductor and capacitor voltages is
Using the same natural frequency and damping ratios as the previous examples, the transfer function is
Note that this transfer has the same poles as the previous examples but has zeroes at
|
(7) |
Evaluating the transfer function along the imaginary axis, its gain is
Rather than look for resonance, i.e., peaks of the gain, notice that the gain goes to zero at ω = ω0, which complements our analysis of the resistor's voltage. This is called antiresonance, which has the opposite effect of resonance. Rather than result in outputs that are disproportionately large at this frequency, this circuit with this choice of output has no response at all at this frequency. The frequency that is filtered out corresponds exactly to the zeroes of the transfer function, which were shown in Equation (7) and were on the imaginary axis.
Relationships between resonance and frequency response in the RLC series circuit example
These RLC circuit examples illustrate how resonance is related to the frequency response of the system. Specifically, these examples illustrate:
- How resonant frequencies can be found by looking for peaks in the gain of the transfer function between the input and output of the system, for example in a Bode magnitude plot
- How the resonant frequency for a single system can be different for different choices of system output
- The connection between the system's natural frequency, the system's damping ratio, and the system's resonant frequency
- The connection between the system's natural frequency and the magnitude of the transfer function's poles, pointed out in Equation (5), and therefore a connection between the poles and the resonant frequency
- A connection between the transfer function's zeroes and the shape of the gain as a function of frequency, and therefore a connection between the zeroes and the resonant frequency that maximizes gain
- A connection between the transfer function's zeroes and antiresonance
The next section extends these concepts to resonance in a general linear system.
Generalizing resonance and antiresonance for linear systems
Next consider an arbitrary linear system with multiple inputs and outputs. For example, in state-space representation a third order linear time-invariant system with three inputs and two outputs might be written as
where ui(t) are the inputs, xi(t) are the state variables, yi(t) are the outputs, and A, B, C, and D are matrices describing the dynamics between the variables.
This system has a transfer function matrix whose elements are the transfer functions between the various inputs and outputs. For example,
Each Hij(s) is a scalar transfer function linking one of the inputs to one of the outputs. The RLC circuit examples above had one input voltage and showed four possible output voltages–across the capacitor, across the inductor, across the resistor, and across the capacitor and inductor combined in series–each with its own transfer function. If the RLC circuit were set up to measure all four of these output voltages, that system would have a 4×1 transfer function matrix linking the single input to each of the four outputs.
Evaluated along the imaginary axis, each Hij(iω) can be written as a gain and phase shift,
Peaks in the gain at certain frequencies correspond to resonances between that transfer function's input and output, assuming the system is stable.
Each transfer function Hij(s) can also be written as a fraction whose numerator and denominator are polynomials of s.
The complex roots of the numerator are called zeroes, and the complex roots of the denominator are called poles. For a stable system, the positions of these poles and zeroes on the complex plane give some indication of whether the system can resonate or antiresonate and at which frequencies. In particular, any stable or marginally stable, complex conjugate pair of poles with imaginary components can be written in terms of a natural frequency and a damping ratio as
as in Equation (5). The natural frequency ω0 of that pole is the magnitude of the position of the pole on the complex plane and the damping ratio of that pole determines how quickly that oscillation decays. In general,[4]
- Complex conjugate pairs of poles near the imaginary axis correspond to a peak or resonance in the frequency response in the vicinity of the pole's natural frequency. If the pair of poles is on the imaginary axis, the gain is infinite at that frequency.
- Complex conjugate pairs of zeroes near the imaginary axis correspond to a notch or antiresonance in the frequency response in the vicinity of the zero's frequency, i.e., the frequency equal to the magnitude of the zero. If the pair of zeroes is on the imaginary axis, the gain is zero at that frequency.
In the RLC circuit example, the first generalization relating poles to resonance is observed in Equation (5). The second generalization relating zeroes to antiresonance is observed in Equation (7). In the examples of the harmonic oscillator, the RLC circuit capacitor voltage, and the RLC circuit inductor voltage, "poles near the imaginary axis" corresponds to the significantly underdamped condition ζ < 1/.
Standing waves
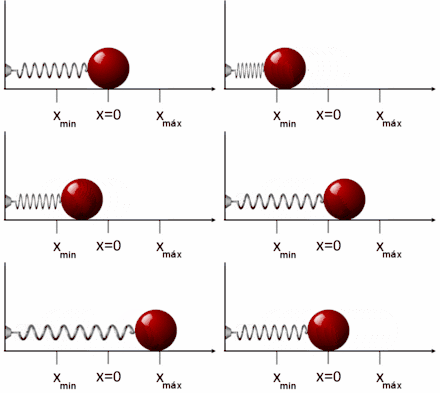
A physical system can have as many natural frequencies as it has degrees of freedom and can resonate near each of those natural frequencies. A mass on a spring, which has one degree of freedom, has one natural frequency. A double pendulum, which has two degrees of freedom, can have two natural frequencies. As the number of coupled harmonic oscillators increases, the time it takes to transfer energy from one to the next becomes significant. Systems with very large numbers of degrees of freedom can be thought of as continuous rather than as having discrete oscillators.
Energy transfers from one oscillator to the next in the form of waves. For example, the string of a guitar or the surface of water in a bowl can be modeled as a continuum of small coupled oscillators and waves can travel along them. In many cases these systems have the potential to resonate at certain frequencies, forming standing waves with large-amplitude oscillations at fixed positions. Resonance in the form of standing waves underlies many familiar phenomena, such as the sound produced by musical instruments, electromagnetic cavities used in lasers and microwave ovens, and energy levels of atoms.
Standing waves on a string

When a string of fixed length is driven at a particular frequency, a wave propagates along the string at the same frequency. The waves reflect off the ends of the string, and eventually a steady state is reached with waves traveling in both directions. The waveform is the superposition of the waves.[5]
At certain frequencies, the steady state waveform does not appear to travel along the string. At fixed positions called nodes, the string is never displaced. Between the nodes the string oscillates and exactly halfway between the nodes–at positions called anti-nodes–the oscillations have their largest amplitude.[6][7][8]

For a string of length with fixed ends, the displacement of the string perpendicular to the -axis at time is[5]
where
- is the amplitude of the left- and right-traveling waves interfering to form the standing wave,
- is the wave number,
- is the frequency.
The frequencies that resonate and form standing waves relate to the length of the string as[9][7]
where is the speed of the wave and the integer denotes different modes or harmonics. The standing wave with n = 1 oscillates at the fundamental frequency and has a wavelength that is twice the length of the string. The possible modes of oscillation form a harmonic series.[9]
Types
Mechanical and acoustic
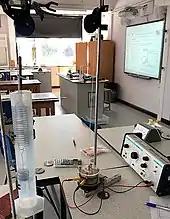
Mechanical resonance is the tendency of a mechanical system to absorb more energy when the frequency of its oscillations matches the system's natural frequency of vibration than it does at other frequencies. It may cause violent swaying motions and even catastrophic failure in improperly constructed structures including bridges, buildings, trains, and aircraft. When designing objects, engineers must ensure the mechanical resonance frequencies of the component parts do not match driving vibrational frequencies of motors or other oscillating parts, a phenomenon known as resonance disaster.
Avoiding resonance disasters is a major concern in every building, tower, and bridge construction project. As a countermeasure, shock mounts can be installed to absorb resonant frequencies and thus dissipate the absorbed energy. The Taipei 101 building relies on a 660-tonne pendulum (730-short-ton)—a tuned mass damper—to cancel resonance. Furthermore, the structure is designed to resonate at a frequency that does not typically occur. Buildings in seismic zones are often constructed to take into account the oscillating frequencies of expected ground motion. In addition, engineers designing objects having engines must ensure that the mechanical resonant frequencies of the component parts do not match driving vibrational frequencies of the motors or other strongly oscillating parts.
Clocks keep time by mechanical resonance in a balance wheel, pendulum, or quartz crystal.
The cadence of runners has been hypothesized to be energetically favorable due to resonance between the elastic energy stored in the lower limb and the mass of the runner.[10]
Acoustic resonance is a branch of mechanical resonance that is concerned with the mechanical vibrations across the frequency range of human hearing, in other words sound. For humans, hearing is normally limited to frequencies between about 20 Hz and 20,000 Hz (20 kHz),[11] Many objects and materials act as resonators with resonant frequencies within this range, and when struck vibrate mechanically, pushing on the surrounding air to create sound waves. This is the source of many percussive sounds we hear.
Acoustic resonance is an important consideration for instrument builders, as most acoustic instruments use resonators, such as the strings and body of a violin, the length of tube in a flute, and the shape of, and tension on, a drum membrane.
Like mechanical resonance, acoustic resonance can result in catastrophic failure of the object at resonance. The classic example of this is breaking a wine glass with sound at the precise resonant frequency of the glass, although this is difficult in practice.[12]
International Space Station
The rocket engines for the International Space Station (ISS) are controlled by an autopilot. Ordinarily, uploaded parameters for controlling the engine control system for the Zvezda module make the rocket engines boost the International Space Station to a higher orbit. The rocket engines are hinge-mounted, and ordinarily the crew doesn't notice the operation. On January 14, 2009, however, the uploaded parameters made the autopilot swing the rocket engines in larger and larger oscillations, at a frequency of 0.5 Hz. These oscillations were captured on video, and lasted for 142 seconds.[13]
Electrical
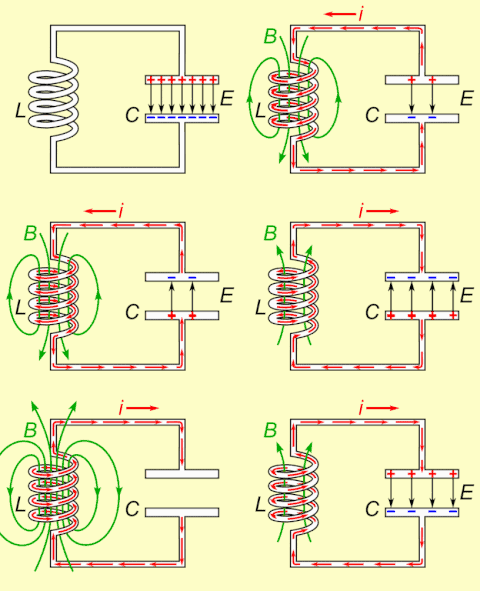
Electrical resonance occurs in an electric circuit at a particular resonant frequency when the impedance of the circuit is at a minimum in a series circuit or at maximum in a parallel circuit (usually when the transfer function peaks in absolute value). Resonance in circuits are used for both transmitting and receiving wireless communications such as television, cell phones and radio.
Optical
An optical cavity, also called an optical resonator, is an arrangement of mirrors that forms a standing wave cavity resonator for light waves. Optical cavities are a major component of lasers, surrounding the gain medium and providing feedback of the laser light. They are also used in optical parametric oscillators and some interferometers. Light confined in the cavity reflects multiple times producing standing waves for certain resonant frequencies. The standing wave patterns produced are called "modes". Longitudinal modes differ only in frequency while transverse modes differ for different frequencies and have different intensity patterns across the cross-section of the beam. Ring resonators and whispering galleries are examples of optical resonators that do not form standing waves.
Different resonator types are distinguished by the focal lengths of the two mirrors and the distance between them; flat mirrors are not often used because of the difficulty of aligning them precisely. The geometry (resonator type) must be chosen so the beam remains stable, i.e., the beam size does not continue to grow with each reflection. Resonator types are also designed to meet other criteria such as minimum beam waist or having no focal point (and therefore intense light at that point) inside the cavity.
Optical cavities are designed to have a very large Q factor.[14] A beam reflects a large number of times with little attenuation—therefore the frequency line width of the beam is small compared to the frequency of the laser.
Additional optical resonances are guided-mode resonances and surface plasmon resonance, which result in anomalous reflection and high evanescent fields at resonance. In this case, the resonant modes are guided modes of a waveguide or surface plasmon modes of a dielectric-metallic interface. These modes are usually excited by a subwavelength grating.
Orbital
In celestial mechanics, an orbital resonance occurs when two orbiting bodies exert a regular, periodic gravitational influence on each other, usually due to their orbital periods being related by a ratio of two small integers. Orbital resonances greatly enhance the mutual gravitational influence of the bodies. In most cases, this results in an unstable interaction, in which the bodies exchange momentum and shift orbits until the resonance no longer exists. Under some circumstances, a resonant system can be stable and self-correcting, so that the bodies remain in resonance. Examples are the 1:2:4 resonance of Jupiter's moons Ganymede, Europa, and Io, and the 2:3 resonance between Pluto and Neptune. Unstable resonances with Saturn's inner moons give rise to gaps in the rings of Saturn. The special case of 1:1 resonance (between bodies with similar orbital radii) causes large Solar System bodies to clear the neighborhood around their orbits by ejecting nearly everything else around them; this effect is used in the current definition of a planet.
Atomic, particle, and molecular
Nuclear magnetic resonance (NMR) is the name given to a physical resonance phenomenon involving the observation of specific quantum mechanical magnetic properties of an atomic nucleus in the presence of an applied, external magnetic field. Many scientific techniques exploit NMR phenomena to study molecular physics, crystals, and non-crystalline materials through NMR spectroscopy. NMR is also routinely used in advanced medical imaging techniques, such as in magnetic resonance imaging (MRI).
All nuclei containing odd numbers of nucleons have an intrinsic magnetic moment and angular momentum. A key feature of NMR is that the resonant frequency of a particular substance is directly proportional to the strength of the applied magnetic field. It is this feature that is exploited in imaging techniques; if a sample is placed in a non-uniform magnetic field then the resonant frequencies of the sample's nuclei depend on where in the field they are located. Therefore, the particle can be located quite precisely by its resonant frequency.
Electron paramagnetic resonance, otherwise known as electron spin resonance (ESR), is a spectroscopic technique similar to NMR, but uses unpaired electrons instead. Materials for which this can be applied are much more limited since the material needs to both have an unpaired spin and be paramagnetic.
The Mössbauer effect is the resonant and recoil-free emission and absorption of gamma ray photons by atoms bound in a solid form.
Resonance in particle physics appears in similar circumstances to classical physics at the level of quantum mechanics and quantum field theory. Resonances can also be thought of as unstable particles, with the formula in the Universal resonance curve section of this article applying if Γ is the particle's decay rate and Ω is the particle's mass M. In that case, the formula comes from the particle's propagator, with its mass replaced by the complex number M + iΓ. The formula is further related to the particle's decay rate by the optical theorem.
Disadvantages
A column of soldiers marching in regular step on a narrow and structurally flexible bridge can set it into dangerously large amplitude oscillations. April 12, 1831, the Broughton Suspension Bridge near Salford, England collapsed while a group of British soldiers were marching across.[15] Since then, the British Army has had a standing order for soldiers to break stride when marching across bridges, to avoid resonance from their regular marching pattern affecting the bridge.[16][17]
Vibrations of a motor or engine can induce resonant vibration in its supporting structures if their natural frequency is close to that of the vibrations of the engine. A common example is the rattling sound of a bus body when the engine is left idling.
Structural resonance of a suspension bridge induced by winds can lead to its catastrophic collapse. Several early suspension bridges in Europe and USA were destroyed by structural resonance induced by modest winds. The collapse of the Tacoma Narrows Bridge on 7 November 1940 is characterized in physics as a classic example of resonance.[18] It has been argued by Robert H. Scanlan and others that the destruction was instead caused by aeroelastic flutter, a complicated interaction between the bridge and the winds passing through it—an example of a self oscillation, or a kind of "self-sustaining vibration" as referred to in the nonlinear theory of vibrations.[19]
Q factor
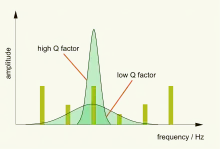
The Q factor or quality factor is a dimensionless parameter that describes how under-damped an oscillator or resonator is, and characterizes the bandwidth of a resonator relative to its center frequency.[20][21] A high value for Q indicates a lower rate of energy loss relative to the stored energy, i.e., the system is lightly damped. The parameter is defined by the equation:
.[22]
The higher the Q factor, the greater the amplitude at the resonant frequency, and the smaller the bandwidth, or range of frequencies around resonance occurs. In electrical resonance, a high-Q circuit in a radio receiver is more difficult to tune, but has greater selectivity, and so would be better at filtering out signals from other stations. High Q oscillators are more stable.[22]
Examples that normally have a low Q factor include door closers (Q=0.5). Systems with high Q factors include tuning forks (Q=1000), atomic clocks and lasers (Q≈1011).[23]
Universal resonance curve
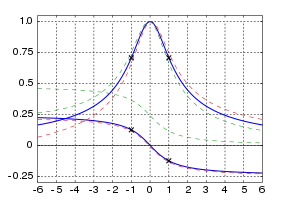
The exact response of a resonance, especially for frequencies far from the resonant frequency, depends on the details of the physical system, and is usually not exactly symmetric about the resonant frequency, as illustrated for the simple harmonic oscillator above. For a lightly damped linear oscillator with a resonance frequency Ω, the intensity of oscillations I when the system is driven with a driving frequency ω is typically approximated by a formula that is symmetric about the resonance frequency:[24]
Where the susceptibility links the amplitude of the oscillator to the driving force in frequency space:[25]
The intensity is defined as the square of the amplitude of the oscillations. This is a Lorentzian function, or Cauchy distribution, and this response is found in many physical situations involving resonant systems. Γ is a parameter dependent on the damping of the oscillator, and is known as the linewidth of the resonance. Heavily damped oscillators tend to have broad linewidths, and respond to a wider range of driving frequencies around the resonant frequency. The linewidth is inversely proportional to the Q factor, which is a measure of the sharpness of the resonance.
In radio engineering and electronics engineering, this approximate symmetric response is known as the universal resonance curve, a concept introduced by Frederick E. Terman in 1932 to simplify the approximate analysis of radio circuits with a range of center frequencies and Q values.[26][27]
See also
- Cymatics
- Driven harmonic motion
- Earthquake engineering
- Electric dipole spin resonance
- Formant
- Limbic resonance
- Nonlinear resonance
- Normal mode
- Positive feedback
- Schumann resonance
- Simple harmonic motion
- Stochastic resonance
- Sympathetic string
Notes
- Ogata 2005, p. 617.
- Ghatak 2005, p. 6.10.
- Halliday, Resnick & Walker 2005, p. 324.
- Hardt 2004.
- Halliday, Resnick & Walker 2005, p. 432.
- Halliday, Resnick & Walker 2005, pp. 431–432.
- Serway & Faughn 1992, p. 472.
- String Resonance. Digital Sound & Music. May 21, 2014. YouTube Video ID: oZ38Y0K8e-Y. Retrieved August 22, 2020.
- Halliday, Resnick & Walker 2005, p. 434.
- Snyder & Farley 2011.
- Olson 1967, pp. 248–249.
- UCLA Physics & Astronomy Department. "50. Breaking Glass with Sound". Lecture Demonstration Manual. University of California, Los Angeles. Retrieved 1 January 2021.
- Oberg, James (4 February 2009). "Shaking on Space Station Rattles NASA". NBC News. Retrieved 1 January 2021.
- "Q factor, quality factor, cavity, resonator, oscillator, frequency standards". Encyclopedia of Laser Physics and Technology. Retrieved 1 January 2021.
- Bishop, R.E.D. (1979). Vibration (Second ed.). Cambridge University Press, London.
- Smith, Alan (12 April 1975). "Broughton Bridge is falling down!". Manchester Evening News.
- Braun, Martin (1993). Differential Equations and Their Applications: An Introduction to Applied Mathematics (4 ed.). New York: Springer-Verlag. p. 175. ISBN 0-387-97894-1. Retrieved 30 May 2009.
- Siegel, Ethan (24 May 2017). "Science Busts The Biggest Myth Ever About Why Bridges Collapse". Forbes. Retrieved 3 January 2021.
- Billah & Scanlan 1991.
- Harlow 2004, p. 2.216.
- Tooley 2006, pp. 77–78.
- "Frequency response: Resonance, Bandwidth, Q factor" (PDF). Massachusetts Institute of Technology. Archived (PDF) from the original on 2022-10-09. Retrieved 3 January 2021.
- Physical Measurement Laboratory (12 May 2010). "Time and Frequency from A to Z, Q to Ra". Nist. National Institute of Standards and Technology (NIST). Retrieved 1 January 2021.
- Siegman 1986, pp. 105–108.
- Aspelmeyer, Kippenberg & Marquardt 2014.
- Terman 1932.
- Siebert 1986, p. 113.
References
- Aspelmeyer, M; Kippenberg, Tobias J.; Marquardt, Florian (30 December 2014). "Cavity optomechanics". Reviews of Modern Physics. 86 (4): 1391. arXiv:1303.0733. Bibcode:2014RvMP...86.1391A. doi:10.1103/RevModPhys.86.1391. hdl:11858/00-001M-0000-002D-6464-3. S2CID 119252645.
- Billah, K. Yusuf; Scanlan, Robert H (1991). "Resonance, Tacoma Narrows Bridge Failure, and Undergraduate Physics Textbooks" (PDF). American Journal of Physics. 59 (2): 118–124. Bibcode:1991AmJPh..59..118B. doi:10.1119/1.16590. Retrieved 1 January 2021.
- Ghatak, Ajoy (2005). Optics (3rd ed.). New Delhi: Tata McGraw-Hill. ISBN 978-0-07-058583-6.
- Halliday, David; Resnick, Robert; Walker, Jearl (2005). Fundamentals of Physics. Vol. part 2 (7th ed.). John Wiley & Sons Ltd. ISBN 978-0-471-71716-4.
- Hardt, David (2004). "Understanding Poles and Zeros" (PDF). 2.14 Analysis and Design of Feedback Control Systems. Massachusetts Institute of Technology. Archived (PDF) from the original on 2022-10-09. Retrieved 18 April 2020.
- Harlow, James H., ed. (2004). Electric Power Transformer Engineering. London: CRC Press. ISBN 978-0-8493-1704-0.
- Ogata, Katsuhiko (2005). System Dynamics (4th ed.). Harlow: Pearson. ISBN 978-1-292-02608-4.
- Olson, Harry F. (1967). Music, Physics and Engineering. Vol. 2. New York: Dover Publications. ISBN 978-0-486-21769-7.
- Serway, Raymond A.; Faughn, Jerry S. (1992). College Physics (3rd ed.). Saunders College Publishing. ISBN 0-03-076377-0.
- Siebert, William McC. (1986). Circuits, Signals, and Systems. London; New York: MIT Press' McGraw Hill Book Company. ISBN 978-0-262-19229-3.
- Siegman, A. E. (1986). Lasers. University Science Books. ISBN 978-0-935702-11-8.
- Snyder, Kristine L.; Farley, Claire T. (2011). "Energetically optimal stride frequency in running: the effects of incline and decline". The Journal of Experimental Biology. 214 (12): 2089–2095. doi:10.1242/jeb.053157. PMID 21613526.
- Terman, Frederick Emmons (1932). Radio Engineering (1st ed.). New York: McGraw-Hill Book Company. OCLC 1036819790.
- Tooley, Michael H. (2006). Electronic Circuits: Fundamentals and Applications. Oxford: Taylor & Francis. ISBN 978-0-7506-6923-8.
External links
- The Feynman Lectures on Physics Vol. I Ch. 23: Resonance
- Resonance - a chapter from an online textbook
- Greene, Brian, "Resonance in strings". The Elegant Universe, NOVA (PBS)
- Hyperphysics section on resonance concepts
- Resonance versus resonant (usage of terms)
- Wood and Air Resonance in a Harpsichord
- Java applet demonstrating resonances on a string when the frequency of the driving force is varied
- Java applet demonstrating the occurrence of resonance when the driving frequency matches with the natural frequency of an oscillator
- Breaking glass with sound, including high-speed footage of glass breaking
