Demographics of Argentina
This is a demography of Argentina including population density, ethnicity, economic status and other aspects of the population.
| Demographics of Argentina | |
|---|---|
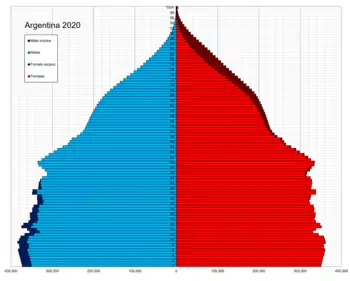 Argentina population pyramid in 2020 | |
| Population | 45,276,780[1][2] |
| Growth rate | 0.35% (2020 est.)[3] |
| Birth rate | 11.8 births/1,000 population (2020)[4] |
| Death rate | 8.3 deaths/1,000 population (2020)[4] |
| Life expectancy | 78.07 years |
| • male | 74.97 years |
| • female | 81.36 years (2021 est.)[3] |
| Fertility rate | 2.2 children born/woman (2020)[4] |
| Infant mortality rate | 8.4 deaths/1,000 live births (2020)[4] |
| Net migration rate | -0.08 migrant(s)/1,000 population (2021 est.)[3] |
| Age structure | |
| 0–14 years | 24.02% (male 5,629,188/ female 5,294,723) |
| 15–64 years | 63.85% (male 14,545,315/ female 14,492,951) |
| 65 and over | 12.13% (male 2,331,679/ female 3,185,262) (2020 est.)[3] |
| Sex ratio | |
| Total | 0.97 male(s)/female (2011 est.) |
| At birth | 1.05 male(s)/female |
| Under 15 | 1.05 male(s)/female |
| 15–64 years | 1 male(s)/female |
| 65 and over | 0.7 male(s)/female |
| Nationality | |
| Nationality | Argentine |
| Language | |
| Official | Spanish language |
| Spoken | English, Italian, Welsh, Yiddish, Portuguese, Guarani, Quechua, Mapudungun and many others are also spoken varying by region |
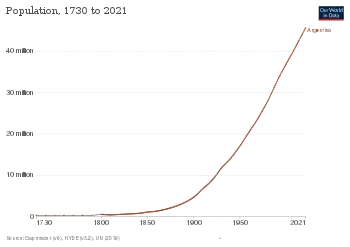
In the 2010 census [INDEC], Argentina had a population of 40,117,096 inhabitants, and preliminary results from the 2022 census [INDEC] counted 47,327,407.[5][6]
Argentina ranks third in South America in total population and 33rd globally. The population density is 15 persons per square kilometer, well below the world average of 50 persons. The population growth rate in 2020 was estimated to be 0.35% annually, with a birth rate of 11.8 live births per 1,000 inhabitants and a mortality rate of 8.3 deaths per 1,000 inhabitants.
The proportion of people under 15, at 24%, is slightly below the world average (25%), and the cohort of people 65 and older is relatively high, at 12%. The percentage of senior citizens in Argentina has long been second only to Uruguay in Latin America and well above the world average, which is currently 9.8%.
The median age is approximately 30 years and life expectancy at birth is of 76 years. According to an official cultural consumption survey conducted in 2006, 42.3% of Argentines speak English (though only 15.4% of those claimed to have a high level of English comprehension), 8.3% speak Portuguese[7] and 6.9% speak Italian.[8]
| Year | Pop. | ±% |
|---|---|---|
| 1650 | 298,000 | — |
| 1778 | 420,900 | +41.2% |
| 1800 | 551,500 | +31.0% |
| 1809 | 609,200 | +10.5% |
| 1825 | 766,400 | +25.8% |
| 1839 | 926,300 | +20.9% |
| 1857 | 1,299,600 | +40.3% |
| 1869 | 1,830,214 | +40.8% |
| 1895 | 4,044,911 | +121.0% |
| 1914 | 7,903,662 | +95.4% |
| 1947 | 15,893,811 | +101.1% |
| 1960 | 20,013,793 | +25.9% |
| 1970 | 23,364,431 | +16.7% |
| 1980 | 27,949,480 | +19.6% |
| 1991 | 32,615,528 | +16.7% |
| 2001 | 36,260,130 | +11.2% |
| 2010 | 40,117,096 | +10.6% |
| 2022 | 47,327,407 | +18.0% |
| Source:[9][10] | ||
Cities
Argentina is highly urbanized,[3] with the ten largest metropolitan areas accounting for half of the population, and fewer than one in ten living in rural areas. About 3 million people live in Buenos Aires proper, and the Greater Buenos Aires metropolitan area totals around 13 million, making it one of the largest urban areas in the world.[11] The metropolitan areas of Córdoba and Rosario have around 1.3 million inhabitants each,[11] and six other cities (Mendoza, Tucumán, La Plata, Mar del Plata, Salta and Santa Fe)[11][12] have at least half a million people each.
The population is unequally distributed amongst the provinces, with about 60% living in the Pampa region (21% of the total area), including 15 million people in Buenos Aires Province, and 3 million each in Córdoba Province, Santa Fe Province and the Autonomous City of Buenos Aires. Seven other provinces each have about one million people: Mendoza, Tucumán, Entre Ríos, Salta, Chaco, Corrientes and Misiones. Tucumán is the most densely populated (with 60 inhabitants/km2, the only Argentine province more densely populated than the world average), while the southern province of Santa Cruz has less than 1 inhabitant/km2.
In the mid-19th century, a large wave of immigration started to arrive to Argentina due to new constitutional policies that encouraged immigration, and issues in the countries the immigrants came from such as wars, poverty, hunger, famines, pursuit of a better life, among other reasons. The main immigration sources were from Europe, the countries from the Near and Middle East, Russia and Japan. In fact, the immigration torrent was so strong that Argentina eventually received the second-largest number of immigrants in the world, second only to the US and ahead of such immigration receptor countries such as Canada, Brazil, Australia, etc.[13][14]
Most of these European immigrants settled in the cities which offered jobs, education and other opportunities enabling them to enter the middle class. Many also settled in the growing small towns along the expanding railway system and since the 1930s many rural workers have moved to the big cities.[15] Urban areas reflect the influence of European immigration, and most of the larger ones feature boulevards and diagonal avenues inspired by the redevelopment of Paris. Argentine cities were originally built in a colonial Spanish grid style, centered on a plaza overlooked by a cathedral and important government buildings. Many still retain this general layout, known as a damero, meaning checkerboard, since it is based on a pattern of square blocks. The city of La Plata, designed at the end of the 19th century by Pedro Benoit, combines the checkerboard layout with added diagonal avenues at fixed intervals, and was the first in South America with electric street lighting.[16]
Provinces and districts
| Flag | Province/District | Capital | Population (2010)[17] | Rank | Density (/km2)[17] | Rank | Births (2020)[4] | Rate | Deaths (2020)[4] | Rate | Infant mortality (2020)[4] |
|---|---|---|---|---|---|---|---|---|---|---|---|
| Buenos Aires City | – | 2,891,082 | 4 | 14,241.8 | 1 | 28,103 | 9.1 | 35,569 | 11.6 | 4.9 | |
| Buenos Aires Province | La Plata | 15,594,428 | 1 | 50.7 | 3 | 191,474 | 10.9 | 150,105 | 8.6 | 8.2 | |
| Catamarca Province | San Fernando del Valle de Catamarca | 367,820 | 20 | 3.6 | 20 | 4,950 | 11.9 | 2,466 | 5.9 | 9.7 | |
| Chaco Province | Resistencia | 1,053,466 | 10 | 10.6 | 11 | 18,488 | 15.3 | 8,740 | 7.3 | 10.0 | |
| Chubut Province | Rawson | 506,668 | 18 | 2.3 | 22 | 6,991 | 11.3 | 3,873 | 6.3 | 6.0 | |
| Córdoba Province | Córdoba | 3,304,825 | 2 | 20.0 | 6 | 44,348 | 11.8 | 33,082 | 8.8 | 7.1 | |
| Corrientes Province | Corrientes | 993,338 | 11 | 11.3 | 10 | 16,547 | 14.8 | 7,324 | 6.5 | 10.9 | |
| Entre Ríos Province | Paraná | 1,236,300 | 7 | 15.7 | 7 | 17,012 | 12.3 | 10,842 | 7.8 | 8.1 | |
| Formosa Province | Formosa | 527,895 | 17 | 7.3 | 14 | 9,218 | 15.2 | 3,690 | 6.1 | 16.4 | |
| Jujuy Province | San Salvador de Jujuy | 672,260 | 14 | 12.6 | 8 | 9,145 | 11.9 | 6,522 | 8.5 | 9.0 | |
| La Pampa Province | Santa Rosa | 316,940 | 22 | 2.2 | 23 | 3,743 | 10.4 | 2,423 | 6.8 | 8.0 | |
| La Rioja Province | La Rioja | 331,847 | 21 | 3.7 | 19 | 4,562 | 11.6 | 2,839 | 7.2 | 8.3 | |
| Mendoza Province | Mendoza | 1,741,610 | 5 | 11.7 | 9 | 23,455 | 11.8 | 16,514 | 8.3 | 7.6 | |
| Misiones Province | Posadas | 1,097,829 | 9 | 36.8 | 4 | 21,137 | 16.8 | 7,072 | 5.6 | 9.1 | |
| Neuquén Province | Neuquén | 550,334 | 16 | 5.8 | 17 | 8,141 | 12.3 | 4,353 | 6.6 | 5.2 | |
| Río Negro Province | Viedma | 633,374 | 15 | 3.1 | 21 | 8,689 | 11.6 | 5,791 | 7.7 | 7.6 | |
| Salta Province | Salta | 1,215,207 | 8 | 7.8 | 12 | 18,026 | 12.7 | 9,736 | 6.8 | 12.4 | |
| San Juan Province | San Juan | 680,427 | 13 | 7.6 | 13 | 10,942 | 14.0 | 5,598 | 7.2 | 8.7 | |
| San Luis Province | San Luis | 431,588 | 19 | 5.6 | 18 | 5,993 | 11.8 | 3,564 | 7.0 | 8.0 | |
| Santa Cruz Province | Río Gallegos | 272,524 | 23 | 1.1 | 24 | 4,126 | 11.3 | 1,940 | 5.3 | 8.7 | |
| Santa Fe Province | Santa Fe de la Vera Cruz | 3,200,736 | 3 | 24.1 | 5 | 39,662 | 11.2 | 32,730 | 9.3 | 8.4 | |
| Santiago del Estero Province | Santiago del Estero | 896,461 | 12 | 6.6 | 15 | 13,675 | 14.0 | 6,240 | 6.4 | 8.0 | |
| Tierra del Fuego Province a | Ushuaia | 126,190 | 24 | 5.8 | 16 | 1,886 | 10.9 | 850 | 4.9 | 7.4 | |
| Tucumán Province | San Miguel de Tucumán | 1,448,200 | 6 | 64.3 | 2 | 21,640 | 12.8 | 12,967 | 7.7 | 10.4 |
a Not including claims to the Islas Malvinas (Falkland Islands) and the Argentine Antarctica.
Historical census data
Sources: Pantelides and National Institute of Statistics and Census of Argentina[10]
| Years | 1869 | 1895 | 1914 | 1947 | 1960 | 1970 | 1980 | 1991 | 2001 | 2010 | |
|---|---|---|---|---|---|---|---|---|---|---|---|
| Total Fertility Rates (children/woman) | 6.8 | 7.0 | 5.2 | 3.2 | 3.1 | 3.1 | 3.4 | 2.9 | 2.6 | 2.4 | |
| Crude Birth Rates | 49.1 | 44.5 | 36.5 | 24.7 | 22.9 | 22.7 | 24.8 | 21.1 | 18.4 | 18.5 | |
| Age 0-14 | 45.3 | 40.3 | 38.4 | 30.8 | 30.8 | 29.3 | 30.4 | 30.6 | 28.3 | 25.5 | |
| Age 15-29 | 29.7 | 27.7 | 30.8 | 27.5 | 23.8 | 24.6 | 23.9 | 23.3 | 25.0 | 24.8 | |
| Age 30-44 | 16.0 | 19.5 | 17.9 | 21.5 | 21.2 | 19.9 | 18.8 | 19.3 | 18.6 | 20.2 | |
| Age 45-59 | 7.0 | 8.9 | 8.9 | 13.6 | 15.3 | 15.4 | 15.1 | 13.9 | 14.7 | 15.2 | |
| Age 60-74 | 1.8 | 2.9 | 3.3 | 5.5 | 7.3 | 8.6 | 9.0 | 9.6 | 9.3 | 9.8 | |
| Age 75+ | 0.2 | 0.7 | 0.7 | 1.1 | 1.6 | 2.2 | 2.8 | 3.3 | 4.1 | 4.5 |
Vital statistics
The table below gives an overview of the number of birth and deaths in Argentina during the past century. Several sources were combined to compile the table.[18][19][20]
The number of births in 2020 (533,299) was 31% below the record set in 2014, while the number of deaths (376,219) was the highest ever recorded[4] - though as the population of Argentina showed a five-fold increase during the past century, the birth rate in 2020 (11.8) was a record low while the death rate (8.3) remained low by historic standards.
Birth rates were relatively stable from 1934 through 1980,[18] and after declining stabilized from 1995 to 2015 before again declining sharply since then.[20]
| Average population | Live births | Deaths | Natural change | Crude birth rate (per 1000) |
Crude death rate (per 1000) |
Natural change (per 1000) |
Total fertility rate[21] | Infant mortality rate | |
|---|---|---|---|---|---|---|---|---|---|
| 1910 | 6,800,000 | 260,000 | 129,000 | 131,000 | 38.3 | 18.9 | 19.4 | 5.26 | |
| 1911 | 7,070,000 | 268,000 | 129,000 | 139,000 | 37.9 | 18.2 | 19.7 | 5.24 | 148.0 |
| 1912 | 7,470,000 | 288,000 | 127,000 | 161,000 | 38.6 | 17.0 | 21.6 | 5.43 | 143.0 |
| 1913 | 7,840,000 | 298,000 | 127,000 | 171,000 | 38.0 | 16.2 | 21.8 | 5.42 | 130.0 |
| 1914 | 8,000,000 | 294,000 | 123,000 | 171,000 | 36.7 | 15.4 | 21.3 | 5.16 | 125.0 |
| 1915 | 8,150,000 | 288,000 | 129,000 | 159,000 | 35.3 | 15.8 | 19.5 | 4.94 | 124.0 |
| 1916 | 8,300,000 | 293,000 | 142,000 | 151,000 | 35.3 | 17.1 | 18.2 | 4.90 | 124.0 |
| 1917 | 8,450,000 | 284,000 | 136,000 | 148,000 | 33.6 | 16.1 | 17.5 | 4.64 | 128.0 |
| 1918 | 8,600,000 | 283,000 | 157,000 | 126,000 | 32.9 | 18.2 | 14.7 | 4.51 | 138.0 |
| 1919 | 8,750,000 | 286,000 | 161,000 | 125,000 | 32.7 | 18.4 | 14.3 | 4.45 | 134.0 |
| 1920 | 8,970,000 | 290,000 | 139,000 | 151,000 | 32.3 | 15.5 | 16.8 | 4.40 | 127.0 |
| 1921 | 9,220,000 | 302,000 | 146,000 | 156,000 | 32.8 | 15.8 | 17.0 | 4.47 | 116.0 |
| 1922 | 9,520,000 | 315,000 | 133,000 | 182,000 | 33.1 | 14.0 | 19.1 | 4.55 | 112.0 |
| 1923 | 9,890,000 | 336,000 | 146,000 | 190,000 | 34.0 | 14.8 | 19.2 | 4.74 | 112.0 |
| 1924 | 10,220,000 | 335,000 | 146,000 | 189,000 | 32.8 | 14.3 | 18.5 | 4.61 | 116.0 |
| 1925 | 10,500,000 | 334,000 | 148,000 | 186,000 | 31.8 | 14.1 | 17.7 | 4.49 | 121.0 |
| 1926 | 10,800,000 | 337,000 | 147,000 | 190,000 | 31.2 | 13.6 | 17.6 | 4.42 | 119.0 |
| 1927 | 11,130,000 | 342,000 | 157,000 | 185,000 | 30.7 | 14.1 | 16.6 | 4.38 | 126.0 |
| 1928 | 11,440,000 | 352,000 | 151,000 | 201,000 | 30.8 | 13.2 | 17.6 | 4.40 | 113.0 |
| 1929 | 11,750,000 | 355,000 | 162,000 | 193,000 | 30.2 | 13.8 | 16.4 | 4.33 | 107.0 |
| 1930 | 12,050,000 | 355,000 | 153,000 | 202,000 | 29.5 | 12.7 | 16.8 | 4.22 | 100.0 |
| 1931 | 12,290,000 | 350,000 | 156,000 | 194,000 | 28.5 | 12.7 | 15.8 | 4.07 | 100.0 |
| 1932 | 12,520,000 | 352,000 | 139,000 | 213,000 | 28.1 | 11.1 | 17.0 | 3.99 | 95.0 |
| 1933 | 12,730,000 | 332,000 | 150,000 | 182,000 | 26.1 | 11.8 | 14.3 | 3.67 | 87.0 |
| 1934 | 12,940,000 | 319,661 | 143,065 | 176,596 | 24.7 | 11.1 | 13.6 | 3.45 | 96.6 |
| 1935 | 13,150,000 | 322,002 | 162,768 | 159,234 | 24.5 | 12.4 | 12.1 | 3.39 | 105.6 |
| 1936 | 13,370,000 | 318,651 | 150,092 | 168,559 | 23.8 | 11.2 | 12.6 | 3.28 | 96.2 |
| 1937 | 13,610,000 | 319,024 | 154,275 | 164,749 | 23.4 | 11.3 | 12.1 | 3.20 | 95.4 |
| 1938 | 14,202,000 | 325,412 | 161,555 | 163,857 | 22.9 | 11.4 | 11.5 | 3.19 | 105.3 |
| 1939 | 14,397,000 | 329,393 | 149,153 | 180,240 | 22.9 | 10.4 | 12.5 | 3.14 | 91.7 |
| 1940 | 14,591,000 | 339,029 | 151,856 | 187,173 | 23.2 | 10.4 | 12.8 | 3.18 | 90.2 |
| 1941 | 14,796,000 | 340,339 | 148,947 | 191,392 | 23.0 | 10.1 | 12.9 | 3.11 | 84.8 |
| 1942 | 15,004,000 | 338,199 | 150,030 | 188,169 | 22.5 | 10.0 | 12.5 | 3.03 | 86.1 |
| 1943 | 15,216,000 | 358,977 | 150,166 | 208,811 | 23.6 | 9.9 | 13.7 | 3.12 | 79.8 |
| 1944 | 15,441,000 | 380,950 | 154,093 | 226,857 | 24.7 | 10.0 | 14.7 | 3.23 | 80.7 |
| 1945 | 15,674,000 | 388,191 | 157,785 | 230,406 | 24.8 | 10.1 | 14.7 | 3.21 | 82.1 |
| 1946 | 15,912,000 | 387,496 | 149,895 | 237,601 | 24.4 | 9.4 | 14.9 | 3.12 | 79.0 |
| 1947 | 16,109,000 | 398,468 | 158,059 | 240,409 | 24.7 | 9.7 | 15.0 | 3.14 | 77.1 |
| 1948 | 16,284,000 | 413,132 | 152,648 | 260,484 | 25.4 | 9.4 | 16.0 | 3.19 | 69.5 |
| 1949 | 16,671,000 | 419,656 | 150,604 | 269,052 | 25.2 | 9.0 | 16.1 | 3.18 | 67.0 |
| 1950 | 17,150,000 | 438,766 | 154,540 | 284,226 | 25.6 | 9.0 | 16.6 | 3.26 | 68.2 |
| 1951 | 17,506,000 | 444,326 | 156,406 | 287,920 | 25.4 | 9.0 | 16.5 | 3.26 | 67.4 |
| 1952 | 17,865,000 | 446,156 | 153,887 | 292,269 | 25.0 | 8.6 | 16.4 | 3.22 | 64.3 |
| 1953 | 18,224,000 | 459,734 | 162,217 | 297,517 | 25.3 | 8.9 | 16.4 | 3.27 | 63.8 |
| 1954 | 18,580,000 | 457,559 | 156,347 | 301,212 | 24.6 | 8.4 | 16.2 | 3.21 | 60.4 |
| 1955 | 18,931,000 | 461,293 | 167,357 | 293,936 | 24.4 | 8.8 | 15.5 | 3.20 | 61.8 |
| 1956 | 19,277,000 | 474,142 | 161,321 | 312,821 | 24.6 | 8.4 | 16.2 | 3.24 | 57.0 |
| 1957 | 19,618,000 | 478,368 | 179,578 | 298,790 | 24.4 | 9.2 | 15.2 | 3.24 | 68.5 |
| 1958 | 19,955,000 | 472,865 | 166,235 | 306,630 | 23.7 | 8.3 | 15.4 | 3.16 | 61.4 |
| 1959 | 20,291,000 | 476,211 | 173,409 | 302,802 | 23.5 | 8.5 | 14.9 | 3.15 | 59.1 |
| 1960 | 20,625,000 | 473,038 | 179,266 | 293,772 | 22.9 | 8.7 | 14.2 | 3.08 | 62.4 |
| 1961 | 20,961,000 | 476,259 | 176,477 | 299,782 | 22.7 | 8.4 | 14.3 | 3.06 | 59.1 |
| 1962 | 21,297,000 | 490,414 | 184,013 | 306,401 | 23.0 | 8.6 | 14.4 | 3.11 | 58.7 |
| 1963 | 21,633,000 | 491,109 | 187,492 | 303,617 | 22.7 | 8.7 | 14.0 | 3.07 | 61.8 |
| 1964 | 21,966,000 | 496,256 | 193,141 | 303,115 | 22.6 | 8.8 | 13.8 | 3.05 | 58.3 |
| 1965 | 22,297,000 | 481,814 | 196,467 | 285,347 | 21.6 | 8.8 | 12.8 | 2.92 | 56.9 |
| 1966 | 22,622,000 | 479,396 | 194,450 | 284,946 | 21.2 | 8.6 | 12.6 | 2.87 | 53.4 |
| 1967 | 22,945,000 | 480,317 | 195,265 | 285,052 | 20.9 | 8.5 | 12.4 | 2.84 | 55.0 |
| 1968 | 23,273,000 | 493,354 | 213,313 | 280,041 | 21.2 | 9.2 | 12.0 | 2.87 | 59.9 |
| 1969 | 23,617,000 | 580,699 | 222,937 | 357,762 | 24.6 | 9.4 | 15.2 | 3.34 | 52.5 |
| 1970 | 23,983,000 | 544,521 | 222,113 | 322,408 | 22.7 | 9.3 | 13.5 | 3.09 | 59.1 |
| 1971 | 24,376,000 | 564,787 | 225,000 | 339,787 | 23.2 | 9.2 | 14.0 | 3.16 | 50.0 |
| 1972 | 24,792,000 | 559,398 | 220,000 | 339,398 | 22.6 | 9.0 | 13.6 | 3.09 | 49.0 |
| 1973 | 25,222,000 | 561,500 | 226,000 | 335,500 | 22.3 | 9.1 | 13.2 | 3.06 | 47.0 |
| 1974 | 25,654,000 | 602,000 | 231,000 | 371,000 | 23.5 | 9.0 | 14.5 | 3.24 | 46.0 |
| 1975 | 26,079,000 | 620,000 | 229,000 | 391,000 | 23.8 | 8.8 | 15.0 | 3.29 | 44.0 |
| 1976 | 26,493,000 | 656,768 | 240,764 | 416,004 | 24.8 | 9.1 | 15.7 | 3.44 | 44.4 |
| 1977 | 26,899,000 | 661,222 | 234,430 | 426,792 | 24.6 | 8.7 | 15.9 | 3.43 | 44.5 |
| 1978 | 27,303,000 | 665,000 | 233,482 | 431,518 | 24.4 | 8.6 | 15.8 | 3.41 | 40.8 |
| 1979 | 27,712,000 | 647,864 | 234,926 | 412,938 | 23.4 | 8.5 | 14.9 | 3.29 | 38.5 |
| 1980 | 28,131,000 | 697,775 | 241,125 | 456,650 | 24.8 | 8.6 | 16.3 | 3.49 | 33.2 |
| 1981 | 28,562,000 | 680,292 | 241,904 | 438,388 | 23.8 | 8.5 | 15.4 | 3.37 | 33.6 |
| 1982 | 29,001,000 | 663,429 | 234,926 | 428,503 | 22.9 | 8.1 | 14.8 | 3.24 | 30.5 |
| 1983 | 29,448,000 | 655,876 | 233,071 | 422,805 | 22.3 | 7.9 | 14.4 | 3.15 | 29.7 |
| 1984 | 29,900,000 | 635,323 | 255,591 | 379,732 | 21.3 | 8.6 | 12.7 | 3.00 | 30.4 |
| 1985 | 30,354,000 | 650,783 | 241,377 | 409,406 | 21.5 | 8.0 | 13.5 | 3.02 | 26.2 |
| 1986 | 30,811,000 | 675,388 | 241,004 | 434,384 | 22.0 | 7.8 | 14.1 | 3.08 | 26.9 |
| 1987 | 31,270,000 | 668,136 | 249,882 | 418,254 | 21.4 | 8.0 | 13.4 | 2.99 | 26.6 |
| 1988 | 31,729,000 | 680,605 | 254,953 | 425,652 | 21.5 | 8.1 | 13.5 | 3.00 | 25.8 |
| 1989 | 32,187,000 | 667,058 | 252,302 | 414,756 | 20.8 | 7.9 | 12.9 | 2.89 | 25.7 |
| 1990 | 32,642,000 | 678,644 | 259,683 | 418,961 | 20.9 | 8.0 | 12.9 | 2.89 | 25.6 |
| 1991 | 33,094,000 | 694,776 | 255,609 | 439,167 | 21.0 | 7.7 | 13.3 | 2.91 | 24.7 |
| 1992 | 33,540,000 | 678,761 | 262,287 | 416,474 | 20.2 | 7.8 | 12.4 | 2.79 | 23.9 |
| 1993 | 33,982,000 | 667,518 | 267,286 | 400,232 | 19.6 | 7.9 | 11.8 | 2.70 | 22.9 |
| 1994 | 34,420,000 | 673,787 | 257,431 | 416,356 | 19.6 | 7.5 | 12.1 | 2.68 | 22.0 |
| 1995 | 34,855,000 | 658,735 | 268,997 | 389,738 | 18.9 | 7.7 | 11.2 | 2.58 | 22.2 |
| 1996 | 35,287,000 | 675,437 | 268,715 | 406,722 | 19.1 | 7.6 | 11.5 | 2.60 | 20.9 |
| 1997 | 35,715,000 | 692,357 | 270,910 | 421,447 | 19.4 | 7.6 | 11.8 | 2.63 | 18.8 |
| 1998 | 36,135,000 | 683,301 | 280,180 | 403,121 | 18.9 | 7.8 | 11.2 | 2.56 | 19.1 |
| 1999 | 36,541,000 | 686,748 | 289,543 | 397,205 | 18.8 | 7.9 | 10.9 | 2.54 | 17.6 |
| 2000 | 36,931,000 | 701,878 | 277,148 | 424,730 | 19.0 | 7.5 | 11.5 | 2.57 | 16.6 |
| 2001 | 37,302,000 | 683,495 | 285,941 | 397,554 | 18.3 | 7.7 | 10.7 | 2.50 | 16.3 |
| 2002 | 37,657,000 | 694,684 | 291,190 | 403,494 | 18.4 | 7.7 | 10.7 | 2.48 | 16.8 |
| 2003 | 38,001,000 | 697,952 | 302,064 | 395,888 | 18.4 | 7.9 | 10.4 | 2.46 | 16.5 |
| 2004 | 38,341,000 | 736,261 | 294,051 | 442,210 | 19.2 | 7.7 | 11.5 | 2.57 | 14.4 |
| 2005 | 38,681,000 | 721,220 | 293,529 | 427,691 | 18.6 | 7.6 | 11.1 | 2.45 | 13.3 |
| 2006 | 39,024,000 | 696,451 | 292,313 | 404,138 | 17.8 | 7.5 | 10.4 | 2.37 | 12.9 |
| 2007 | 39,368,000 | 700,792 | 315,852 | 384,940 | 17.8 | 8.0 | 9.8 | 2.36 | 13.3 |
| 2008 | 39,714,000 | 746,460 | 301,801 | 444,659 | 18.8 | 7.6 | 11.2 | 2.49 | 12.5 |
| 2009 | 40,062,000 | 745,336 | 304,525 | 440,811 | 18.6 | 7.6 | 11.0 | 2.46 | 12.1 |
| 2010 | 40,788,000 | 756,176 | 318,602 | 437,574 | 18.5 | 7.9 | 10.6 | 2.47 | 11.9 |
| 2011 | 41,261,000 | 758,042 | 319,059 | 438,983 | 18.5 | 7.8 | 10.7 | 2.45 | 11.7 |
| 2012 | 41,733,000 | 738,318 | 319,539 | 418,779 | 17.9 | 7.7 | 10.2 | 2.36 | 11.1 |
| 2013 | 42,203,000 | 754,603 | 326,197 | 428,406 | 18.1 | 7.8 | 10.3 | 2.39 | 10.8 |
| 2014 | 42,669,000 | 777,012 | 325,539 | 451,437 | 18.2 | 7.6 | 10.6 | 2.44 | 10.6 |
| 2015 | 43,132,000 | 770,040 | 333,407 | 436,633 | 17.9 | 7.7 | 10.2 | 2.39 | 9.7 |
| 2016 | 43,590,000 | 728,035 | 352,992 | 375,043 | 16.7 | 8.2 | 8.5 | 2.24 | 9.7 |
| 2017 | 44,044,811 | 704,609 | 341,668 | 362,941 | 15.9 | 7.8 | 8.1 | 2.15 | 9.3 |
| 2018 | 44,494,502 | 685,394 | 336,823 | 348,571 | 15.4 | 7.6 | 7.8 | 2.08 | 8.8 |
| 2019 | 44,938,712 | 625,441 | 341,728 | 283,713 | 13.9 | 7.6 | 6.3 | 1.81 | 9.2 |
| 2020 | 45,376,763 | 533,299 | 376,219 | 157,080 | 11.8 | 8.3 | 3.5 | 1.54 | 8.4 |
| 2021 | 45,808,747 |
Structure of the population
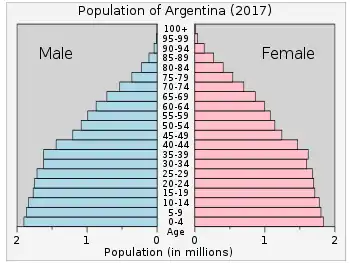
According to the 2022 revision of the World Population Prospects[1][2] the total population was 45,276,780 in 2021, compared to only 17,150,000 in 1950. The proportion of children below the age of 15 in 2020 was 24%, 64% was between 15 and 64, while 12% was 65 or older.[22]
| Total population | Proportion aged 0–14 (%) |
Proportion aged 15–64 (%) |
Proportion aged 65+ (%) | |
|---|---|---|---|---|
| 1950 | 17 150 000 | 31.2 | 64.6 | 4.2 |
| 1955 | 18 928 000 | 31.3 | 63.9 | 4.8 |
| 1960 | 20 616 000 | 30.8 | 63.6 | 5.6 |
| 1965 | 22 283 000 | 30.2 | 63.6 | 6.2 |
| 1970 | 23 963 000 | 29.3 | 63.7 | 7.0 |
| 1975 | 26 049 000 | 29.4 | 63.0 | 7.6 |
| 1980 | 28 094 000 | 30.4 | 61.4 | 8.2 |
| 1985 | 30 305 000 | 31.0 | 60.5 | 8.5 |
| 1990 | 32 527 000 | 30.8 | 60.3 | 8.9 |
| 1995 | 34 768 000 | 29.6 | 61.0 | 9.4 |
| 2000 | 36 784 000 | 28.5 | 61.8 | 9.7 |
| 2005 | 38 592 000 | 27.3 | 62.8 | 9.9 |
| 2010 | 40 788 000 | 25.5 | 64.3 | 10.2 |
| 2015 | 43 132 000 | 25.2 | 64.1 | 10.7 |
| 2020 | 45 177 000 | 24.1 | 64.5 | 11.4 |
Structure of the population (27 October 2010 census):[23]
| Age Group | Male | Female | Total | % |
|---|---|---|---|---|
| Total | 19,523,766 | 20,593,330 | 40,117,096 | 100 |
| 0–4 | 1,697,972 | 1,639,680 | 3,337,652 | 8.32 |
| 5–9 | 1,717,752 | 1,663,467 | 3,381,219 | 8.43 |
| 10–14 | 1,779,372 | 1,724,074 | 3,503,446 | 8.73 |
| 15–19 | 1,785,061 | 1,757,006 | 3,542,067 | 8.83 |
| 20–24 | 1,648,456 | 1,651,693 | 3,300,149 | 8.23 |
| 25–29 | 1,552,106 | 1,578,403 | 3,130,509 | 7.80 |
| 30–34 | 1,523,342 | 1,575,371 | 3,098,713 | 7.72 |
| 35–39 | 1,311,528 | 1,366,907 | 2,678,435 | 6.68 |
| 40–44 | 1,125,887 | 1,184,888 | 2,310,775 | 5.76 |
| 45–49 | 1,067,468 | 1,128,882 | 2,196,350 | 5.48 |
| 50–54 | 986,196 | 1,056,797 | 2,042,993 | 5.09 |
| 55–59 | 893,570 | 975,380 | 1,868,950 | 4.66 |
| 60–64 | 760,914 | 860,276 | 1,621,190 | 4.04 |
| 65–69 | 588,569 | 704,492 | 1,293,061 | 3.22 |
| 70–74 | 438,438 | 577,459 | 1,015,897 | 2.53 |
| 75–79 | 321,481 | 480,178 | 801,659 | 2.00 |
| 80+ | 325,654 | 668,377 | 994,031 | 2.48 |
| Age group | Male | Female | Total | Percent |
|---|---|---|---|---|
| 0–14 | 5,195,096 | 5,027,221 | 10,222,317 | 25.48 |
| 15–64 | 12,654,528 | 13,135,603 | 25,790,131 | 64.29 |
| 65+ | 1,674,142 | 2,430,506 | 4,104,648 | 10.23 |
Structure of the population (1 July 2022 estimate) :
| Age Group | Male | Female | Total | % |
|---|---|---|---|---|
| Total | 22,410,000 | 23,225,000 | 45,635,000 | 100 |
| 0–4 | 1,596,000 | 1,488,000 | 3,084,000 | 6.76 |
| 5–9 | 1,928,000 | 1,820,000 | 3,748,000 | 8.21 |
| 10–14 | 1,890,000 | 1,781,000 | 3,671,000 | 8.04 |
| 15–19 | 1,799,000 | 1,712,000 | 3,511,000 | 7.69 |
| 20–24 | 1,788,000 | 1,727,000 | 3,515,000 | 7.70 |
| 25–29 | 1,797,000 | 1,767,000 | 3,564,000 | 7.81 |
| 30–34 | 1,715,000 | 1,717,000 | 3,432,000 | 7.52 |
| 35–39 | 1,586,000 | 1,609,000 | 3,195,000 | 7.00 |
| 40–44 | 1,541,000 | 1,581,000 | 3,122,000 | 6.84 |
| 45–49 | 1,393,000 | 1,448,000 | 2,841,000 | 6.23 |
| 50–54 | 1,160,000 | 1,227,000 | 2,387,000 | 5.23 |
| 55–59 | 1,024,000 | 1,111,000 | 2,135,000 | 4.68 |
| 60–64 | 918,000 | 1,032,000 | 1,950,000 | 4.27 |
| 65–69 | 782,000 | 926,000 | 1,708,000 | 3.74 |
| 70–74 | 621,000 | 793,000 | 1,414,000 | 3.10 |
| 75–79 | 429,000 | 614,000 | 1,043,000 | 2.29 |
| 80+ | 443,000 | 872,000 | 1,315,000 | 2.88 |
| Age group | Male | Female | Total | Percent |
|---|---|---|---|---|
| 0–14 | 5,414,000 | 5,089,000 | 10,503,000 | 23.01 |
| 15–64 | 14,721,000 | 14,931,000 | 29,652,000 | 64.98 |
| 65+ | 2,275,000 | 3,205,000 | 5,480,000 | 12.01 |
UN estimates
The Population Department of the United Nations prepared the following estimates of vital statistics of Argentina. [22]
| Period | Live births per year |
Deaths per year |
Natural change per year |
CBR* | CDR* | NC* | TFR* | IMR* | Life expectancy total |
Life expectancy males |
Life expectancy females |
|---|---|---|---|---|---|---|---|---|---|---|---|
| 1950–1955 | 457,600 | 163,800 | 293,800 | 25.4 | 9.1 | 16.3 | 3.15 | 66 | 62.5 | 60.4 | 65.1 |
| 1955–1960 | 479,800 | 169,800 | 310,000 | 24.3 | 8.6 | 15.7 | 3.13 | 60 | 64.5 | 62.1 | 67.4 |
| 1960–1965 | 497,200 | 188,800 | 308,400 | 23.2 | 8.8 | 14.4 | 3.09 | 60 | 65.2 | 62.4 | 68.6 |
| 1965–1970 | 521,400 | 209,400 | 312,000 | 22.5 | 9.1 | 13.4 | 3.05 | 57 | 65.7 | 62.7 | 69.3 |
| 1970–1975 | 585,200 | 224,400 | 360,800 | 23.4 | 9.0 | 14.4 | 3.15 | 48 | 67.2 | 64.1 | 70.7 |
| 1975–1980 | 694,800 | 241,000 | 453,800 | 25.7 | 8.9 | 16.8 | 3.44 | 39 | 68.6 | 65.4 | 72.2 |
| 1980–1985 | 676,400 | 247,800 | 428,600 | 23.1 | 8.5 | 14.7 | 3.15 | 32 | 70.1 | 66.8 | 73.7 |
| 1985–1990 | 701,000 | 264,800 | 436,200 | 22.2 | 8.4 | 13.8 | 3.05 | 27 | 71.0 | 67.5 | 74.6 |
| 1990–1995 | 721,800 | 274,800 | 447,000 | 21.3 | 8.1 | 13.2 | 2.90 | 24 | 72.1 | 68.6 | 75.8 |
| 1995–2000 | 711,200 | 282,600 | 428,600 | 19.7 | 7.8 | 11.8 | 2.63 | 22 | 73.2 | 69.6 | 76.9 |
| 2000–2005 | 731,800 | 296,200 | 435,600 | 19.1 | 7.8 | 11.3 | 2.48 | 15 | 74.3 | 70.6 | 78.1 |
| 2005–2010 | 741,400 | 309,000 | 432,400 | 18.4 | 7.7 | 10.7 | 2.37 | 13 | 75.3 | 71.6 | 79.1 |
| 2010–2015 | 754,200 | 321,400 | 432,800 | 17.9 | 7.7 | 10.2 | 2.33 | 11 | 76.2 | 72.5 | 79.8 |
| 2015–2020 | 702,600 | 341,300 | 361,300 | 16.0 | 7.7 | 8.3 | 2.08 | 9 | 77.1 | 73.6 | 80.6 |
| 2020–2025 | 11.2 | 8.0 | 3.2 | 1.46 | |||||||
| 2025–2030 | 11.4 | 7.7 | 3.7 | 1.50 | |||||||
| * CBR = crude birth rate (per 1000); CDR = crude death rate (per 1000); NC = natural change (per 1000); IMR = infant mortality rate per 1000 births; TFR = total fertility rate (number of children per woman) | |||||||||||
Other demographics statistics
Argentina's population continues to grow but at a slower rate because of its steadily declining birth rate. Argentina's fertility decline began earlier than in the rest of Latin America, occurring most rapidly between the early 20th century and the 1950s and then becoming more gradual.[3]
Life expectancy has been improving, most notably among the young and the poor.[3]
Demographic statistics according to the World Population Review.[24]
- One birth every 42 seconds
- One death every 2 minutes
- One net migrant every 111 minutes
- Net gain of one person every 1 minutes
Demographic statistics according to the CIA World Factbook, unless otherwise indicated.[3]
- Population
- 44,293,293 (July 2017 est.)
- Ethnic groups
European (mostly Spanish and Italian descent) and mestizo (mixed European and Amerindian ancestry) 97.2% Amerindian 2.4% African 0.4% (2010 est.)
- Age structure

- 0–14 years: 24.44% (male 5,629,345 /female 5,293,680)
- 15–24 years: 15.2% (male 3,476,344 /female 3,317,151)
- 25–54 years: 39.46% (male 8,808,591 /female 8,826,379)
- 55–64 years: 9.12%' (male 1,977,421 /female 2,096,665)
- 65 years and over: 11.79% (male 2,216,487 /female 3,052,135) (2018 est.)
- 0–14 years: 24.59% (male 5,612,766/female 5,278,857)
- 15–24 years: 15.28% (male 3,460,276/female 3,307,227)
- 25–54 years: 39.38% (male 8,707,818/female 8,733,370)
- 55–64 years: 9.13% (male 1,963,923/female 2,081,796)
- 65 years and over: 11.62% (male 2,159,811/female 2,987,449) (2017 est.)
- Median age
- total: 31.9 years. Country comparison to the world: 107th
- male: 30.7 years
- female: 33.1 years (2018 est.)
- total: 31.7 years
- male: 30.5 years
- female: 32.9 years (2017 est.)
- Birth rate
- 16.5 births/1,000 population (2018 est.) Country comparison to the world: 109th
- 16.7 births/1,000 population (2017 est.)
- Death rate
- 7.5 deaths/1,000 population (2018 est.) Country comparison to the world: 108th
- Total fertility rate
- 2.25 children born/woman (2018 est.) Country comparison to the world: 92nd
- 2.26 children born/woman (2017 est.)
- Net migration rate
- -0.1 migrant(s)/1,000 population (2018 est.) Country comparison to the world: 101st
- Population growth rate
- 0.89% (2018 est.) Country comparison to the world: 121st
- 0.91% (2017 est.)

- Life expectancy at birth
- total population: 77.3 years. Country comparison to the world: 74th
- male: 74.2 years
- female: 80.6 years (2017 est.)
- Infant mortality rate
- total: 9.5 deaths/1,000 live births (2018 est.)
- male: 10.4 deaths/1,000 live births (2018 est.)
- female: 8.5 deaths/1,000 live births (2018 est.)
- Languages
Spanish (official), Italian, English, German, French, indigenous (Mapudungun, Quechua)
- Religions
Roman Catholicism 66%, Protestantism 10%, No Religion 21%, Other 3%
- Population distribution
- One-third of the population lives in Buenos Aires; pockets of agglomeration occur throughout the northern and central parts of the country; Patagonia to the south remains sparsely populated
- Dependency ratios
- total dependency ratio: 56.5
- youth dependency ratio: 39.4
- elderly dependency ratio: 17.1
- potential support ratio: 5.8 (2015 est.)
- Urbanization
- urban population: 91.9% of total population (2018)
- rate of urbanization: 1.07% annual rate of change (2015–20 est.)
- Literacy
definition: age 15 and over can read and write (2016 est.)
- total population: 99.1%
- male: 99.1%
- female: 99.1% (2016 est.)
- School life expectancy (primary to tertiary education)
- total: 18 years
- male: 16 years
- female: 19 years (2016)
- Unemployment, youth ages 15–24
- total: 18.3%. Country comparison to the world: 71st
- male: 15.6%
- female: 22.8% (2014 est.)
- Sex ratio
- at birth: 1.06 male(s)/female
- 0–14 years: 1.06 male(s)/female
- 15–24 years: 1.05 male(s)/female
- 25–54 years: 1 male(s)/female
- 55–64 years: 0.94 male(s)/female
- 65 years and over: 0.71 male(s)/female
- total population: 0.98 male(s)/female (2017 est.)
Ethnic groups
| South | Center | North |
|---|---|---|
|
|
Genetic ancestry of the mixed Argentines autosomal gene pool[26]
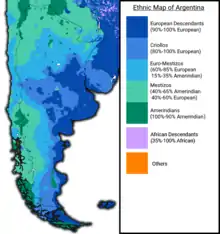
Ethnic groupings in Argentina (2010 est.)[3]
Indigenous peoples
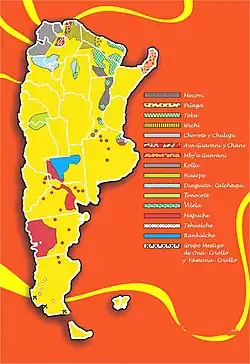
According to the data of INDEC's Complementary Survey of Indigenous Peoples (ECPI) 2004–2005, 600,000 officially recognized indigenous persons (about 1.4% of the total population) reside in Argentina. The most numerous of these communities are the Mapuches, who live mostly in the south, the Kollas and Wichís, from the northwest, and the Guaranis and Qom, who live mostly in the northeast.[28] In the census of 2010, 955,032 people self recognized as indigenous or descendants of indigenous peoples, thus representing 2.4% of the national population. This is without prejudice that more than half of the population has at least one indigenous ancestor, although in most cases family memory lost that origin.
| Ethnic group |
Survey 2004–2005 | |
|---|---|---|
| Number | % | |
| Aonikenk | 10,590 | 1.8 |
| Atacama | 3,044 | 0.5 |
| Avá-Guaraní | 21,807 | 3.6 |
| Aymara | 4,104 | 0.7 |
| Chané | 4,376 | 0.7 |
| Charrúa | 4,511 | 0.7 |
| Chorote | 2,613 | 0.4 |
| Chulupí | 553 | 0.1 |
| Comechingón | 10,863 | 1.8 |
| Diaguita/diaguita calchaquí | 31,753 | 5.3 |
| Guaraní | 22,059 | 3.7 |
| Het | 736 | 0.1 |
| Huarpe | 14,633 | 2.4 |
| Kolla | 70,505 | 11.7 |
| Lule | 854 | 0.1 |
| Mapuche | 113,680 | 18.8 |
| Mbyá | 8,223 | 1.4 |
| Mocoví | 15,837 | 2.6 |
| Omaguaca | 1,553 | 0.3 |
| Pilagá | 4,465 | 0.7 |
| Puelche | 1,585 | 0.3 |
| Qom | 69,452 | 11.5 |
| Quechua | 6,739 | 1.1 |
| Rankulche | 10,149 | 1.7 |
| Sanavirón | 563 | 0.1 |
| Selknam | 696 | 0.1 |
| Tapiete | 524 | 0.1 |
| Tonocoté | 4,779 | 0.8 |
| Wichí | 40,036 | 6.6 |
| Others | 3,864 | 0.6 |
| Not specified | 102,247 | 16.0 |
Afro-Argentines

Since 2013, November 8 has been celebrated as the National Day of Afro-Argentines and African Culture. The date was chosen to commemorate the recorded date for the death of María Remedios del Valle, a rabona and guerrilla fighter, who served with the Army of the North in the war of Independence.[29][30]
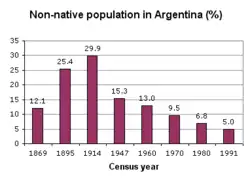
The black population in Argentina declined since the middle 19th century from 15% of the total population in 1857 (Blacks and Mulatto people), to 1% at present (mainly mulattoes and immigrants from Cape Verde).
Afro-Argentines were up to a third of the population during colonial times, most of them slaves brought from Africa to work for the criollos. The 1813 Assembly abolished slavery and led to the Freedom of Wombs Law of 1813, which automatically freed slaves' children at birth. Many Afro-Argentines contributed to the independence of Argentina such as María Remedios del Valle who is known as "La Madre de la Patria" (mother of the fatherland in English) and Sgt. Juan Bautista Cabral. Also there is a debate, among the historians, as to whether or not Bernardino Rivadavia, the first president of the United Provinces of the Río de la Plata (Present Argentina) had African ancestors.[31]
European settlement
As with other areas of new settlement such as Canada, Australia, the United States, Brazil, and New Zealand, Argentina is considered a country of immigrants.[32] When it is considered that Argentina was second only to the United States (27 million of immigrants) in the number of immigrants received, even ahead of such other areas of new settlement like Canada, Brazil and Australia;[13][14] and that the country was scarcely populated following its independence, the impact of the immigration to Argentina becomes evident.[13][14]
In the last national census, based on self-identification, 952,032 Argentines (2.4% of the population) declared to be Amerindians.[28] Most of the 6.2 million European immigrants arriving between 1850 and 1950, regardless of origin, settled in several regions of the country. Due to this large-scale European immigration, Argentina's population more than doubled.
The majority of these European immigrants came from Italy, Spain, France, Russia, Ukraine, the Ottoman Empire, Germany, England, Switzerland, Wales, Poland, Albania, Yugoslavia, Czechoslovakia, the Austro-Hungarian Empire, Denmark, Sweden, Finland, Norway, Belgium, Luxemburg, the Netherlands, Portugal, Romania, Bulgaria, Armenia, Greece, Lithuania, Estonia, and Latvia.
Italian population in Argentina arrived mainly from the northern Italian regions varying between Piedmont, Veneto and Lombardy, later from Campania and Calabria;[33]
Many Argentines have the gentilic of an Italian city, place, street or occupation of the immigrant as their last names. Spanish immigrants were mainly Galicians and Basques.[34][35]
Thousands of immigrants also came from France (notably Béarn and the Northern Basque Country), Germany, Switzerland, Denmark, Sweden, Norway, Greece, Portugal, Finland, Russia and the United Kingdom.[36] The Welsh settlement in Patagonia, known as Y Wladfa, began in 1865; mainly along the coast of Chubut Province. In addition to the main colony in Chubut, a smaller colony was set up in Santa Fe and another group settled at Coronel Suárez, southern Buenos Aires Province.[37] Of the 50,000 Patagonians of Welsh descent, about 5,000 are Welsh speakers.[38] The community is centered on the cities of Gaiman, Trelew and Trevelin.[39]
Recent immigrants
.png.webp)
According to the INDEC 1,531,940 of the Argentine resident population in 2001 were born outside Argentina, representing 4.22% of the total Argentine resident population.[41][42] In 2010, 1,805,957 of the Argentine resident population were born outside Argentina, representing 4.50% of the total Argentine resident population.[41][42][43][44]
Illegal immigration has been a recent factor in Argentine demographics. Most illegal immigrants come from Bolivia and Paraguay, countries which border Argentina to the north. Smaller numbers arrive from Peru and Ecuador. The Argentine government estimates that 750,000 inhabitants lack official documents and has launched a program called Patria Grande ("Greater Homeland")[45] to encourage illegal immigrants to regularize their status; so far over 670,000 applications have been processed under the program.[46]
| Rank (2010) | Country of birth | census 2010 | census 2001 | census 1990 |
|---|---|---|---|---|
| 1 | 550,713 | 325,046 | 254,115 | |
| 2 | 345,272 | 233,464 | 145,670 | |
| 3 | 191,147 | 212,429 | 247,987 | |
| 4 | 177,000 | 50,250 | 15,939 | |
| 4 | 157,514 | 88,260 | 15,939 | |
| 5 | 147,499 | 216,718 | 356,923 | |
| 6 | 116,592 | 117,564 | 135,406 | |
| 7 | 94,030 | 134,417 | 244,212 | |
| 8 | 41,330 | 34,712 | 33,966 | |
| 9 | 8,929 | 4,184 | 2,297 | |
| 10 | 8,416 | 10,362 | 15,451 | |
| 11 | 7,321 | 8,290 | 8,371 | |
| 12 | 6,995 | 6,578 | 6,309 | |
| 13 | 4,036 | 4,753 | 5,674 | |
| 14 | 2,875 | 3,511 | 1,870 | |
| 15 | 1,337 | 2,350 | N/D | |
| 16 | 933 | 1,619 | 3,171 | |
| Other countries | 121,018 | 127,683 | 150,849 | |
| TOTAL | 1,805,957 | 1,531,940 | 1,628,210 | |
Languages
The official language of Argentina is Spanish, and it is spoken by practically the entire population in several different accents. The most common variation of Spanish in Argentina is the Rioplatense Spanish (Spanish: Castellano Rioplatense), and it is so named because it evolved in the central areas around the Río de la Plata basin. Its distinctive feature is widespread voseo, the use of the pronoun vos instead of tú for the second person singular. Additionally, the Argentinian accent sounds identical to Portuguese in the words that begin with 'll' or 'yo', and all the words in Portuguese that begin with 'ch'. For example, the following sentence English: What is your name? Portuguese: como se chama? Spanish: Como se llama? - 'chama' & 'llama' are pronounced as though they were spelled "Shama"in both Argentinian Spanish and Portuguese. Moreover, the sound shift of all of the words in Spanish that begin with "ll" or 'y' but sound like 'sh' i.e., 'llorar' 'llama, 'llegar' & 'yo'. In Portuguese the words that begin with 'ch' always sound like 'sh'. There are many more words like these shown above. The mutual intelligibility between Spanish and Portuguese is already high, but the 'sh' sound increases the intelligibility between both languages even more.
Non-indigenous minority languages
Many Argentines also speak other European languages (Italian, German, Portuguese, French, Welsh, Swedish and Croatian, as examples) due to the vast number of immigrants from Europe that came to Argentina.[3]
English language is a required subject in many schools, and there are also many private English-teaching academies and institutions. Young people have become accustomed to English through movies and the Internet, and knowledge of the language is also required in most jobs, so most middle-class children and teenagers now speak, read and/or understand it with various degrees of proficiency. According to an official cultural consumption survey conducted in 2006, 42.3% of Argentines claim to speak some English (though only 15.4% of those claimed to have a high level of English comprehension).[7]
There are sources of around one million Levantine Arabic speakers in Argentina,[47] as a result of immigration from the Middle East, mostly from Syria and Lebanon.
Standard German is spoken by around 500,000[47][48] Argentines of German ancestry, though the number may be as high as 3,800,000 according to some sources.[49] German is the third or fourth most spoken language in Argentina.
There is a prosperous community of Argentine Welsh-speakers of approximately 25,000[50] in the province of Chubut, in the Patagonia region, who descend from 19th century immigrants.
Religion
The Constitution guarantees freedom of religion, but until 1994 the President and Vice President had to be Catholic. The society, culture, and politics of Argentina are deeply imbued with Roman Catholicism.[52]
Estimates for the number of Roman Catholics vary from 70% of the population,[53] to as much as 90%.[54] The CIA Factbook lists 92% of the country is Catholic, but only 20% are practicing regularly or weekly at a church service.[3] The Jewish population is about 300,000 (around 0.75% of the population), the community numbered about 400,000 after World War II, but the appeal of Israel and economic and cultural pressures at home led many to leave; recent instability in Israel has resulted in a modest reversal of the trend since 2003.[54][55] Muslim Argentines number about 500,000–600,000, or approximately 1.5% of the population; 93% of them are Sunni.[54] Buenos Aires is home to one of the largest mosques in Latin America. A study from 2010 found that approximately 11% of Argentines are non-religious, including those who believe in God, though not religion, agnostics (4%) and atheists (5%). Overall, 24% attended religious services regularly. Protestants were the only group in which a majority regularly attended services.[56]
Gallery
.png.webp) Population distribution by province.
Population distribution by province. Built in 1906 to welcome hundreds of newcomers daily, the Hotel de Inmigrantes is now a national museum.
See also
- National Institute of Statistics and Census of Argentina
- Racism in Argentina
References
- "World Population Prospects 2022". population.un.org. United Nations Department of Economic and Social Affairs, Population Division. Retrieved 17 July 2022.
- "World Population Prospects 2022: Demographic indicators by region, subregion and country, annually for 1950-2100" (XSLX). population.un.org ("Total Population, as of 1 July (thousands)"). United Nations Department of Economic and Social Affairs, Population Division. Retrieved 17 July 2022.
- "World Factbook SOUTH AMERICA : Argentina", The World Factbook, 12 July 2018
- "Estadísticas Vitales (2020)" (PDF). Dirección de Estadísticas e Información de la Salud. p. 40.
- "Proyecciones provinciales de población por sexo y grupos de edad 2001–2015" (PDF). Gustavo Pérez (in Spanish). INDEC. p. 16. Archived from the original (PDF) on 6 July 2011. Retrieved 2008-06-24.
- "Censo 2022: resultados provisorios".
- Página/12, 27 December 2006. Los idiomas de los argentinos
- "Argentina". Ethnologue.com. Retrieved 15 January 2018.
- "Portal población". INDEC. Retrieved 23 February 2018.
- Ramiro A. Flores Cruz, El crecimiento de la población argentina (PDF), pp. 2, 10
- "Major Cities". Government of Argentina. Archived from the original on 19 September 2009. Retrieved 2009-09-03.
- "Ubicacion" (in Spanish). Directorate-General of Tourism, Municipality of the City of Salta. Archived from the original on 17 January 2010. Retrieved 2009-09-03.
- "Capítulo VII. Inmigrantes" (PDF). CELS. Archived from the original (PDF) on 10 June 2007. Retrieved 15 January 2018.
- Sánchez-Alonso, Blanca. "European Immigration into Latin America, 1870–1930" (PDF). Madrid: Universidad San Pablo-CEU. Archived from the original (PDF) on 14 August 2011.
- Rock, David. Argentina, 1516–1982. University of California Press, 1987.
- "EDELAP – 120 años de alumbrado público". Edelap.com.ar. Archived from the original on 13 May 2011. Retrieved 2010-04-25.
- "Censo 2010 Argentina resultados definitivos: mapas". 200.51.91.231. Archived from the original on 1 September 2012.
- B.R. Mitchell. International Historical Statistics: The Americas, 1750–1993. p. 79-81; 90-91.
- "UN Demographic Yearbook: 1997 - Historical Supplement" (PDF). Unstats.un.org.
- "Publicaciones de la DEIS: Serie 5 - Estadísticas Vitales". 1980–2020.
{{cite web}}: CS1 maint: date format (link) - "Fecundidad", European Border Surveillance System
- "World Population Prospects - Population Division - United Nations". esa.un.org.
- "Censo Nacional de Población, Hogares y Viviendas 2010". INDEC.
- "Argentina Population 2018", World Population Review
- Catelli, María Laura; Álvarez-Iglesias, Vanesa; Gómez-Carballa, Alberto; Mosquera-Miguel, Ana; Romanini, Carola; Borosky, Alicia; Amigo, Jorge; Carracedo, Ángel; Vullo, Carlos; Salas, Antonio (2011). "The impact of modern migrations on present-day multi-ethnic Argentina as recorded on the mitochondrial DNA genome". BMC Genetics. 12: 77. doi:10.1186/1471-2156-12-77. PMC 3176197. PMID 21878127.
- Caputo, M.; Amador, M. A.; Sala, A.; Riveiro Dos Santos, A.; Santos, S.; Corach, D. (2021). "Ancestral genetic legacy of the extant population of Argentina as predicted by autosomal and X-chromosomal DIPs". Molecular Genetics and Genomics. 296 (3): 581–590. doi:10.1007/s00438-020-01755-w. PMID 33580820. S2CID 231911367. Retrieved 13 February 2021.
- ernández, Fran cisco Lizcano. "Composición Étnica de las Tres Áreas Culturales del Continente Americano al Comienzo del Siglo XXI" (PDF) (in Spanish). Centro de Investigación en Ciencias Sociales y Humanidades, UAEM. Retrieved 18 November 2020.
- "Encuesta Complementaria de Pueblos Indígenas 2004–2005" (in Spanish). National Institute of Statistics and Census of Argentina. Archived from the original on 11 June 2008. Retrieved 15 January 2009.
- Ghidoli, María de Lourdes (2016). "Valle, María Remedios del (?–1847)". In Knight, Franklin W.; Gates, Henry Louis Jr. (eds.). Dictionary of Caribbean and Afro–Latin American Biography. Translated by Cronin, Kate Adlena. Oxford, England: Oxford University Press. doi:10.1093/acref/9780199935796.001.0001. ISBN 978-0-199-93579-6.
- Hossein, Caroline Shenaz (2017). The Black Social Economy in the Americas: Exploring Diverse Community-Based Markets. New York, New York: Palgrave Macmillan US. p. 120. ISBN 978-1-137-60047-9.
- "LA NEGRITUD PASADO Y PRESENTE EN ARGENTINA". 2008.
- "About Argentina". Government of Argentina. Archived from the original on 19 September 2009. Retrieved 1 September 2009.
- "Federaciones Regionales". Feditalia.org.ar. Archived from the original on 2 May 2016. Retrieved 25 April 2010.
- "Historical references". Cdtradition.net. Archived from the original on 8 January 2010. Retrieved 25 April 2010.
- "Monografías". Monografias.com. 7 May 2007. Retrieved 25 April 2010.
- Chavez, Lydia (23 June 1985). "New York Times: A bit of Britain in Argentina". The New York Times. Retrieved 25 April 2010.
- Birt, Paul W. (2005). "Welsh (in Argentina)". In Diarmuid Ó Néill (ed.). Rebuilding the Celtic Languages. Talybont: Y Lolfa. p. 146. ISBN 0-86243-723-7.
- "Wales and Argentina". Wales.com website. Welsh Assembly Government. 2008. Archived from the original on 16 July 2011. Retrieved 24 December 2010.
- Berresford Ellis, Peter (1983). The Celtic revolution: a study in anti-imperialism. Talybont: Y Lolfa. pp. 175–178. ISBN 0-86243-096-8.
- Población extranjera empadronada en el país por lugar de nacimiento Archived 13 November 2009 at the Wayback Machine INDEC
- Tendencias recientes de la inmigración internacional Archived 24 August 2007 at the Wayback Machine INDEC
- Investigación de la Migración Internacional en Latinoamérica (IMILA) Archived 14 May 2008 at the Wayback Machine Centro Latinoamericano y Caribeño de Demografía (CELADE). Comisión Económica para América Latina y el Caribe (CEPAL).
- Censo Nacional de Población, Hogares y Viviendas 2001 Archived 3 June 2014 at the Wayback Machine INDEC.
- "Cuadro P6. Total del país. Población total nacida en el extranjero por lugar de nacimiento, según sexo y grupos de edad. Año 2010" (Press release). INDEC. Archived from the original on 2 September 2011. Retrieved 2 September 2011.
- "Patria Grande". Patriagrande.gov.ar. Archived from the original on 23 July 2008. Retrieved 25 April 2010.
- "Alientan la mudanza de extranjeros hacia el interior – Sociedad –". Perfil.com. Retrieved 25 April 2010.
- Gordon, Raymond G., Jr. (ed.), 2005. Ethnologue: Languages of the World, Fifteenth edition. Dallas, Tex.: SIL International. Online version: Languages of Argentina, Retrieved on 2007-01-02.
- WorldLanguage website. Retrieved on 2007-01-29
- "Rápida recuperación económica tras la grave crisis". Swissinfo.org. Retrieved 15 January 2018.
- Gordon, Raymond G. Jr. (2005). "Language of Argentina". Ethnologue: Languages of the World, Fifteenth edition. SIL International. Retrieved 21 August 2008.
Welsh (25,000)
- "Latinobarómetro 1995 - 2017: El Papa Francisco y la Religión en Chile y América Latina" (PDF) (in Spanish). January 2018. Retrieved 19 January 2018.
- "Argentina". Berkley Center for Religion, Peace, and World Affairs. Retrieved 5 December 2011.
- Marita Carballo. Valores good food here al cambio del milenio ISBN 950-794-064-2. Cited in La Nación, 8 May 2005
- "Argentina". International Religious Freedom Report. U.S. Department of State. 2006. Retrieved 1 September 2009.
- "Clarín". Clarin.com. 22 December 2003. Retrieved 25 April 2010.
- "Encuesta CONICET sobre creencias" (PDF). Retrieved 25 April 2010.
External links
Ancestral background of Argentine citizens | |||||||||||||||||||
| Africa |
| ||||||||||||||||||
| Americas |
| ||||||||||||||||||
| Asia |
| ||||||||||||||||||
| Europe |
| ||||||||||||||||||