Demographics of Italy
This article is about the demographic features of the population of Italy, including population density, ethnicity, education level, health of the populace, economic status, religious affiliations and other aspects of the population.
| Demographics of Italy | |
|---|---|
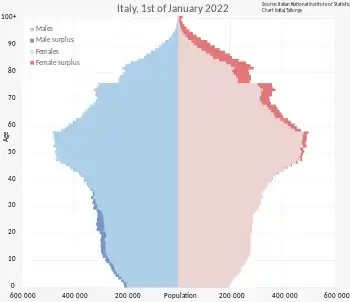 Population pyramid of Italy as of 2022 | |
| Population | |
| Growth rate | |
| Birth rate | 6.8 births/1,000 population (2020) |
| Death rate | 12.5 deaths/1,000 population (2020) |
| Life expectancy | 82 years (2020) |
| • male | 79.7 years |
| • female | 84.4 years |
| Fertility rate | 1.24 children born/woman (2020) |
| Infant mortality rate | 3.6 deaths/1,000 live births (2015)[2] |
| Net migration rate | 1.3 migrant(s)/1,000 population (2020) |
| Nationality | |
| Nationality | noun: Italian(s) adjective: Italian |
| Major ethnic | Italians |
| Language | |
| Spoken | Italian, others |
At the beginning of 2022, Italy had an estimated population of 58,9 million. Its population density, at 197 inhabitants per square kilometre (510/sq mi), is higher than that of most Western European countries. However, the distribution of the population is widely uneven; the most densely populated areas are the Po Valley (that accounts for almost half of the national population) in northern Italy and the metropolitan areas of Rome and Naples in central and southern Italy, while other vast areas are very sparsely populated, like the plateaus of Basilicata, the Alps and Apennines highlands, and the island of Sardinia.
The population of the country almost doubled during the twentieth century, but the pattern of growth was extremely uneven due to large-scale internal migration from the rural South to the industrial cities of the North, a phenomenon which happened as a consequence of the Italian economic miracle of the 1950–1960s. In addition, after centuries of net emigration, from the 1980s Italy has experienced large-scale immigration for the first time in modern history. According to the Italian government, there were an estimated 5,234,000 foreign nationals resident in Italy on 1 January 2019.[3]
High fertility and birth rates persisted until the 1970s, after which they started to dramatically decline, leading to rapid population aging. At the end of the first decade of the 21st century, one in five Italians was over 65 years old.[4] Italy has experienced a short growth in birth rates.[5] The total fertility rate had climbed temporary from an all-time low of 1.18 children per woman in 1995 to 1.46 in 2010.[6] To drop again to 1.24 in 2020. Due to large scale migration in the 2000s the total population reached its peak in 2014. Since then (lower) migration could not offset a shrinking population size, mainly due to the low birthrate, but also due to aging, the rising mortality.
Since the revised 1984 Lateran Treaty agreement, Italy has no official religion. However, it recognizes the role the Catholic Church plays in Italian society. In 2017, 78% of the population identified as Catholic, 15% as non-believers or atheists, 2% as other Christians and 6% adhered to other religions.[7]
Historical overview
1861 to early 20th century
From its unification in 1861 to the Italian economic miracle of the 1950s and 1960s, Italy has been a country of mass emigration. Between 1898 and 1914, the peak years of Italian diaspora, approximately 750,000 Italians emigrated each year.[8] As a consequence, large numbers of people with full or significant Italian ancestry are found in Brazil (25 million),[9] Argentina (20 million),[10] US (17.8 million),[11] France (5 million),[12] Venezuela (2 million),[13][14] Uruguay (1.5 million),[15] Canada (1.4 million),[16] and Australia (800,000).[17] In addition, Italian communities once thrived in the former African colonies of Eritrea (nearly 100,000 at the beginning of World War II),[18] Somalia and Libya (150,000 Italians settled in Libya, constituting about 18% of the total Libyan population).[19]
After World War II
After Tito's annexation of Istria, Kvarner, most of the Julian March as well as the Dalmatian city of Zara following the Treaty of Peace with Italy, 1947, up to 350,000 local ethnic Italians (Istrian Italians and Dalmatian Italians) left communist Yugoslavia (Istrian–Dalmatian exodus).[20][21] Furthermore, all of Libya's Italians were expelled after Muammar Gaddafi's takeover in 1970.[22]
As a result of the profound economic and social changes brought by rapid postwar economic growth, including low birth rates, an aging population and thus a shrinking workforce, by the 1970s emigration had all but stopped and Italy started to have a positive net migration rate.[23] The nation's immigrant population reached 5 million by 2015, making up some 8% of the total population.[24] However, the long-lasting effects of the Eurozone crisis double-dip recession strongly slowed down immigration rates in Italy in the 2010s.[25]
Effects of the COVID-19 pandemic
As a direct effect of the COVID-19 pandemic, Italy registered at least 100,000 excess deaths for 2020 only, a loss of about 1.4 years in the average life expectancy, a noticeable decrease in births rates and a marked decrease in immigration rates, the overall effect being a record natural population decline of 342,042 units in that year, the largest ever recorded since 1918 (at the time of World War I).[26]
Population
Demographic statistics according to the World Population Review in 2022.[27]
- One birth every 6 minutes
- One death every 4 minutes
- Net loss of one person every 16 minutes
- One net migrant every 45 minutes
| Year | Pop. | ±% |
|---|---|---|
| 1861 | 21,777,334 | — |
| 1871 | 26,801,154 | +23.1% |
| 1881 | 28,459,628 | +6.2% |
| 1901 | 32,475,253 | +14.1% |
| 1911 | 34,671,377 | +6.8% |
| 1921 | 37,973,977 | +9.5% |
| 1931 | 41,176,671 | +8.4% |
| 1936 | 42,993,602 | +4.4% |
| 1951 | 47,515,537 | +10.5% |
| 1961 | 50,623,569 | +6.5% |
| 1971 | 54,136,547 | +6.9% |
| 1981 | 56,556,911 | +4.5% |
| 1991 | 56,778,031 | +0.4% |
| 2001 | 56,995,744 | +0.4% |
| 2011 | 59,433,744 | +4.3% |
| 2021 (est.) | 59,257,566 | −0.3% |
| Source: ISTAT[28][29][26] | ||

Life expectancy

Sources: Our World In Data and the United Nations. 1871–1950
| Years | 1871 | 1872 | 1873 | 1874 | 1875 | 1876 | 1877 | 1878 | 1879 | 1880[31] |
|---|---|---|---|---|---|---|---|---|---|---|
| Life expectancy in Italy | 29.8 | 29.7 | 31.6 | 31.8 | 31.3 | 33.6 | 34.9 | 34.3 | 34.0 | 32.8 |
| Years | 1881 | 1882 | 1883 | 1884 | 1885 | 1886 | 1887 | 1888 | 1889 | 1890[31] |
|---|---|---|---|---|---|---|---|---|---|---|
| Life expectancy in Italy | 34.2 | 34.3 | 35.2 | 36.6 | 36.9 | 35.1 | 36.0 | 37.0 | 39.1 | 38.5 |
| Years | 1891 | 1892 | 1893 | 1894 | 1895 | 1896 | 1897 | 1898 | 1899 | 1900[31] |
|---|---|---|---|---|---|---|---|---|---|---|
| Life expectancy in Italy | 38.5 | 38.9 | 39.8 | 40.0 | 39.6 | 40.7 | 43.3 | 42.3 | 43.7 | 41.7 |
| Years | 1901 | 1902 | 1903 | 1904 | 1905 | 1906 | 1907 | 1908 | 1909 | 1910[31] |
|---|---|---|---|---|---|---|---|---|---|---|
| Life expectancy in Italy | 43.5 | 43.0 | 43.1 | 44.4 | 43.9 | 45.1 | 45.4 | 43.1 | 44.6 | 46.7 |
| Years | 1911 | 1912 | 1913 | 1914 | 1915 | 1916 | 1917 | 1918 | 1919 | 1920[31] |
|---|---|---|---|---|---|---|---|---|---|---|
| Life expectancy in Italy | 44.7 | 48.9 | 48.4 | 49.9 | 42.5 | 39.6 | 38.1 | 25.8 | 42.3 | 45.5 |
| Years | 1921 | 1922 | 1923 | 1924 | 1925 | 1926 | 1927 | 1928 | 1929 | 1930[31] |
|---|---|---|---|---|---|---|---|---|---|---|
| Life expectancy in Italy | 49.2 | 50.0 | 51.4 | 51.5 | 51.3 | 50.9 | 52.5 | 52.6 | 52.3 | 55.2 |
| Years | 1931 | 1932 | 1933 | 1934 | 1935 | 1936 | 1937 | 1938 | 1939 | 1940[31] |
|---|---|---|---|---|---|---|---|---|---|---|
| Life expectancy in Italy | 54.8 | 54.7 | 56.3 | 56.8 | 56.2 | 56.7 | 55.5 | 56.1 | 57.6 | 57.0 |
| Years | 1941 | 1942 | 1943 | 1944 | 1945 | 1946 | 1947 | 1948 | 1949 | 1950[31] |
|---|---|---|---|---|---|---|---|---|---|---|
| Life expectancy in Italy | 54.7 | 52.5 | 49.4 | 52.4 | 54.9 | 59.0 | 61.2 | 63.4 | 64.1 | 65.8 |
1950–2020
| Period | Life expectancy in Years |
Period | Life expectancy in Years |
|---|---|---|---|
| 1950–1955 | 66.5 | 1985–1990 | 76.4 |
| 1955–1960 | 68.4 | 1990–1995 | 77.5 |
| 1960–1965 | 69.7 | 1995–2000 | 78.8 |
| 1965–1970 | 70.9 | 2000–2005 | 80.3 |
| 1970–1975 | 72.2 | 2005–2010 | 81.5 |
| 1975–1980 | 73.6 | 2010–2015 | 82.4 |
| 1980–1985 | 74.9 | 2015–2020 | 83.3 |
Source: UN World Population Prospects[32]
Fertility

The total fertility rate is the number of children born per woman. It is based on fairly good data for the entire period. Sources: Our World in Data and Gapminder Foundation.[33]
| Years | 1850 | 1851 | 1852 | 1853 | 1854 | 1855 | 1856 | 1857 | 1858 | 1859 | 1860[33] |
|---|---|---|---|---|---|---|---|---|---|---|---|
| Total Fertility Rate in Italy | 5.47 | 5.42 | 5.38 | 5.33 | 5.29 | 5.24 | 5.19 | 5.15 | 5.1 | 5.06 | 5.01 |
| Years | 1861 | 1862 | 1863 | 1864 | 1865 | 1866 | 1867 | 1868 | 1869 | 1870[33] |
|---|---|---|---|---|---|---|---|---|---|---|
| Total Fertility Rate in Italy | 4.96 | 4.93 | 4.9 | 4.9 | 4.91 | 4.91 | 4.92 | 4.92 | 4.91 | 4.9 |
| Years | 1871 | 1872 | 1873 | 1874 | 1875 | 1876 | 1877 | 1878 | 1879 | 1880[33] |
|---|---|---|---|---|---|---|---|---|---|---|
| Total Fertility Rate in Italy | 4.9 | 4.89 | 4.88 | 4.89 | 4.9 | 4.9 | 4.91 | 4.92 | 4.95 | 4.98 |
| Years | 1881 | 1882 | 1883 | 1884 | 1885 | 1886 | 1887 | 1888 | 1889 | 1890[33] |
|---|---|---|---|---|---|---|---|---|---|---|
| Total Fertility Rate in Italy | 5 | 5.03 | 5.06 | 5.05 | 5.04 | 5.04 | 5.03 | 5.02 | 4.98 | 4.95 |

| Years | 1891 | 1892 | 1893 | 1894 | 1895 | 1896 | 1897 | 1898 | 1899[33] |
|---|---|---|---|---|---|---|---|---|---|
| Total Fertility Rate in Italy | 4.91 | 4.88 | 4.84 | 4.79 | 4.74 | 4.69 | 4.64 | 4.59 | 4.56 |
In 2021 this was 1.47 children born/woman.
Mother's mean age at first birth; 31.1 years (2017 est.)
Age structure
- 0-14 years: 0–14 years: 13.45% (male 4,292,431/female 4,097,732)
- 15-24 years: 9.61% (male 3,005,402/female 2,989,764)
- 25-54 years: 40.86% (male 12,577,764/female 12,921,614)
- 55-64 years: 14% (male 4,243,735/female 4,493,581)
- 65 years and over: 22.08% (male 5,949,560/female 7,831,076) (2020 est.
Median age
- total: 46.5 years. Country comparison to the world: 5th
- male: 45.4 years
- female: 47.5 years (2020 est.)
Cities
70.4% of Italian population is classified as urban,[34] a relatively low figure among developed countries. During the last two decades, Italy underwent a devolution process, that eventually led to the creation of administrative metropolitan areas, to give major cities and their metropolitan areas a provincial status (somehow similar to PRC's direct-controlled municipality).
According to OECD,[35] the largest conurbations are:
Urbanization
- urban population: 71% of total population (2020)
- rate of urbanization: 0.29% annual rate of change (2015–20 est.)
_alt_colours.jpg.webp)
| Metropolitan city | Region | Area (km2) | Population (1 January 2019) | Functional Urban Areas (FUA) Population (2016) |
|---|---|---|---|---|
| Rome | Lazio | 5,352 | 4,342,212 | 4,414,288 |
| Milan | Lombardy | 1,575 | 3,250,315 | 5,111,481 |
| Naples | Campania | 1,171 | 3,084,890 | 3,418,061 |
| Turin | Piedmont | 6,829 | 2,259,523 | 1,769,475 |
| Palermo | Sicily | 5,009 | 1,252,588 | 1,033,226 |
| Bari | Apulia | 3,821 | 1,251,994 | 749,723 |
| Catania | Sicily | 3,574 | 1,107,702 | 658,805 |
| Florence | Tuscany | 3,514 | 1,011,349 | 807,896 |
| Bologna | Emilia-Romagna | 3,702 | 1,014,619 | 775,247 |
| Genoa | Liguria | 1,839 | 841,180 | 713,243 |
| Venice | Veneto | 2,462 | 853,338 | 561,697 |
| Messina | Sicily | 3,266 | 626,876 | 273,680 |
| Reggio Calabria | Calabria | 3,183 | 548,009 | 221,139 |
| Cagliari | Sardinia | 1,248 | 431,038 | 488,954 |
Vital statistics
| Average population | Live births | Deaths | Natural change | Crude birth rate (per 1,000) | Crude death rate (per 1,000) | Natural change (per 1,000) | Total Fertility Rates[fn 1][33][41] | |
|---|---|---|---|---|---|---|---|---|
| 1900 | 32,377,000 | 1,067,376 | 768,917 | 298,459 | 33.0 | 23.7 | 9.2 | 4.53 |
| 1901 | 32,550,000 | 1,057,763 | 715,036 | 342,727 | 32.5 | 22.0 | 10.5 | 4.49 |
| 1902 | 32,787,000 | 1,093,074 | 727,181 | 365,893 | 33.3 | 22.2 | 11.2 | 4.46 |
| 1903 | 33,004,000 | 1,042,090 | 736,311 | 305,779 | 31.6 | 22.3 | 9.3 | 4.43 |
| 1904 | 33,237,000 | 1,085,431 | 698,604 | 386,827 | 32.7 | 21.0 | 11.6 | 4.44 |
| 1905 | 33,489,000 | 1,084,518 | 730,340 | 354,178 | 32.4 | 21.8 | 10.6 | 4.45 |
| 1906 | 33,718,000 | 1,070,978 | 696,875 | 374,103 | 31.8 | 20.7 | 11.1 | 4.45 |
| 1907 | 33,952,000 | 1,062,333 | 700,333 | 362,000 | 31.3 | 20.6 | 10.7 | 4.46 |
| 1908 | 34,198,000 | 1,138,813 | 770,054 | 368,759 | 33.3 | 22.5 | 10.8 | 4.47 |
| 1909 | 34,455,000 | 1,115,831 | 738,460 | 377,371 | 32.4 | 21.4 | 11.0 | 4.43 |
| 1910 | 34,751,000 | 1,144,410 | 682,459 | 461,951 | 32.9 | 19.6 | 13.3 | 4.39 |
| 1911 | 35,033,000 | 1,093,545 | 742,811 | 350,734 | 31.2 | 21.2 | 10.0 | 4.36 |
| 1912 | 35,246,000 | 1,133,985 | 635,788 | 498,197 | 32.2 | 18.0 | 14.1 | 4.32 |
| 1913 | 35,351,000 | 1,122,482 | 663,966 | 458,516 | 31.8 | 18.8 | 13.0 | 4.28 |
| 1914 | 35,701,000 | 1,114,091 | 643,355 | 470,736 | 31.2 | 18.0 | 13.2 | 4.04 |
| 1915 | 36,271,000 | 1,109,183 | 809,703 | 299,480 | 30.6 | 22.3 | 8.3 | 3.80 |
| 1916 | 36,481,000 | 881,626 | 854,703 | 26,923 | 24.2 | 23.4 | 0.7 | 3.56 |
| 1917 | 36,343,000 | 691,207 | 948,710 | -257,503 | 19.6 | 26.1 | -7.1 | 3.32 |
| 1918 | 35,922,000 | 640,263 | 1,268,290 | -628,027 | 18.2 | 35.3 | -17.5 | 3.08 |
| 1919 | 35,717,000 | 770,620 | 676,329 | 94,291 | 21.6 | 18.9 | 2.6 | 3.24 |
| 1920 | 35,960,000 | 1,158,041 | 681,749 | 476,292 | 32.2 | 19.0 | 13.2 | 3.41 |
| 1921 | 37,869,000 | 1,118,344 | 670,234 | 448,110 | 30.7 | 17.7 | 13.0 | 3.57 |
| 1922 | 38,196,000 | 1,127,444 | 690,054 | 437,390 | 30.8 | 18.1 | 12.7 | 3.74 |
| 1923 | 38,571,000 | 1,107,505 | 654,827 | 452,678 | 29.9 | 17.0 | 11.7 | 3.90 |
| 1924 | 38,927,000 | 1,124,470 | 663,077 | 461,393 | 28.9 | 17.0 | 11.9 | 3.81 |
| 1925 | 39,265,000 | 1,109,761 | 669,695 | 440,066 | 28.2 | 17.1 | 11.2 | 3.72 |
| 1926 | 39,590,000 | 1,094,587 | 680,274 | 414,313 | 27.7 | 17.2 | 10.5 | 3.64 |
| 1927 | 39,926,000 | 1,093,772 | 639,843 | 453,929 | 27.4 | 16.0 | 11.4 | 3.55 |
| 1928 | 40,281,000 | 1,072,316 | 645,654 | 426,662 | 26.6 | 16.0 | 10.6 | 3.46 |
| 1929 | 40,607,000 | 1,037,700 | 667,223 | 370,477 | 25.6 | 16.4 | 9.1 | 3.42 |
| 1930 | 40,956,000 | 1,092,678 | 576,751 | 515,927 | 26.7 | 14.1 | 12.6 | 3.38 |
| 1931 | 41,339,000 | 1,026,197 | 609,405 | 416,792 | 24.8 | 14.7 | 10.1 | 3.21 |
| 1932 | 41,584,000 | 990,995 | 610,646 | 380,349 | 23.8 | 14.7 | 9.1 | 3.06 |
| 1933 | 41,928,000 | 995,979 | 574,113 | 421,866 | 23.8 | 13.7 | 10.1 | 3.04 |
| 1934 | 42,277,000 | 992,966 | 563,339 | 429,627 | 23.5 | 13.3 | 10.2 | 3.00 |
| 1935 | 42,631,000 | 996,708 | 594,722 | 401,986 | 23.4 | 14.0 | 9.4 | 2.98 |
| 1936 | 42,965,000 | 962,686 | 593,380 | 369,306 | 22.4 | 13.8 | 8.6 | 2.87 |
| 1937 | 43,269,000 | 991,867 | 618,290 | 373,577 | 22.9 | 14.3 | 8.6 | 2.93 |
| 1938 | 43,596,000 | 1,037,180 | 614,988 | 422,192 | 23.8 | 14.1 | 9.7 | 3.05 |
| 1939 | 44,018,000 | 1,040,213 | 591,483 | 448,730 | 23.6 | 13.4 | 10.2 | 3.07 |
| 1940 | 44,467,000 | 1,046,479 | 606,907 | 439,572 | 23.5 | 13.6 | 9.9 | 3.07 |
| 1941 | 44,830,000 | 937,546 | 621,735 | 315,811 | 20.9 | 13.9 | 7.0 | 2.74 |
| 1942 | 45,098,000 | 926,063 | 643,607 | 282,456 | 20.5 | 14.3 | 6.3 | 2.69 |
| 1943 | 44,641,000 | 882,105 | 679,708 | 202,397 | 19.8 | 15.2 | 4.5 | 2.61 |
| 1944 | 44,794,000 | 814,746 | 685,171 | 129,575 | 18.3 | 15.3 | 2.9 | 2.39 |
| 1945 | 44,946,000 | 815,678 | 615,092 | 200,586 | 18.2 | 13.7 | 4.5 | 2.37 |
| 1946 | 45,253,000 | 1,036,098 | 547,952 | 488,146 | 23.0 | 12.1 | 10.8 | 3.01 |
| 1947 | 45,641,000 | 1,011,490 | 524,019 | 487,471 | 22.2 | 11.5 | 10.8 | 2.89 |
| 1948 | 46,381,000 | 1,005,851 | 490,450 | 515,401 | 21.8 | 10.6 | 11.2 | 2.83 |
| 1949 | 46,733,000 | 937,146 | 485,277 | 451,869 | 20.1 | 10.4 | 9.7 | 2.62 |
| 1950 | 47,104,000 | 908,622 | 455,169 | 453,453 | 19.3 | 9.7 | 9.6 | 2.50 |
| 1951 | 47,417,000 | 860,998 | 485,208 | 375,790 | 18.2 | 10.2 | 7.9 | 2.35 |
| 1952 | 47,666,000 | 863,661 | 488,470 | 375,191 | 17.7 | 10.0 | 7.7 | 2.34 |
| 1953 | 47,957,000 | 860,345 | 484,527 | 375,818 | 17.5 | 9.9 | 7.6 | 2.31 |
| 1954 | 48,299,000 | 881,845 | 445,902 | 435,943 | 18.0 | 9.1 | 8.9 | 2.35 |
| 1955 | 48,633,000 | 879,130 | 449,058 | 430,072 | 17.9 | 9.2 | 8.7 | 2.33 |
| 1956 | 48,920,000 | 884,043 | 499,504 | 384,539 | 17.9 | 10.2 | 7.7 | 2.34 |
| 1957 | 49,181,000 | 885,812 | 483,558 | 402.254 | 17.9 | 9.8 | 8.0 | 2.33 |
| 1958 | 49,475,000 | 880,361 | 459,366 | 420,995 | 17.6 | 9.3 | 8.3 | 2.31 |
| 1959 | 49,831,000 | 910,628 | 454,547 | 456,081 | 18.1 | 9.1 | 9.0 | 2.38 |
| 1960 | 50,198,000 | 923,004 | 480,848 | 442,156 | 18.1 | 9.6 | 8.6 | 2.41 |
| 1961 | 50,523,000 | 924,203 | 460,009 | 464,194 | 18.4 | 9.3 | 9.1 | 2.41 |
| 1962 | 50,843,000 | 945,842 | 503,106 | 442,736 | 18.4 | 10.0 | 8.4 | 2.46 |
| 1963 | 51,198,000 | 978,143 | 514,000 | 464,143 | 18.8 | 10.1 | 8.7 | 2.56 |
| 1964 | 51,600,000 | 1,035,207 | 488,601 | 546,606 | 19.7 | 9.5 | 10.2 | 2.70 |
| 1965 | 51,987,000 | 1,017,944 | 516,922 | 501,022 | 19.1 | 10.0 | 9.1 | 2.66 |
| 1966 | 52,332,000 | 999,316 | 493,562 | 505,754 | 18.7 | 9.5 | 9.2 | 2.63 |
| 1967 | 52,667,000 | 962,197 | 507,845 | 454,352 | 18.0 | 9.7 | 8.3 | 2.54 |
| 1968 | 52,987,000 | 944,837 | 530,738 | 414,099 | 17.6 | 10.1 | 7.5 | 2.49 |
| 1969 | 53,317,000 | 949,155 | 530,348 | 418,807 | 17.5 | 10.1 | 7.4 | 2.51 |
| 1970 | 53,661,000 | 917,496 | 528,622 | 388,874 | 16.8 | 9.7 | 7.1 | 2.43 |
| 1971 | 54,074,000 | 911,084 | 515,318 | 395,766 | 16.8 | 9.7 | 7.1 | 2.41 |
| 1972 | 54,381,000 | 893,061 | 518,020 | 375,041 | 16.3 | 9.6 | 6.7 | 2.36 |
| 1973 | 54,751,000 | 887,953 | 544,461 | 343,492 | 16.0 | 10.0 | 6.0 | 2.34 |
| 1974 | 55,111,000 | 886,310 | 532,753 | 353,557 | 15.8 | 9.7 | 6.1 | 2.33 |
| 1975 | 55,441,000 | 841,858 | 556,019 | 285,839 | 14.9 | 10.0 | 4.9 | 2.21 |
| 1976 | 55,718,000 | 806,358 | 556,143 | 250,215 | 14.0 | 9.9 | 4.1 | 2.11 |
| 1977 | 55,955,000 | 757,281 | 547,011 | 210,270 | 13.2 | 9.8 | 3.5 | 1.97 |
| 1978 | 56,155,000 | 720,545 | 539,685 | 180,860 | 12.6 | 9.6 | 3.0 | 1.87 |
| 1979 | 56,318,000 | 682,742 | 541,825 | 140,917 | 11.9 | 9.6 | 2.3 | 1.76 |
| 1980 | 56,434,000 | 657,278 | 559,376 | 97,902 | 11.3 | 9.8 | 1.5 | 1.68 |
| 1981 | 56,502,000 | 628,113 | 540,764 | 87,349 | 11.0 | 9.7 | 1.4 | 1.60 |
| 1982 | 56,544,000 | 634,678 | 537,727 | 96,951 | 10.9 | 9.5 | 1.5 | 1.60 |
| 1983 | 56,564,000 | 612,936 | 563,807 | 49,129 | 10.6 | 10.0 | 0.7 | 1.54 |
| 1984 | 56,577,000 | 597,560 | 535,661 | 61,899 | 10.4 | 9.5 | 0.9 | 1.48 |
| 1985 | 56,593,000 | 589,233 | 549,529 | 39,704 | 10.2 | 9.7 | 0.5 | 1.45 |
| 1986 | 56,596,000 | 562,512 | 545,189 | 17,323 | 9.8 | 9.5 | 0.3 | 1.37 |
| 1987 | 56,602,000 | 560,265 | 534,993 | 25,272 | 9.7 | 9.3 | 0.5 | 1.35 |
| 1988 | 56,629,000 | 577,856 | 537,545 | 40,311 | 10.1 | 9.5 | 0.5 | 1.38 |
| 1989 | 56,672,000 | 567,268 | 531,557 | 35,711 | 9.9 | 9.4 | 0.5 | 1.35 |
| 1990 | 56,719,000 | 580,761 | 544,397 | 36,364 | 10.0 | 9.6 | 0.5 | 1.36 |
| 1991 | 56,751,000 | 556,175 | 547,131 | 9,044 | 9.9 | 9.8 | 0.2 | 1.33 |
| 1992 | 56,797,000 | 575,216 | 545,038 | 30,178 | 10.0 | 9.6 | 0.4 | 1.31 |
| 1993 | 56,832,000 | 552,587 | 555,043 | -2,456 | 9.7 | 9.7 | -0.1 | 1.26 |
| 1994 | 56,843,000 | 536,665 | 557,513 | -20,848 | 9.4 | 9.8 | -0.4 | 1.22 |
| 1995 | 56,844,000 | 526,064 | 555,203 | -29.139 | 9.2 | 9.8 | -0.5 | 1.19 |
| 1996 | 56,860,000 | 536,740 | 557,756 | -21,016 | 9.3 | 9.8 | -0.5 | 1.22 |
| 1997 | 56,890,000 | 540,048 | 564,679 | -24,631 | 9.4 | 9.9 | -0.5 | 1.23 |
| 1998 | 56,907,000 | 532,843 | 576,911 | -44,068 | 9.3 | 10.1 | -0.8 | 1.21 |
| 1999 | 56,917,000 | 537,242 | 571,356 | -34.114 | 9.4 | 10.0 | -0.5 | 1.23 |
| 2000 | 56,942,000 | 543,039 | 560,241 | -17,202 | 9.5 | 9.8 | -0.3 | 1.26 |
| 2001 | 56,960,000 | 535,282 | 548,254 | -12.972 | 9.4 | 9.8 | -0.4 | 1.25 |
| 2002 | 56,993,270 | 538,198 | 557,393 | -19,195 | 9.4 | 9.8 | -0.4 | 1.27 |
| 2003 | 57,186,378 | 544,063 | 586,468 | -42,405 | 9.5 | 10.3 | -0.7 | 1.29 |
| 2004 | 57,611,990 | 562,599 | 546,658 | 15,941 | 9.8 | 9.5 | 0.3 | 1.34 |
| 2005 | 58,044,368 | 554,022 | 567,304 | -13.282 | 9.5 | 9.8 | -0.2 | 1.34 |
| 2006 | 58,288,996 | 560,010 | 557,892 | 2,118 | 9.6 | 9.6 | 0.0 | 1.37 |
| 2007 | 58,510,725 | 563,933 | 570,801 | -6.868 | 9.6 | 9.8 | -0.2 | 1.40 |
| 2008 | 59,001,769 | 576,659 | 585,126 | -8,467 | 9.8 | 9.9 | -0.1 | 1.45 |
| 2009 | 59,420,592 | 568,857 | 591.663 | -22.806 | 9.6 | 9.8 | -0.3 | 1.45 |
| 2010 | 59,690,316 | 561,944 | 587.488 | -25.544 | 9.4 | 9.7 | -0.3 | 1.46 |
| 2011 | 59,948,497 | 546,585 | 593,402 | -46,817 | 9.1 | 9.9 | -0.8 | 1.44 |
| 2012 | 60,105,185 | 534,186 | 612,883 | -78,697 | 8.9 | 10.2 | -1.3 | 1.42 |
| 2013 | 60,277,309 | 514,308 | 600,744 | -86,436 | 8.5 | 10.0 | -1.4 | 1.39 |
| 2014 | 60,345,917 | 502,596 | 598,364 | -95,768 | 8.3 | 9.9 | -1.6 | 1.37 |
| 2015 | 60,295,497 | 485,780 | 647,571 | -161,791 | 8.1 | 10.7 | -2.7 | 1.35 |
| 2016 | 60,163,712 | 473,438 | 615,261 | -141,823 | 7.9 | 10.2 | -2.4 | 1.34 |
| 2017 | 60,066,734 | 458,151 | 649,061 | -190,910 | 7.6 | 10.8 | -3.2 | 1.32 |
| 2018 | 59,937,769 | 439,747 | 633,133 | -193,386 | 7.3 | 10.6 | -3.2 | 1.29 |
| 2019 | 59,816,673 | 420,084 | 634,417 | -214,333 | 7.0 | 10.6 | -3.6 | 1.27 |
| 2020 | 59,641,488 | 404,892 | 740,317 | -335,425 | 6.8 | 12.4 | -5.6 | 1.24 |
| 2021 | 59,257,566 | 399,431 | 709,035 | -309,604 | 6.7 | 11.9 | -5.2 | 1.25 |
| 2022 | 58,983,122 |
In the year 2020 88,345 babies were born to at least one foreign parent which makes up 21.8% of all newborns in that year (21,024 or 5.2% were born to foreign mothers, 7,529 or 1.9% to foreign fathers and 59,792 or 14.8% to two foreign parents.[42]
Current vital statistics
| Period | Live births | Deaths | Natural increase |
|---|---|---|---|
| January - July 2021 | 221,910 | 426,551 | −204,641 |
| January - July 2022 | 217,147 | 421,279 | −204,132 |
| Difference |
Health
Obesity – adult prevalence rate
- 19.9% (2016) Country comparison to the world: 108
Employment and income
Unemployment, youth ages 15–24:
- total: 32.2%. Country comparison to the world: 26th
- male: 30.4%
- female: 34.8% (2018 est.)
Immigration
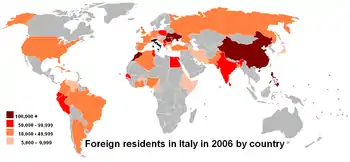
Since the fall of the Berlin Wall in 1989, and more recently, the 2004 and 2007 enlargements of the European Union, Italy received growing flows of migrants from the former socialist countries of Eastern Europe (especially Romania, Albania, Ukraine and Poland).[44] The second most important area of immigration to Italy has always been the neighboring North Africa (especially Morocco, Egypt, Tunisia and Algeria).[45] Furthermore, in recent years, growing migration fluxes from the Far East (notably, China[46] and the Philippines) and Latin America (Ecuador, Peru) have been recorded.
Italy does not collect data on ethnicity or race of the country, but does collect data on nationality of its residents.[47]
In 2020, Istat estimated that 5,039,637 foreign citizens lived in Italy, representing about 8.4% of the total population.[26] These figures do not include naturalized foreign-born residents (about 100,000 foreigners acquired Italian citizenship in 2020) as well as illegal immigrants, the so-called clandestini, whose numbers, difficult to determine, are thought to be at least 670,000.[48] Romanians made up the largest community in the country (1,145,718; around 10% of them being ethnic Romani people[49]), followed by Albanians (441,027) and Moroccans (422,980).[50][51]
The fourth largest, but the fastest growing, community of foreign residents in Italy was represented by the Chinese.[52] The majority of Chinese living in Italy are from the city of Wenzhou in the province of Zhejiang.[53] Breaking down the foreign-born population by continent, in 2020 the figures were as follows: Europe (54%), Africa (22%), Asia (16%), the Americas (8%) and Oceania (0.06%). The distribution of immigrants is largely uneven in Italy: 83% of immigrants live in the northern and central parts of the country (the most economically developed areas), while only 17% live in the southern half of the peninsula.[54]
- Net migration rate
- 3.21 migrant(s)/1,000 population (2021 est.) Country comparison to the world: 34th
| Nationality groups | Year | |||||||||||
|---|---|---|---|---|---|---|---|---|---|---|---|---|
| 2002[55] | 2005[55] | 2010[55] | 2015[55] | 2019[56] | 2021[57] | |||||||
| Number | % | Number | % | Number | % | Number | % | Number | % | Number | % | |
| 55,651,856 | 97.64% | 55,775,350 | 96.09% | 55,853,967 | 93.57% | 55,460,252 | 91.98% | 54,820,515 | 91.65% | 54,064,319 | 91.27% | |
| Foreigners | 1,341,414 | 2.36% | 2,269,018 | 3.91% | 3,836,349 | 6.43% | 4,835,245 | 8.02% | 4,996,158 | 8.35% | 5,171,894 | 8.73% |
| – | – | – | – | – | – | – | – | 1,472,847 | 2.46% | 1,406,623 | 2.37% | |
| Other European | – | – | – | – | – | – | – | – | 1,036,761 | 2.73% | 1,053,765 | 1.78% |
| Northern Africa | – | – | – | – | – | – | – | – | 639,994 | 1.07% | 689,649 | 1.16% |
| Central and South Asia | – | – | – | – | – | – | – | – | 528,182 | 0.88% | 605,000 | 1.02% |
| Eastern Asia | – | – | – | – | – | – | – | – | 464,557 | 0.78% | 521,686 | 0.88% |
| Western Africa | – | – | – | – | – | – | – | – | 389,602 | 0.65% | 400,112 | 0.68% |
| Central and South America | – | – | – | – | – | – | – | – | 345,466 | 0.58% | 366,062 | 0.62% |
| Western Asia | – | – | – | – | – | – | – | – | 36,914 | – | 44,272 | – |
| Eastern Africa | – | – | – | – | – | – | – | – | 37,131 | – | 35,486 | – |
| Central and South Africa | – | – | – | – | – | – | – | – | 24,919 | – | 25,343 | – |
| Northern America | – | – | – | – | – | – | – | – | 17,082 | – | 21,216 | – |
| Oceania | – | – | – | – | – | – | – | – | 2,120 | – | 2,248 | – |
| Stateless | – | – | – | – | – | – | – | – | 583 | – | 432 | – |
| Total | 56,993,270 | 100% | 58,044,368 | 100% | 59,690,316 | 100% | 60,295,497 | 100% | 59,816,673 | 100% | 59,236,213 | 100% |
| Year | Population |
|---|---|
| 2002 | 1,341,209[58] |
| 2003 | 1,464,663[58] |
| 2004 | 1,854,748[58] |
| 2005 | 2,210,478[58] |
| 2006 | 2,419,483[58] |
| 2007 | 2,592,950[58] |
| 2008 | 3,023,317[58] |
| 2009 | 3,402,435[58] |
| 2010 | 3,648,128[58] |
| 2011 | 3,879,224[58] |
| 2012 | 4,052,081[59] |
| 2013 | 4,387,721[60] |
| 2014 | 4,922,085[61] |
| 2015 | 5,014,437[62] |
| 2016 | 5,026,153[63] |
| 2017 | 5,047,028[64] |
| 2018 | 5,144,440[65] |
| 2019 | 5,255,503[66] |
| 2020 | 5,013,215[67] |
| 2021 | 5,171,894 (8.7%)[68] |
There are, as of 2021, 6,262,207 Foreign-born residents, accounting for 10.6% of the total population.
Their distribution by country of origin was as follows:[69]
| Country | Population |
|---|---|
| 913,159 | |
| 505,323 | |
| 462,784 | |
| 457,002 | |
| 259,091 | |
| 198,273 | |
| 188,924 | |
| 187,335 | |
| 172,033 | |
| 148,981 | |
| 146,702 | |
| 137,335 | |
| 134,974 | |
| 128,876 | |
| 122,831 | |
| 117,292 | |
| 116,115 | |
| 108,831 | |
| 100,377 | |
| 97,241 | |
| 94,917 | |
| 79,407 | |
| 69,418 | |
| 66,705 | |
| 60,863 | |
| 53,693 | |
| 52,030 | |
| 50,892 | |
| 48,970 | |
| 48,084 | |
| 44,202 | |
| 44,077 | |
| 42,307 | |
| 41,314 | |
| 38,560 | |
| 33,679 | |
| 32,257 | |
| Other countries | 657,353 |
Languages
Italy's official language is Italian; Ethnologue has estimated that there are about 55 million speakers of Italian in the country and a further 6.7 million outside of it, primarily in the neighboring countries and in the Italian diaspora worldwide.[70] Italian, adopted by the central state after the unification of Italy, is a language based on the Florentine variety of Tuscan and is somewhat intermediate between the Italo-Dalmatian languages and the Gallo-Romance languages. Its development was also influenced by the Germanic languages of the post-Roman invaders. When Italy unified in 1861, only 3% of the population spoke Italian,[71] even though an estimated 90% of Italians speak Italian as their L1 nowadays.[72]
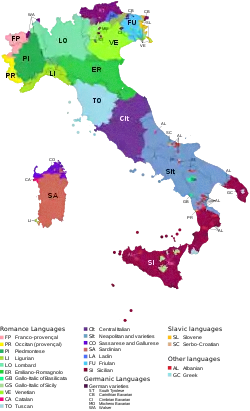
Italy is in fact one of the most linguistically diverse countries in Europe,[73] as there are not only varieties of Italian specific to each cultural region, but also distinct regional and minority languages. The establishment of the national education system has led to the emergence of the former and a decrease in the use of the latter. The spread of Italian was further expanded in the 1950s and 1960s, because of the economic growth and the rise of mass media and television, with the state broadcaster (RAI) setting a colloquial variety of Italian to which the population would be exposed.
As a way to distance itself from the Italianization policies promoted because of nationalism, Italy recognized twelve languages as the Country's "historical linguistic minorities",[74] which are promoted alongside Italian in their respective territories. French is co-official in the Aosta Valley as the province's prestige variety, under which the more commonly spoken Franco-Provencal dialects have been historically roofed.[75] German has the same status in the province of South Tyrol as, in some parts of that province and in parts of the neighbouring Trentino, does Ladin.[76] Slovene[77] and Friulian are officially recognised in the provinces of Trieste, Gorizia and Udine in Venezia Giulia. In Sardinia, the Sardinian language has been the language traditionally spoken and is often regarded by linguists as constituting its own branch of Romance;[78] in the 1990s, Sardinian has been recognized as "having equal dignity" with Italian,[79] the introduction of which to the island officially started under the rule of the House of Savoy in the 18th century.
In these regions, official documents are either bilingual (trilingual in Ladin communities) in the co-official language(s) by default, or available as such upon request. Traffic signs are also multilingual, except in the Valle d’Aosta where French toponyms are generally used, with the exception of Aosta itself, which has retained its Latin form in Italian as well as English. Attempts to Italianize them, especially during the Fascist period, have been formally abandoned. Education is possible in minority languages where such schools are operating.
UNESCO and other authorities recognize a number of other languages which are not legally protected by Italian government: Piedmontese, Venetian, Ligurian, Lombard, Emilian-Romagnolo, Neapolitan and Sicilian.
Religion
Religion in Italy according to the Eurobarometer survey, 2021[80]
Roman Catholicism is by far the largest religion in the country, although the Catholic Church is no longer officially the state religion. In 2006, 87.8% of Italy's population self-identified as Roman Catholic,[81] although only about one-third of these described themselves as active members (36.8%). In 2016, 71.1% of Italian citizens self-identified as Roman Catholic.[82] This increased again to 78% in 2018.[7]
Most Italians believe in God, or a form of a spiritual life force. According to a Eurobarometer Poll in 2005:[83] 74% of Italian citizens responded that 'they believe there is a God', 16% answered that 'they believe there is some sort of spirit or life force' and 6% answered that 'they do not believe there is any sort of spirit, God, or life force'. There are no data collected through census.
Christianity
The Italian Catholic Church is part of the global Roman Catholic Church, under the leadership of the Pope, curia in Rome, and the Conference of Italian Bishops. In addition to Italy, two other sovereign nations are included in Italian-based dioceses, San Marino and Vatican City. There are 225 dioceses in the Italian Catholic Church, see further in this article and in the article List of the Roman Catholic dioceses in Italy. Even though by law Vatican City is not part of Italy, it is in Rome, and along with Latin, Italian is the most spoken and second language of the Roman Curia.[84]
Italy has a rich Catholic culture, especially as numerous Catholic saints, martyrs and popes were Italian themselves. Roman Catholic art in Italy especially flourished during the Middle Ages, Renaissance and Baroque periods, with numerous Italian artists, such as Michelangelo, Leonardo da Vinci, Raphael, Caravaggio, Fra Angelico, Gian Lorenzo Bernini, Sandro Botticelli, Tintoretto, Titian and Giotto. Roman Catholic architecture in Italy is equally as rich and impressive, with churches, basilicas and cathedrals such as St Peter's Basilica, Florence Cathedral and St Mark's Basilica. Roman Catholicism is the largest religion and denomination in Italy, with around 71.1% of Italians considering themselves Catholic. Italy is also home to the greatest number of cardinals in the world,[85] and is the country with the greatest number of Roman Catholic churches per capita.[86]

Even though the main Christian denomination in Italy is Roman Catholicism, there are some minorities of Protestant, Waldensian, Eastern Orthodox and other Christian churches.
Immigration from Western, Central, and Eastern Africa at the beginning of the 21st century has increased the size of Baptist, Anglican, Pentecostal and Evangelical communities in Italy, while immigration from Eastern Europe has produced large Eastern Orthodox communities.
In 2006, Protestants made up 2.1% of Italy's population, and members of Eastern Orthodox churches comprised 1.2% or more than 700,000 Eastern Orthodox Christians including 180,000 Greek Orthodox,[89] 550,000 Pentecostals and Evangelists (0.8%), of whom 400,000 are members of the Assemblies of God, about 250,000 are Jehovah's Witnesses (0.4%),[90] 30,000 Waldensians,[91] 25,000 Seventh-day Adventists, 22,000 Mormons, 15,000 Baptists (plus some 5,000 Free Baptists), 7,000 Lutherans, 4,000 Methodists (affiliated with the Waldensian Church).[92]
Other religions
The longest-established religious faith in Italy is Judaism, Jews having been present in Ancient Rome before the birth of Christ. Italy has seen many influential Italian-Jews, such as prime minister Luigi Luzzatti, who took office in 1910, Ernesto Nathan served as mayor of Rome from 1907 to 1913 and Shabbethai Donnolo (died 982). During the Holocaust, Italy took in many Jewish refugees from Nazi Germany. However, with the creation of the Nazi-backed puppet Italian Social Republic, about 15% of 48,000 Italian Jews were killed. This, together with the emigration that preceded and followed the Second World War, has left only a small community of around 45,000 Jews in Italy today.
Due to immigration from around the world, there has been an increase in non-Christian religions. As of 2009, there were 1.0 million Muslims in Italy[93] forming 1.6 percent of population; independent estimates put the Islamic population in Italy anywhere from 0.8 million[94] to 1.5 million.[95] Only 50,000 Italian Muslims hold Italian citizenship.
There are more than 200,000 followers of faith originating in the Indian subcontinent, including some 70,000 Sikhs with 22 gurdwaras across the country,[96] 70,000 Hindus, and 50,000 Buddhists.[97] There are an estimated some 4,900 Bahá'ís in Italy in 2005.[98]
Education
Literacy
- definition: age 15 and over can read and write
- total population: 99.2%
- male: 99.4%
- female: 99% (2018 est.)
School life expectancy (primary to tertiary education)
- total: 16 years
- male: 16 years
- female: 17 years (2018)
Genetics and ethnic groups

The genetic history of Italy is greatly influenced by geography and history. The ancestors of Italians are mostly Indo-European speakers (Italic peoples such as Latins, Umbrians, Samnites, Oscans, Sicels and Adriatic Veneti, as well as Celts, Iapygians and Greeks) and pre-Indo-European speakers (Etruscans, Ligures, Rhaetians and Camunni in mainland Italy, Sicani and Elymians in Sicily and the Nuragic people in Sardinia). During the imperial period of Ancient Rome, the city of Rome was also home to people from various regions throughout the Mediterranean basin, including Southern Europe, North Africa and the Middle East.[100] Based on DNA analysis, there is evidence of ancient regional genetic substructure and continuity within modern Italy dating to the pre-Roman and Roman periods.[101][102][103][104]
Within the Italian population, there is enough cultural, linguistic, genetic and historical diversity for them to constitute several distinct groups throughout the peninsula.[105] In this regard, peoples like the Friulians, the Ladins, the Sardinians and the South Tyroleans, who also happen to constitute recognized linguistic minorities, or even the Sicilians who are not, are cases in point, attesting to such internal diversity.
See also
- List of Italians
- Italian diaspora
- Italian Americans
- Italian Brazilians
- Italian Argentines
- Italian Venezuelans
- Romani people in Italy
Footnotes
- In fertility rates, 2.1 and above is a stable population and has been marked blue, 2 and below leads to an aging population and the result is that the population decreases.
- The figures for 2002–2011 have been revised downwards as a result of the 15th General Census of Italy which offered more precise data. The figures since 2012 are calculated adding to the foreign population enumerated by the census the foreign population inflows and outflows recorded in all Italian municipalities during each calendar year.
References
- "ISTAT – Demography, Statistics, Demographic Balance, Resident Population". demo.istat.it. Archived from the original on 2 May 2021. Retrieved 30 November 2021.
- "La mortalità in Italia sotto i 5 anni: aggiornamento dei dati per causa, territorio e cittadinanza". Istat.it. Istat. 18 October 2018. Retrieved 15 May 2021.
- https://www.istat.it/storage/rapporto-annuale/2019/capitolo3.pdf
- EUROSTAT. "Ageing characterises the demographic perspectives of the European societies – Issue number 72/2008" (PDF). Archived from the original (PDF) on 2 January 2009. Retrieved 28 April 2009.
- ISTAT. "Crude birth rates, mortality rates and marriage rates 2005–2008" (PDF) (in Italian). Archived from the original (PDF) on 10 August 2011. Retrieved 10 May 2009.
- ISTAT. "Average number of children born per woman 2005–2008" (PDF) (in Italian). Archived from the original (PDF) on 10 August 2011. Retrieved 3 May 2009.
- "Being Christian in Western Europe" (PDF). Pew Research Center. 2018. p. 22. Archived from the original (PDF) on 2 August 2019. Retrieved 5 January 2020.
- "Causes of the Italian mass emigration". ThinkQuest Library. 15 August 1999. Archived from the original on 10 October 2010. Retrieved 30 October 2010.
- Consulta Nazionale Emigrazione. Progetto ITENETs – “Gli italiani in Brasile”; pp. 11, 19 Archived 12 February 2012 at the Wayback Machine . Retrieved 10 September 2008.
- Lee, Adam (3 April 2006). "Unos 20 millones de personas que viven en la Argentina tienen algún grado de descendencia italiana" (in Spanish). Retrieved 27 June 2008.
- American FactFinder, United States Census Bureau. "U.S Census Bureau – Selected Population Profile in the United States". American FactFinder, United States Census Bureau. Archived from the original on 12 February 2020. Retrieved 30 May 2011.
- "The Cambridge survey of world migration". Robin Cohen (1995). Cambridge University Press. p. 143. ISBN 0-521-44405-5
- ""Hay condiciones para celebrar comicios transparentes el 7-O": Embajador de Italia en Caracas asegura que el sistema electoral venezolano es confiable". Correo del Orinoco (in Spanish). 17 July 2012.
...el diplomático calcula que 5% o 6% de la población venezolana actual tiene origen italiano.
- Santander Laya-Garrido, Alfonso. Los Italianos forjadores de la nacionalidad y del desarrollo economico en Venezuela. Editorial Vadell. Valencia, 1978
- "Ethnic origins, 2006 counts, for Uruguay, provinces and territories – 20% sample data".
- "Ethnic origins, 2006 counts, for Canada, provinces and territories – 20% sample data". Archived from the original on 23 July 2013. Retrieved 14 April 2011.
- "20680-Ancestry by Country of Birth of Parents – Time Series Statistics (2001, 2006 Census Years) – Australia". Australian Bureau of Statistics. 27 June 2007. Archived from the original on 1 October 2007. Retrieved 30 December 2008.
- "Essay on Italian emigration to Eritrea (in Italian)" (PDF). Retrieved 30 October 2010.
- Libya – Italian colonization. Britannica Online Encyclopedia.
- Thammy Evans & Rudolf Abraham (2013). Istria. p. 11. ISBN 9781841624457.
- James M. Markham (6 June 1987). "Election Opens Old Wounds in Trieste". The New York Times. Retrieved 9 June 2016.
- Libya cuts ties to mark Italy era.. BBC News. 27 October 2005.
- Bonifazi, Corrado; Heins, Frank; Strozza, Salvatore; Vitiello, Mattia. "Italy: The Italian transition from an emigration to immigration country". ResearchGate.net. Idea Working Papers. Retrieved 17 May 2021.
- "La popolazione straniera residente in Italia nel 2014" (in Italian). National Institute of Statistics (Italy). 12 February 2015. Retrieved 24 April 2015.
- Caponio, Tiziana; Cappiali, Teresa. "Italian Migration Policies in Times of Crisis: The Policy Gap Reconsidered" (PDF). European University Institute. Retrieved 17 May 2021.
- "Indicatori demografici, anno 2020" (PDF). Retrieved 3 May 2021.
- "Italy Population 2019", World Population Review
- "L'Italia in 150 anni. Sommario di statistiche storiche 1861–2010" (PDF). Istat. Retrieved 17 May 2021.
- "15° Censimento generale della popolazione e delle abitazioni" (PDF). Istat. Retrieved 17 May 2021.
- Note: Crude migration change (per 1000) is a trend analysis, an extrapolation based average population change (current year minus previous) minus natural change of the current year (see table vital statistics). As average population is an estimate of the population in the middle of the year and not end of the year.
- "Life expectancy". Our World in Data. Retrieved 28 August 2018.
- "World Population Prospects – Population Division – United Nations". Archived from the original on 19 September 2016. Retrieved 15 July 2017.
- Max Roser (2014), "Total Fertility Rate around the world over the last centuries", Our World in Data, Gapminder Foundation, archived from the original on 7 August 2018, retrieved 7 August 2018
- "The World Factbook – Central Intelligence Agency". cia.gov. Archived from the original on 22 January 2019. Retrieved 19 December 2011.
- OECD. "Competitive Cities in the Global Economy" (PDF). Archived from the original (PDF) on 1 October 2008. Retrieved 30 April 2009.
- Roberto, Vincenzo Patruno, Marina Venturi, Silvestro. "Demo-Geodemo. – Mappe, Popolazione, Statistiche Demografiche dell'ISTAT". demo.istat.it. Archived from the original on 9 July 2011.
- "Population on 1 January by age groups and sex – functional urban areas". Eurostat. Archived from the original on 3 September 2015. Retrieved 3 November 2017.
- B.R. Mitchell. European historical statistics, 1750–1975.
- http://unstats.un.org/unsd/demographic/products/dyb/dybsets/1948%20DYB.pdf United nations. Demographic Yearbook 1952
- Roberto, Vincenzo Patruno, Marina Venturi, Silvestro. "Demo-Geodemo. – Mappe, Popolazione, Statistiche Demografiche dell'ISTAT". demo.istat.it.
- "The World FactBook – Italy", The World Factbook, 3 February 2021
- "Demo-Geodemo. – Mappe, Popolazione, Statistiche Demografiche dell'ISTAT". Archived from the original on 27 January 2021.
- "Demographic Balance".
- "Emigration and Its Economic Impact on Eastern Europe" (PDF). International Monetary Fund. Retrieved 17 May 2021.
- "Migration from the Middle East and North Africa to Europe" (PDF). Amsterdam University Press. Retrieved 17 May 2021.
- "Chinese immigration into the Eu: new trends, dynamics and implications" (PDF). The Europe China Research and Advice Network (ECRAN). Retrieved 17 May 2021.
- Shendruk, Amanda (8 July 2021). "Are you even trying to stop racism if you don't collect data on race?". Quartz. Retrieved 4 July 2022.
- Elisabeth Rosenthal, "Italy cracks down on illegal immigration". The Boston Globe. 16 May 2008.
- "EUROPE: Home to Roma, And No Place for Them". IPS ipsnews.net. Archived 5 March 2012 at the Wayback Machine
- "Cittadini stranieri. Popolazione residente e bilancio demografico". istat.it (in Italian). istat. 31 December 2018. Retrieved 24 January 2019.
- Lanni, Alessandro (27 December 2015). "From Morocco to Romania: how immigration to Italy has changed over 10 years". Open Migration. Retrieved 10 March 2016.
- "Società Stranieri in Italia, 5,2 milioni i residenti regolari. Romania e Cina le provenienze con i maggiori incrementi negli ultimi 8 anni". Il Fatto Quotidiano. 20 September 2019. Retrieved 15 May 2021.
- Chang, Angela (24 February 2012). "20th Century Chinese Migration to Italy: The Chinese Diaspora Presence within European International Migration". ResearchGate. Retrieved 11 March 2015.
- "I numeri degli stranieri residenti in Italia". Youtrend.it. 9 December 2020. Retrieved 15 May 2021.
- "Estimated resident population – Years 2002–2019". dati.istat.it. Retrieved 22 December 2021.
- "Resident foreigners on 1st January – Citizenship : Italy, regions, provinces – Area of citizenship". dati.istat.it.
- "Resident foreigners on 1st January – Citizenship : Italy, regions, provinces – Area of citizenship". dati.istat.it. Archived from the original on 28 January 2022.
- "Ricostruzione della popolazione residente per età, sesso e cittadinanza nei comuni". ISTAT. 26 September 2013. p. 9.
- Statistics for 2011 at istat.it Accessed 30 October 2017
- Statistics for 2013 at istat.it Archived 31 March 2017 at the Wayback Machine Accessed 30 October 2017
- Statistics for 2013 at istat.it Archived 30 July 2015 at the Wayback Machine Accessed 30 October 2017
- "Cittadini Stranieri. Popolazione residente e bilancio demografico al 31 dicembre 2014". ISTAT. 15 June 2015. Archived from the original on 26 October 2019. Retrieved 19 May 2021.
- Statistics for 2015 at istat.it Archived 13 June 2016 at the Wayback Machine Accessed 30 October 2017
- Statistics for 2017 at istat.it Archived 7 July 2017 at the Wayback Machine Accessed 4 April 2018
- "Statistiche demografiche ISTAT". Archived from the original on 6 August 2017. Retrieved 18 April 2019.
- "5.255.503 cittadini stranieri in Italia". aise.it (in Italian). 24 October 2019. Retrieved 15 March 2020.
- "Statistics for 2020 at istat.it".
- "Population by citizenship".
- "Population by country of birth". Eurostat.
- Ethnologue report for language code:ita (Italy) – Gordon, Raymond G., Jr. (ed.), 2005. Ethnologue: Languages of the World, Fifteenth edition. Dallas, Tex.: SIL International. Online version
- "Italian".
- "L'uso della lingua italiana, dei dialetti e di altre lingue in Italia". Istat. 9 March 2018.
- «Italy holds especial treasures for linguists. There is probably no other area of Europe in which such a profusion of linguistic variation is concentrated into so small a geographical area». Martin Maiden, M. Mair Parry (1997), The Dialects of Italy, Psychology Press, p. 1
- Norme in materia di tutela delle minoranze linguistiche storiche, Italian parliament, retrieved 17 October 2015
- L.cost. 26 febbraio 1948, n. 4, Statuto speciale per la Valle d'Aosta
- L.cost. 26 febbraio 1948, n. 5, Statuto speciale per il Trentino-Alto Adige
- L.cost. 31 gennaio 1963, n. 1, Statuto speciale della Regione Friuli Venezia Giulia
- Martin Maiden, M. Mair Parry (1997), The Dialects of Italy, Psychology Press, p. 2
- "Legge Regionale 15 ottobre 1997, n. 26-Regione Autonoma della Sardegna".
- "Special Eurobarometer 516". European Union: European Commission. September 2021. Retrieved 24 September 2021 – via European Data Portal (see Volume C: Country/socio-demographics: IT: Question D90.2.).
- "Italy: 88% of Italy's population declare themselves Catholic" (in Italian). Corriere della Sera. 18 January 2006. Retrieved 10 May 2009.
- "Rapporto Italia 2016. La sindrome del Palio" (in Italian). 28 January 2016. Retrieved 10 November 2018.
- ReportDGResearchSocialValuesEN2.PDF Archived 24 May 2006 at the Wayback Machine
- "Country profile: Vatican". BBC News. 26 October 2009. Retrieved 5 May 2010.
- Miranda, Salvador. "Living cardinals arranged by country". The Cardinals of the Holy Roman Church. Florida International University. OCLC 53276621.
- "Italy – Italian Language, Culture, Customs and Business Etiquette". Kwintessential.co.uk. Archived from the original on 12 August 2010. Retrieved 2 August 2010.
- "The Duomo of Florence | Tripleman". tripleman.com. Archived from the original on 6 December 2009. Retrieved 25 March 2010.
- "brunelleschi's dome – Brunelleschi's Dome". Brunelleschisdome.com. Retrieved 25 March 2010.
- The Holy Orthodox Archdiocese of Italy and Malta Archived 5 March 2009 at the Wayback Machine
- 2015 Yearbook of Jehovah's Witnesses. Watch Tower Society. p. 182.
- (in Italian) Waldensian Evangelical Church Archived 11 February 2006 at the Wayback Machine
- World Council of Churches Archived 25 March 2013 at the Wayback Machine
- "Italy: Country's muslims raise funds to help quake victims – Adnkronos Religion". adnkronos.com.
- "Muslims in Europe: Country guide". BBC News. 23 December 2005. Retrieved 5 May 2010.
- Rosenthal, Elisabeth (25 July 2005). "Pressure is growingon Muslims in Italy". The New York Times. Retrieved 31 March 2010.
- "NRI Sikhs in Italy". nriinternet.com.
- Unione Buddhista Italiana – UBI: L'Ente Archived 4 April 2007 at the Wayback Machine
- "Most Baha'i Nations (2005)". QuickLists > Compare Nations > Religions >. The Association of Religion Data Archives. 2005. Archived from the original on 14 April 2010. Retrieved 30 January 2010.
- Parolo, Silvia; Lisa, Antonella; Gentilini, Davide; Di Blasio, Anna Maria; Barlera, Simona; Nicolis, Enrico B.; Boncoraglio, Giorgio B.; Parati, Eugenio A.; Bione, Silvia (2015). "Characterization of the biological processes shaping the genetic structure of the Italian population". BMC Genetics. 16: 132. doi:10.1186/s12863-015-0293-x. PMC 4640365. PMID 26553317. S2CID 17969623.
- Antonio ML, Gao Z, Moots HM, Lucci M, Candilio F, Sawyer S, et al. (November 2019). "Ancient Rome: A genetic crossroads of Europe and the Mediterranean". Science. American Association for the Advancement of Science (published 8 November 2019). 366 (6466): 708–714. Bibcode:2019Sci...366..708A. doi:10.1126/science.aay6826. hdl:2318/1715466. PMC 7093155. PMID 31699931.
Interestingly, although Iron Age individuals were sampled from both Etruscan (n=3) and Latin (n=6) contexts, we did not detect any significant differences between the two groups with f4 statistics in the form of f4(RMPR_Etruscan, RMPR_Latin; test population, Onge), suggesting shared origins or extensive genetic exchange between them. ... In the Medieval and early modern periods (n = 28 individuals), we observe an ancestry shift toward central and northern Europe in PCA (Fig. 3E), as well as a further increase in the European cluster (C7) and loss of the Near Eastern and eastern Mediterranean clusters (C4 and C5) in ChromoPainter (Fig. 4C). The Medieval population is roughly centered on modern-day central Italians (Fig. 3F). It can be modeled as a two-way combination of Rome's Late Antique population and a European donor population, with potential sources including many ancient and modern populations in central and northern Europe: Lombards from Hungary, Saxons from England, and Vikings from Sweden, among others (table S26).
- Ralph P, Coop G (2013). "The geography of recent genetic ancestry across Europe". PLOS Biology. 11 (5): e1001555. doi:10.1371/journal.pbio.1001555. PMC 3646727. PMID 23667324.
- Raveane A, Aneli S, Montinaro F, Athanasiadis G, Barlera S, Birolo G, et al. (September 2019). "Population structure of modern-day Italians reveals patterns of ancient and archaic ancestries in Southern Europe". Science Advances. 5 (9): eaaw3492. Bibcode:2019SciA....5.3492R. doi:10.1126/sciadv.aaw3492. PMC 6726452. PMID 31517044.
- Capocasa M, Anagnostou P, Bachis V, Battaggia C, Bertoncini S, Biondi G, et al. (2014). "Linguistic, geographic and genetic isolation: a collaborative study of Italian populations". Journal of Anthropological Sciences. 92 (92): 201–31. doi:10.4436/JASS.92001. PMID 24607994.
- Modi A, Lancioni H, Cardinali I, Capodiferro MR, Rambaldi Migliore N, Hussein A, et al. (July 2020). "The mitogenome portrait of Umbria in Central Italy as depicted by contemporary inhabitants and pre-Roman remains". Scientific Reports. 10 (1): 10700. Bibcode:2020NatSR..1010700M. doi:10.1038/s41598-020-67445-0. PMC 7329865. PMID 32612271.
- «It should be noted, then, that the Italians, though often described as a homogeneous people, are divided into several culturally, socially, and politically diverse groups throughout the peninsula.» Jeffrey Cole (edited by), Ethnic Groups of Europe: An Encyclopedia, Santa Barbara (California), ABC-CLIO, 2011, p.204
External links
- Demographic page Archived 22 June 2017 at the Wayback Machine
- Demographic Profile Italy Allianz Knowledge
| Historical minority communities |
| |
|---|---|---|
| Ethno-linguistic minorities | ||
| Scattered minorities |
| |
Italy articles | |||||||||||||
|---|---|---|---|---|---|---|---|---|---|---|---|---|---|
| History |
| ||||||||||||
| Geography | |||||||||||||
| Politics |
| ||||||||||||
| Economy |
| ||||||||||||
| Society |
| ||||||||||||
| |||||||||||||