Excel 2013
Groups and Subtotals
Introduction
Worksheets with a lot of content can sometimes feel overwhelming and even become difficult to read. Fortunately, Excel can organize data in groups, allowing you to easily show and hide different sections of your worksheet. You can also summarize different groups using the Subtotal command and create an outline for your worksheet.
Optional: Download our Lesson 20 Practice Workbook.
To group rows or columns:
- Select the rows or columns you wish to group. In this example, we'll select columns A, B, and C.
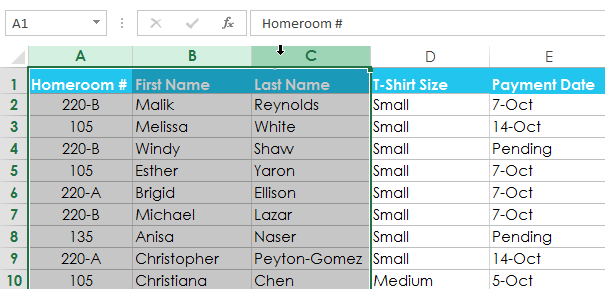 Selecting columns to group
 - Select the Data tab on the Ribbon, then click the Group command.
 Clicking the Group command
 - The selected rows or columns will be grouped. In our example, columns A, B, and C are grouped together.
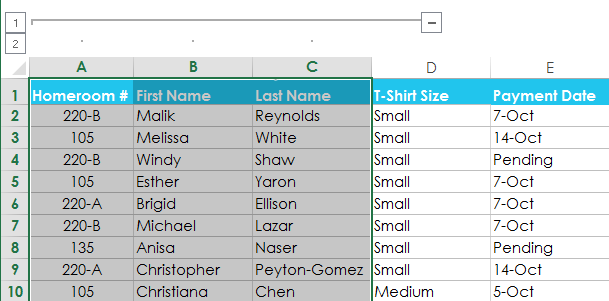 The grouped columns
To ungroup data, select the grouped rows or columns, then click the Ungroup command.
 Clicking the Ungroup command
To hide and show groups:
- To hide a group, click the Hide Detail button
 .
.
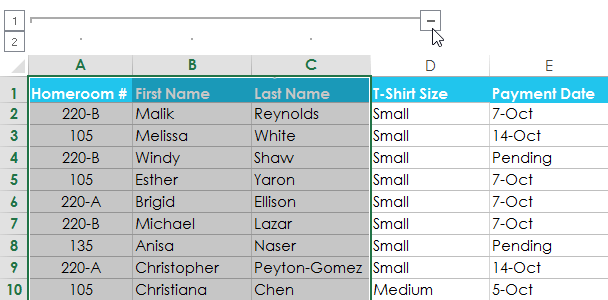 Hiding a group
 - The group will be hidden. To show a hidden group, click the Show Detail button
 .
.
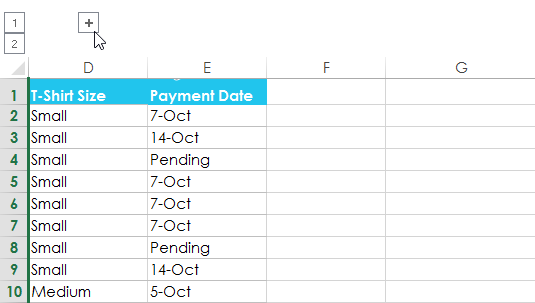 Clicking the Show Detail button to show the hidden group


