Economic Growth
Economic growth is defined as the increase in the market value of the goods and services produced by an economy over time. It is measured as the percentage rate of increase in the real gross domestic product (GDP). To determine economic growth, the GDP is compared to the population, also know as the per capita income. When the per capita income increases it is called intensive growth . When the GDP growth is only cause by an increase in population or territory it is called extensive growth.

U.S. GDP per capita (1929-2010)
This graph shows the GDP per capita in the United States from 1929 to 2010. The GDP per capita is the ratio of the GDP to the population. This graph shows the intensive growth of the United States during this time period.
U.S. Economy
The economy in the United States is the world's largest single national economy. In 2013, the estimated GDP was $16.6 trillion, which is a quarter of the nominal global GDP. Currently, the U.S. has a mixed economy, a stable GDP growth rate, moderate unemployment, and high levels of research and capital investment.
U.S. Economic Growth
Throughout its history, the U.S. has experienced economic growth in varying degrees. Various historical time periods illustrate the rate of growth:
- Prior to industrialization: technological progress caused an increase in population, which was kept in check by food supply and other resources. The per capita income was limited.
- Industrial Revolution: a period of rapid economic growth. Despite the initial excess of population growth, the growth did eventually slow down; a condition called demographic transition. During the first Industrial Revolution mechanization was introduced. During the second Industrial Revolution, wind and water power replaced human and animal labor. This increased the level of production.
- 20th century growth: most economic growth in the 20th century was due to reduced inputs of labor, materials, energy, and land per unit of economic output. The growth was more balanced because more inputs were used due to the growth of output. Also, this time period experienced the production of new goods and services through innovations.
- 1920s: during this time period there was overproduction which was one cause of the Great Depression in the 1930s. Economic growth resumed following the depression and was aided by the demand for new goods and services (telephones, radios, televisions, etc. ).
- 1940 to 1970: the U.S. economy grew by an average of 3.8% and the real median household income surged 74% (2.1% a year).
- 1960s: the U.S. economy experienced its most extensive periods of economic growth from 1961 to 1969 with an expansion of 53% (5.1% a year).
- 1970s: the economy experienced slower growth after 1973. The average growth was 2.7%, there were stagnant living conditions, and household incomes increased by 10% (0.3% annually). The 1973 oil crisis caused the GDP to fall 3.7%. The GDP fell again in late 1973 to 1975 (3.1%).
- 1980s: the U.S. share of the world GDP peaked in 1985 with 23.78% of global GDP. There was a recession from 1981 to 1982 when the GDP dropped by 2.9% .
- 1990s: there was a mild recession in 1990 to 1991 when the output fell by 1.3%.
- 2000s: one of the worst recessions in recent decades occurred in 2008 when the GDP fell by 5.% in one year. The 2008 financial crisis was caused by a derivatives market, the subprime mortgage crisis, and a declining dollar value.

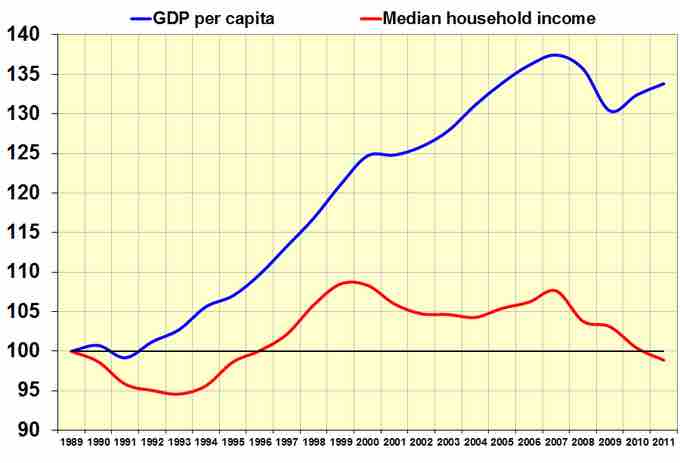
U.S. GDP vs. Household Income (1989-2011)
This graph shows the relationship of the GDP in the United States to the household income. This period from 1989 to 2011 was hit by a number of recessions.