Within a market system, economists use the production possibility frontier (PPF) to graph the combinations of the amounts of two commodities that can be produced using the same amount of each factor of production. A PPF graph chooses specific input quantities. As a result, it shows the maximum production level for one commodity for any production level of the other commodity . PPF is used to define production efficiency.

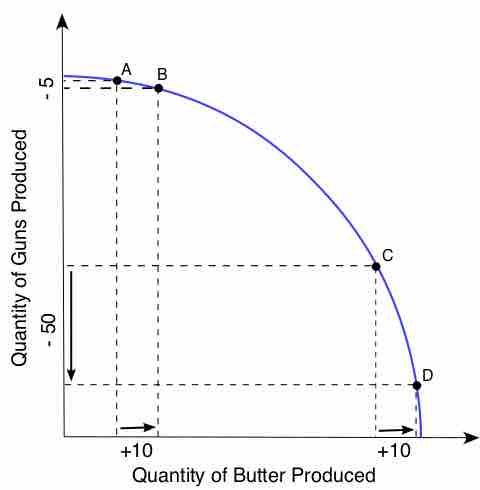
A common PPF
A common PPF where there is an increase in opportunity cost.
Within a PPF graph, the use of a curve or line acts as a benchmark for measuring efficiency. If a point on the graph is above the curve it indicates efficiency, while a point below the curve signifies inefficiency. For further analysis, additional information is always supplied with a PPF including the period of time taken for the observation, production technologies, and the amounts of inputs that were available.
Economists can use a PPF to illustrate a number of economic concepts including scarcity, opportunity cost, productive efficiency, allocative efficiency, and economies of scale.
When an economy is operating on the PPF curve it is efficient. It is not possible to produce more of one good without decreasing the amount produced for the other good. Likewise, if the economy is operating below the PPF curve, it is inefficient. In this case, the economy can reallocate resources and produce more of both the goods.
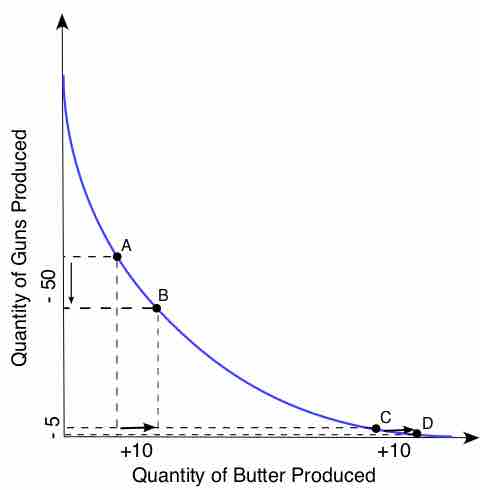
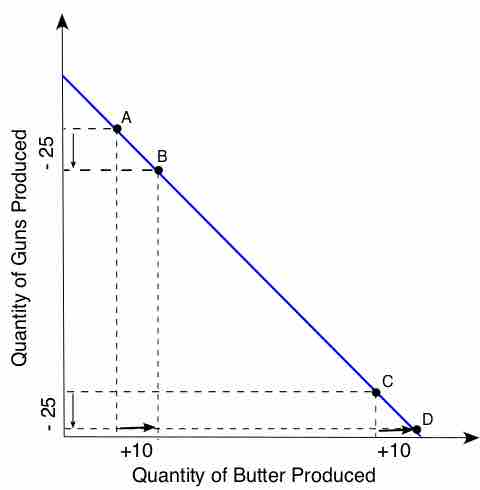
The PPF graph shows how resources must be shared among goods during the production process. The points of the graph show the trade-off that takes place between two goods. For example, if more of Good A needs to be produced, the amount of resources in use by Good B must be reduced and transferred to Good A. The sacrifice in production of Good B is called opportunity cost. When graphing PPF there are three types: the common, the straight line, and the inverted PPF . All three of the PPF graphs are directly influenced by the opportunity cost.

An inverted PPF
An inverted PPF where the opportunity cost is decreasing.

A straight line PPF
A straight line PPF where the opportunity cost is constant.
The slope of the PPF shows the rate at which the production of one good can be transferred to another. The slope is called the marginal rate of transformation (MRT).
Within an economy, if the capacity to produce both goods increases, the result is economic growth. Factors that influence economic capacity include technology, an increase in the supply of factors of production, and production interactions such as trade and exchange. When any of these factors are used it allows for an increase in capacity so that the production of neither good has to be sacrificed.
PPF graphs help economists study the current state of production as well as possible production scenarios. The output of the economy is impacted by many factors. When production can be graphed and monitored it allows adjustments to be made to work towards attaining economic growth and stability.