Concept
Version 11
Created by Boundless
Phase Changes and Energy Conservation

Phase Diagram of Water
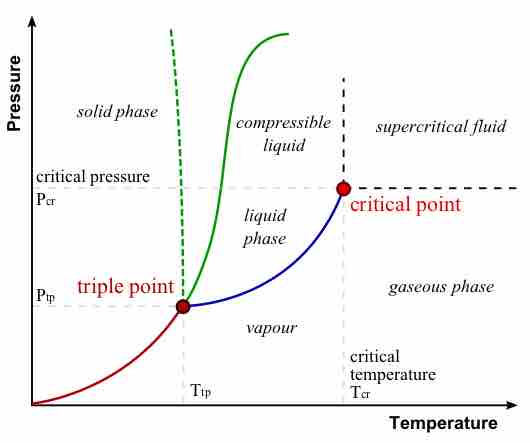
In this typical phase diagram of water, the green lines mark the freezing point, and the blue line marks the boiling point, showing how they vary with pressure. The dotted line illustrates the anomalous behavior of water. Note that water changes states based on the pressure and temperature.
Source
Boundless vets and curates high-quality, openly licensed content from around the Internet. This particular resource used the following sources: