A phase of a thermodynamic system and the states of matter have uniform physical properties. During a phase transition of a given medium certain properties of the medium change, often discontinuously, as a result of some external condition, such as temperature or pressure. For example, a liquid may become gas upon heating to the boiling point, resulting in an abrupt change in volume. The measurement of the external conditions at which the transformation occurs is termed the phase transition. The term is most commonly used to describe transitions between solid, liquid and gaseous states of matter and, in rare cases, plasma.
As an example, if you boil water, it never goes above 100 degrees Celsius. Only after it has completely evaporated will it get any hotter. This is because once water reaches the boiling point, extra energy is used to change the state of matter and increase the potential energy instead of the kinetic energy. The opposite happens when water freezes. To boil or melt one mole of a substance, a certain amount of energy is required. These amounts of energy are the molar heat of vaporization and molar heat of fusion. If that amount of energy is added to a mole of that substance at boiling or freezing point, all of it will melt or boil, but the temperature won't change.
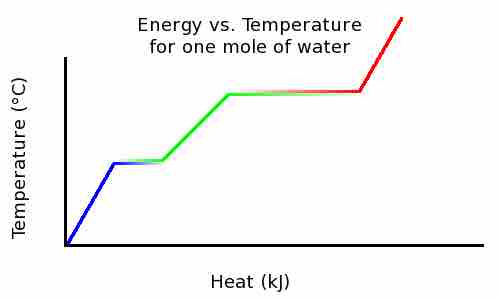
Temperature increases linearly with heat, until the melting point . But the heat added does not change the temperature; that heat energy is instead used to break intermolecular bonds and convert ice into water. At this point, there is a mixture of both ice and water. Once all ice has been melted, the temperature again rises linearly with heat added. At the boiling point, temperature no longer rises with heat added because the energy is once again being used to break intermolecular bonds. Once all water has been boiled to steam, the temperature will continue to rise linearly as heat is added.

Temperature vs. Heat
This graph shows the temperature of ice as heat is added.
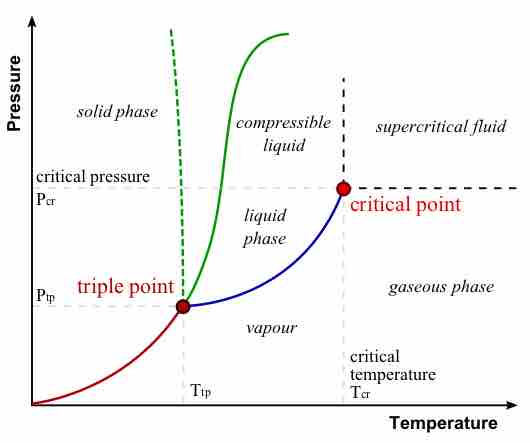
The plots of pressure versus temperatures provide considerable insight into thermal properties of substances. There are well-defined regions on these graphs that correspond to various phases of matter, so PT graphs are called phase diagrams . Using the graph, if you know the pressure and temperature you can determine the phase of water. The solid lines—boundaries between phases—indicate temperatures and pressures at which the phases coexist (that is, they exist together in ratios, depending on pressure and temperature). For example, the boiling point of water is 100º C at 1.00 atm. As the pressure increases, the boiling temperature rises steadily to 374º C at a pressure of 218 atm. A pressure cooker (or even a covered pot) will cook food faster because the water can exist as a liquid at temperatures greater than 100º C without all boiling away. The curve ends at a point called the critical point, because at higher temperatures the liquid phase does not exist at any pressure. The critical temperature for oxygen is -118ºC, so oxygen cannot be liquefied above this temperature.

Phase Diagram of Water
In this typical phase diagram of water, the green lines mark the freezing point, and the blue line marks the boiling point, showing how they vary with pressure. The dotted line illustrates the anomalous behavior of water. Note that water changes states based on the pressure and temperature.