Concept
Version 9
Created by Boundless
Graphs of Qualitative Data

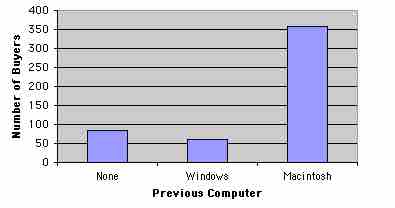
Bar Chart for Mac Data
The bar chart shows how many people in the study were previous Mac owners, previous Windows owners, or neither.
Source
Boundless vets and curates high-quality, openly licensed content from around the Internet. This particular resource used the following sources:
"David Lane, Graphing Qualitative Variables. April 22, 2013."
http://cnx.org/content/m10927/latest/
OpenStax CNX
CC BY 3.0.