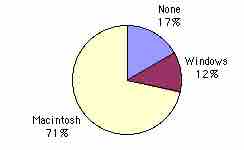
Pie Chart for Mac Data
The pie chart shows how many people in the study were previous Mac owners, previous Windows owners, or neither.
Source
Boundless vets and curates high-quality, openly licensed content from around the Internet. This particular resource used the following sources:
"David Lane, Graphing Qualitative Variables. April 22, 2013."
http://cnx.org/content/m10927/latest/
OpenStax CNX
CC BY 3.0.