Concept
Version 6
Created by Boundless
Statistical Graphics

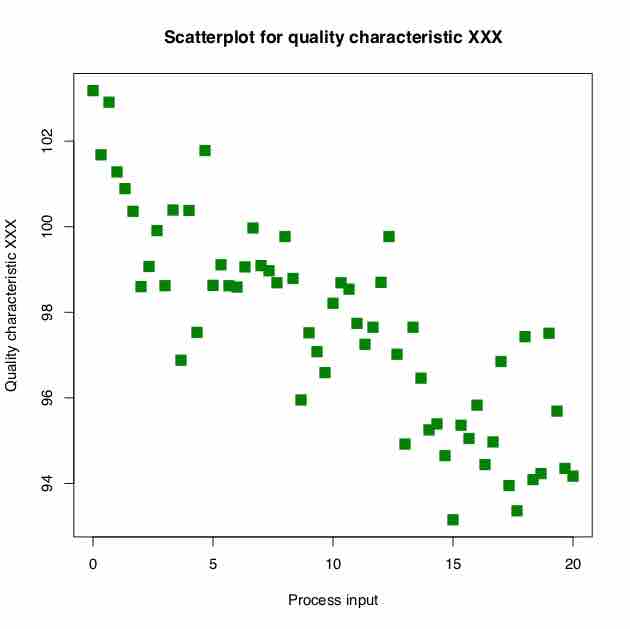
An example of a scatter plot
A scatter plot helps identify the type of relationship (if any) between two variables.
Source
Boundless vets and curates high-quality, openly licensed content from around the Internet. This particular resource used the following sources:
"Scatter diagram for quality characteristic XXX."
http://en.wikipedia.org/wiki/File:Scatter_diagram_for_quality_characteristic_XXX.svg
Wikipedia
CC BY-SA.