Concept
Version 12
Created by Boundless
Exponential and Logarithmic Functions

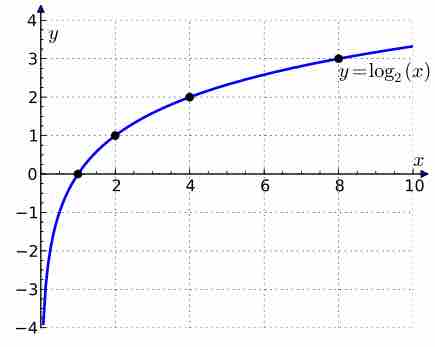
Plot of log2(x)
The graph of the logarithm to base 2 crosses the x-axis (horizontal axis) at 1 and passes through the points with coordinates
Source
Boundless vets and curates high-quality, openly licensed content from around the Internet. This particular resource used the following sources:
"Binary_logarithm_plot_with_ticks.png."
https://en.wikipedia.org/wiki/Logarithm
Wikipedia
CC BY-SA 4.0.