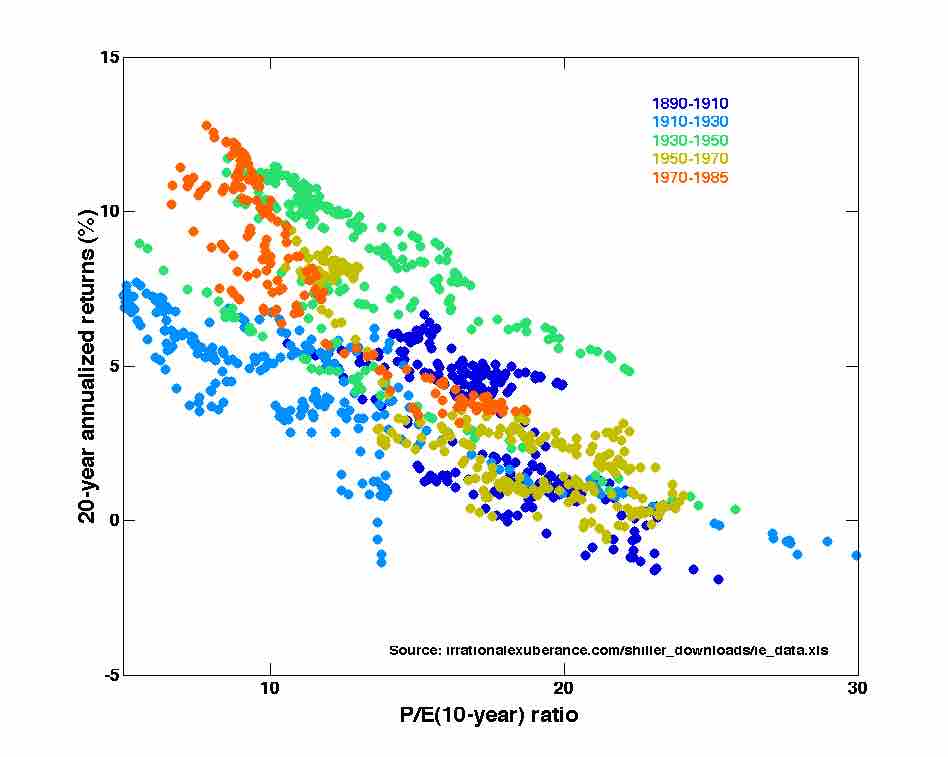
Price-Earning Ratios as a Predictor of Twenty-Year Returns
The horizontal axis shows the real price-earnings ratio of the S&P Composite Stock Price Index as computed in Irrational Exuberance (inflation adjusted price divided by the prior ten-year mean of inflation-adjusted earnings). The vertical axis shows the geometric average real annual return on investing in the S&P Composite Stock Price Index, reinvesting dividends, and selling twenty years later. Note that over the last century, as the P/E ratio has decreased, annualized returns have increased.
Source
Boundless vets and curates high-quality, openly licensed content from around the Internet. This particular resource used the following sources:
"Price-Earnings Ratio."
https://commons.wikimedia.org/wiki/File:Price-Earnings_Ratios_as_a_Predictor_of_Twenty-Year_Returns_(Shiller_Data).png
Wikimedia Commons
CC BY-SA 3.0.
.png)