The critical path method (CPM) is a project modeling technique that was developed in the late 1950s by Morgan R. Walker and James E. Kelley, Jr. CPM is commonly used for projects in construction, aerospace and defense, software development, research projects, product development, engineering, and plant maintenance. It is particularly useful for projects that have interdependent steps and/or processes.
CPM Inputs
CPM diagrams each step of a project(s). This includes a list of tasks and the time (duration) that each task should take to complete, and the sequence of and dependencies between tasks (such as "Step A has to be finished before moving to step B"). CPM uses task sequence and timing information to lay out the longest path of planned activities to the end of the project and give a time window during which the step should be completed to keep it from interfering with later steps.
Project managers can glean a lot of information about the timing of the project by following the pathways created in the CPM diagram between the different steps. They can determine which tasks need to be completed first and how much time can be spent on those tasks before they delay other parts of the project.
The Critical Path
Managers can also use CPM to determine which set of tasks is likely to take the longest. For example, if Step A has to be completed before Step B, which has to be completed before moving to Step C, but Steps D, E, and F can all be completed independent of each other, Steps A, B and C form the longest series of tasks in the project.
The longest series of tasks in a project is referred to as the "critical path;" in this case, it would be A-->C. The critical path is the sequence of project network tasks that combine for the longest overall duration. The critical path also tells the project manager the shortest possible time period in which the project can be completed since the timing of the project will be dependent on the completion of critical path tasks.
PERT Chart
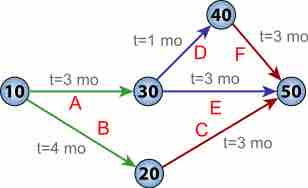
A PERT chart (program evaluation review technique) is diagram for CPM that represents tasks with an arrow diagram . PERT charts are more simplistic than CPM charts because they simply show the timing of each step of the project and the sequence of steps.

PERT chart
A PERT chart shows the timing of a project.
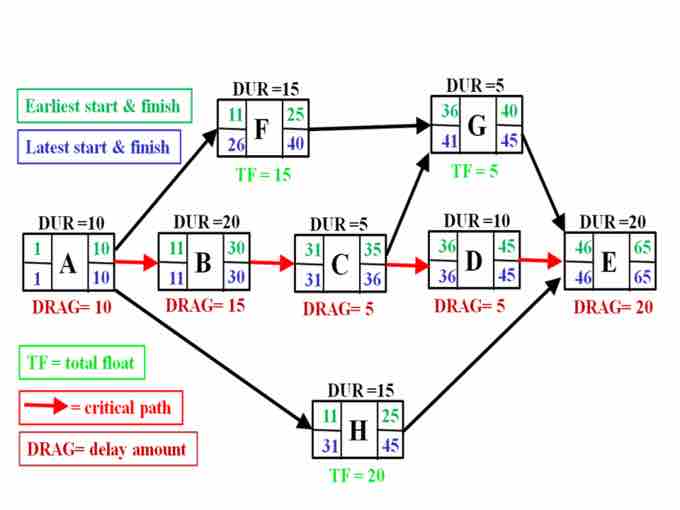
Standard CPM charts are more complex than PERT charts because they illustrate the sequence of steps and place a diagram around each step that shows the earliest and latest possible time that each task in the project can be completed.

CPM Chart
A CPM chart is similar to a PERT chart but includes more detail about the latest and earliest possible times at which each stage of the project must be completed. The earliest possible time (in green) are calculated by determining the earliest start times of all activities on the critical path before that activity. The latest possible times (in blue) are calculated by adding all of the latest possible times of the activities before the critical path. In this CPM chart, the critical path is A-B-C-D-E since that pathway takes the most time to complete of any of the other potential pathways available. The total float time (lime green), or TF, represents the amount of time flexibility a task has between start and end times.
Managerial Implications
CPM/PERT charts are useful in determining where potential delays may occur in a project and deciding the sequence of tasks. This helps project managers organize tasks and ensure that time is managed appropriately at each stage of the project.
Project managers are master multitaskers, capable of seeing the forest of the long-term agenda through the trees of short-term objectives. The cumulative process of transforming various independent efforts into an interdependent value-added proposition is often complex; CPM/PERT charts allow project managers to visualize tasks chronologically. This time component is critical because understanding the prerequisites for each stage of development minimizes delays and ensures ideal resource allocation.
Finally, the concept of a critical path is integral to the usefulness of the model. Identifying which task grouping will determine the overall length of the project allows proper prioritization and enables deadlines to be shortened through increased effort in specific areas. This makes it easier for the project manager to effectively add value by reducing lead times.