The sample average/mean can be calculated taking the sum of every piece of data and dividing that sum by the total number of data points.
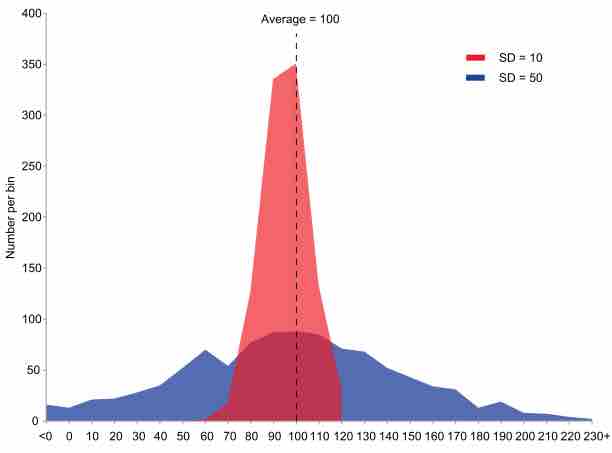
Although they are often used interchangeably, the standard deviation and the standard error are slightly different.
The standard error of the mean is the standard deviation of the sample mean's estimate of a population mean.
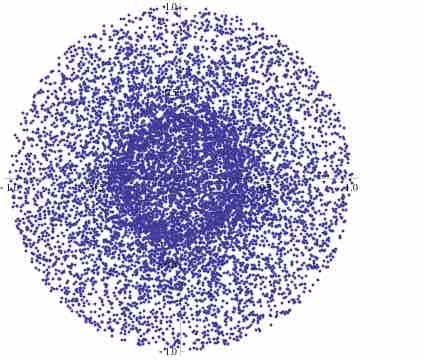
A stochastic model is used to estimate probability distributions of potential outcomes by allowing for random variation in one or more inputs over time.
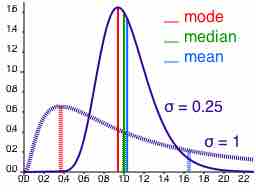
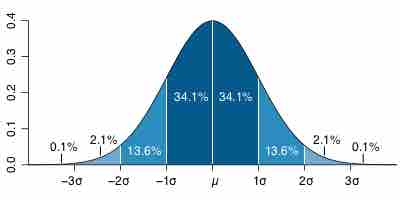
The normal (Gaussian) distribution is a commonly used distribution that can be used to display the data in many real life scenarios.
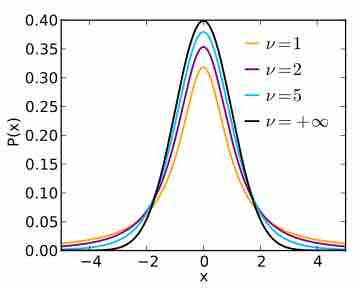
Student's t-test is used in order to compare two independent sample means.
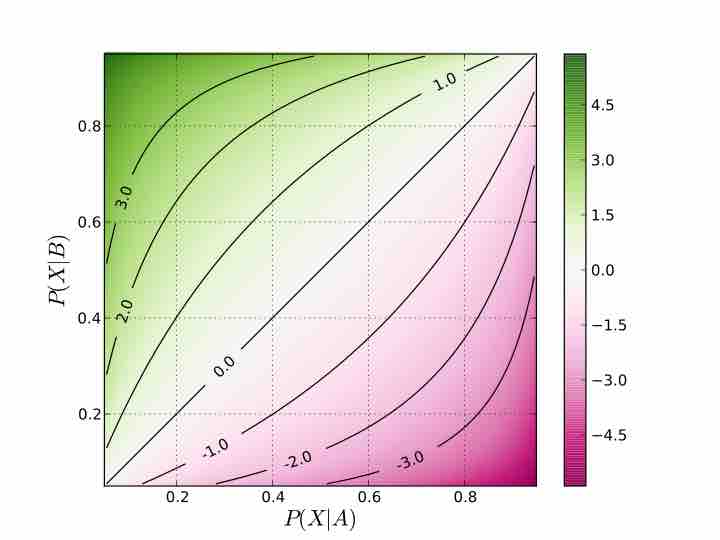
The odds of an outcome is the ratio of the expected number of times the event will occur to the expected number of times the event will not occur.
A