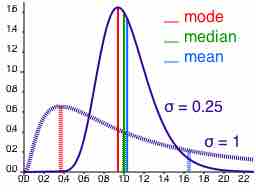
The term central tendency relates to the way in which quantitative data tend to cluster around some value.
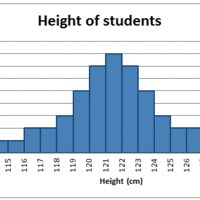
The shape of a histogram can assist with identifying other descriptive statistics, such as which measure of central tendency is appropriate to use.
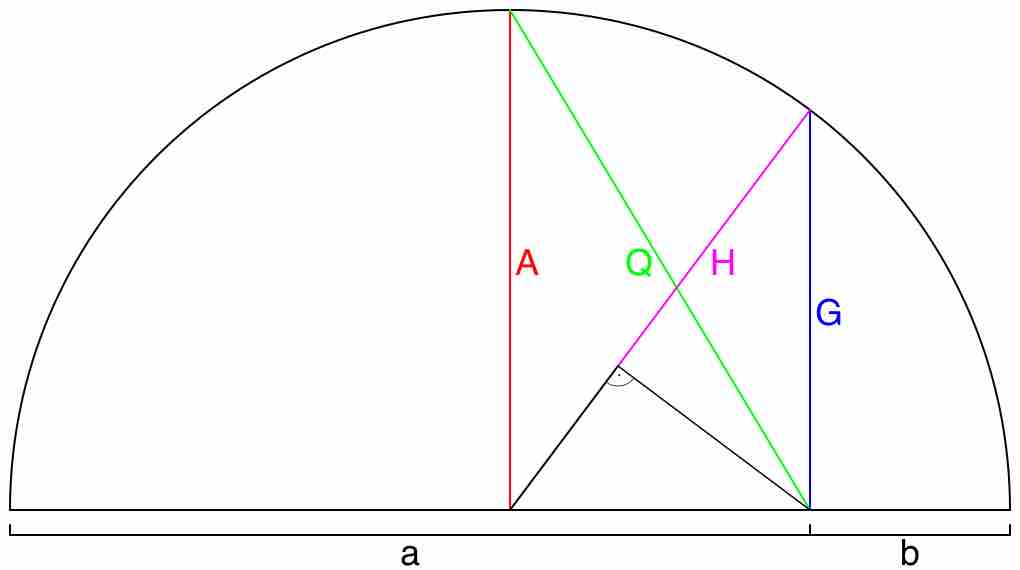
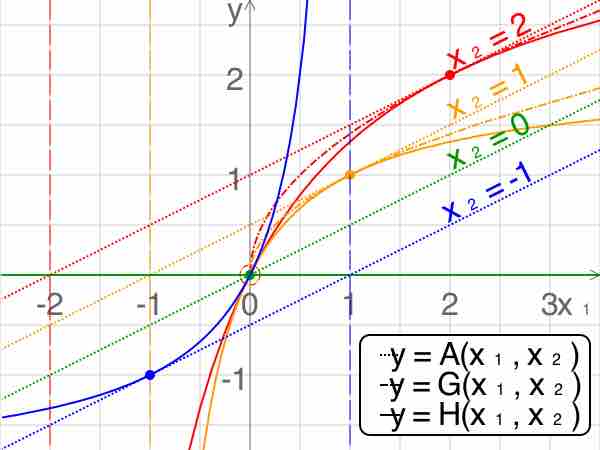
The root-mean-square, also known as the quadratic mean, is a statistical measure of the magnitude of a varying quantity, or set of numbers.
Depending on the characteristic distribution of a data set, the mean, median or mode may be the more appropriate metric for understanding.
The central tendency for qualitative data can be described via the median or the mode, but not the mean.

Measures of relative standing can be used to compare values from different data sets, or to compare values within the same data set.

The median is the middle value in distribution when the values are arranged in ascending or descending order.

The mode is the most commonly occurring value in a distribution.
The law of averages is a lay term used to express a belief that outcomes of a random event will "even out" within a small sample.
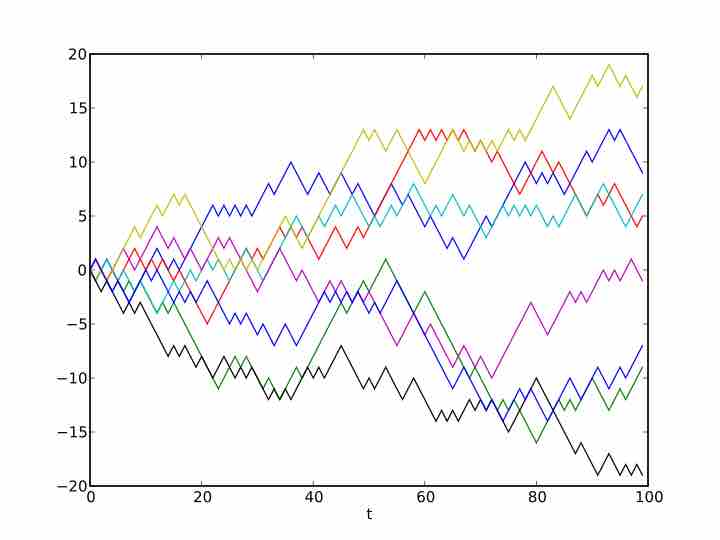
A stochastic process is a collection of random variables that is often used to represent the evolution of some random value over time.

The sum of draws is the process of drawing randomly, with replacement, from a set of data and adding up the results.
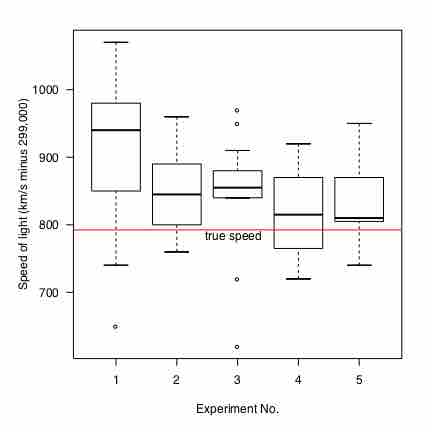
A box plot (also called a box-and-whisker diagram) is a simple visual representation of key features of a univariate sample.
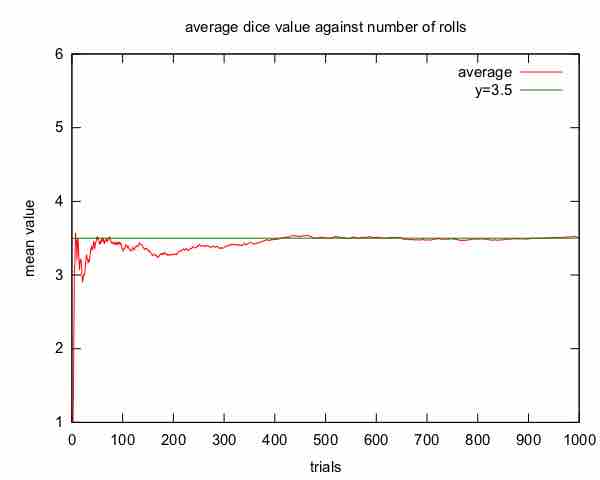
The sample average/mean can be calculated taking the sum of every piece of data and dividing that sum by the total number of data points.
Although they are often used interchangeably, the standard deviation and the standard error are slightly different.
The standard error of the mean is the standard deviation of the sample mean's estimate of a population mean.
A stochastic model is used to estimate probability distributions of potential outcomes by allowing for random variation in one or more inputs over time.
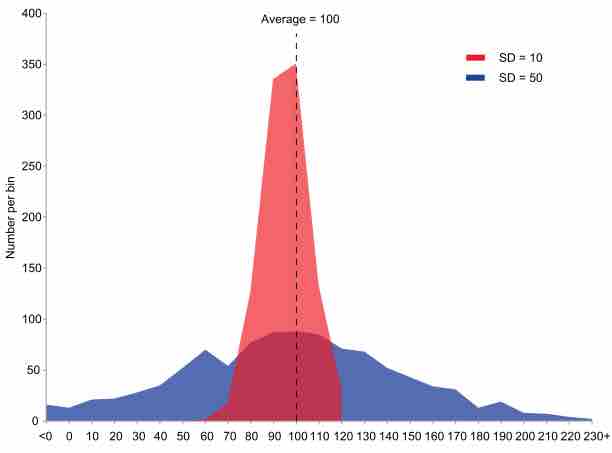
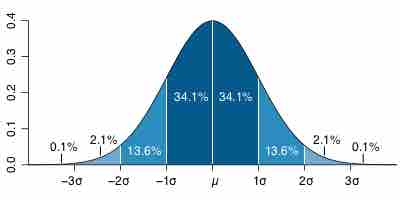
The normal (Gaussian) distribution is a commonly used distribution that can be used to display the data in many real life scenarios.
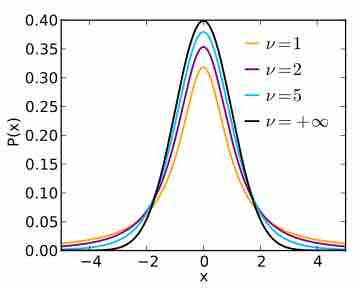
Student's t-test is used in order to compare two independent sample means.
The odds of an outcome is the ratio of the expected number of times the event will occur to the expected number of times the event will not occur.
A