Content on this page was developed during the 2009-2010 H1N1 pandemic and has not been updated.
- The H1N1 virus that caused that pandemic is now a regular human flu virus and continues to circulate seasonally worldwide.
- The English language content on this website is being archived for historic and reference purposes only.
- For current, updated information on seasonal flu, including information about H1N1, see the CDC Seasonal Flu website.
NOTE:This page is not intended as a stand-alone Web document and is intended to serve merely as a Section 508-accessible version of the PowerPoint presentation "2009 H1N1: Overview of a Pandemic, April 2009 - August 2010."
2009 H1N1: Overview of a Pandemic
Impact of 2009 H1N1
Global Impact
- More than 214 countries and overseas territories or communities had reported laboratory confirmed cases of pandemic influenza H1N1 2009, including at least 18,449 deaths (World Health Organization, August 6, 2010)
- Reported cases and deaths are likely a substantial under-estimate of true impact of 2009 H1N1
- Estimating the true number of individual flu cases and deaths is very challenging
- Many people with flu don’t seek medical care
- Only a small number of those that do seek care are tested
- More people who are hospitalized or die of flu-related causes are tested and reported, but under-reporting of hospitalizations and deaths occurs as well
Impact of 2009 H1N1 Flu
Domestic Impact
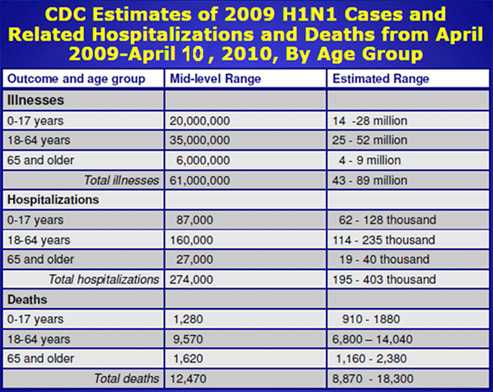
Characteristics of 2009 H1N1 Influenza
April 15, 2009 to April 10, 2010
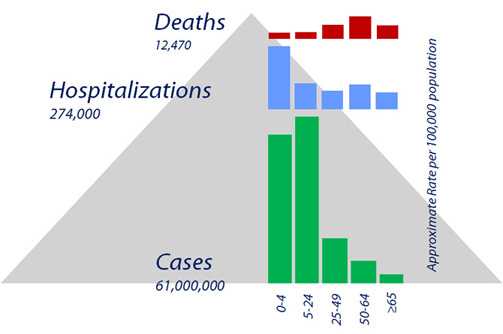
Groups at Increased Risk of Severe Influenza (2009 H1N1)
- Most impacted populations
- Children, young adults
- Persons with underlying chronic medical conditions (e.g. chronic lung disease, heart disease, immunosuppression, neurological and neurodevelopment diseases)
- Pregnant women
- Indigenous populations
- Possible risk groups
- Obesity (Body Mass Index ≥35), Extreme/Morbid obesity (Body Mass Index ≥40)
2009 H1N1 Hospitalizations Frequency of Underlying Conditions in Adults EIP April 15, 2009 – February 16, 2010 (n=4,987)
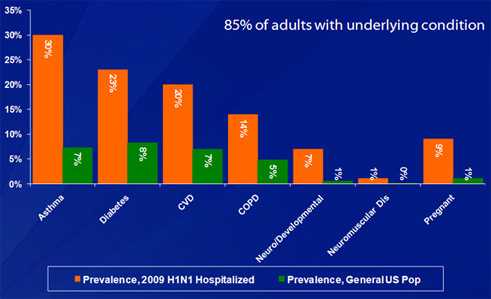
Underlying conditions among hospitalized patients and those who died from H1N1 compared to the general population
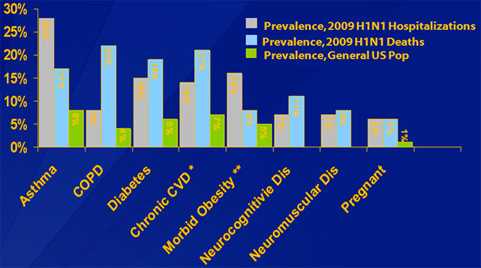
*Excludes hypertension
** Morbid obesity is defined as BMI of 40 or higher. For Hospitalized H1N1 patients, BMI calculation was performed on non-pregnant adults ≥ 20 years (n=119). 45% of 119 non-pregnant hospitalized adults ≥ 20 years were missing height and weight information. For Novel H1N1 Deaths, morbid obesity % was calculated for adults only. Prevalence for US non-pregnant adults is based on NHANES (JAMA. 2006;295(13):1577)
Source O Morgan, et al.
Obesity: a New Risk Factor for Severe Illness due to 2009 H1N1
- Disproportionate number of obese, particularly morbidly obese, among severely ill during 2009 H1N1 pandemic
- Morbid obesity (BMI≥40) was associated with hospitalization, and possibly death, due to 2009 H1N1 infection among adults without chronic medical conditions
- Additional studies with larger sample of patients and appropriate comparison groups are needed
Morgan OW, Bramley A, et al. (2010)
PLoS ONE 5(3): e9694. doi:10.1371/journal.pone.0009694
Age-adjusted and Season-specific 2009 H1N1 Influenza-related Hospitalization Rates (per 100,000) by race & ethnicity – Emerging Infections Program, 2009-10
Race/Ethnicity |
Influenza Season |
|
2009 |
2009-10 |
|
White, non-Hispanic |
3.0 |
16.3 |
Black, non-Hispanic |
10.9 |
29.7 |
Hispanic |
8.2 |
30.7 |
Asian/Pacific Islander |
8.1 |
12.5 |
American Indian/Alaska Native |
4.1 |
32.7 |
|
2009: April 15 - August 31, 2009 2009-10: September 1, 2009 - January 26, 2010 |
||
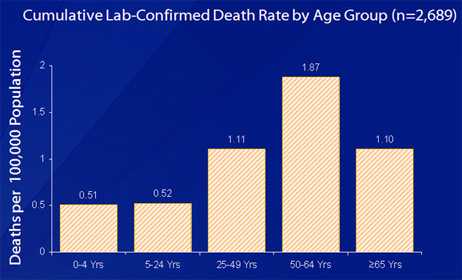
2009 H1N1 Cumulative Lab-Confirmed Death Rate, by Age Group – April 2009 through March 27, 2010
Next: 2009 H1N1 Accomplishments >
Get email updates
To receive weekly email updates about this site, enter your email address:
Contact Us:
- Centers for Disease Control and Prevention
1600 Clifton Rd
Atlanta, GA 30333 - 800-CDC-INFO
(800-232-4636)
TTY: (888) 232-6348 - Contact CDC-INFO
