2011-2012 Drinking Water-associated Outbreak Surveillance Report: Supplemental Figures
These tables provide supplemental information not published in Surveillance for Waterborne Disease Outbreaks Associated with Drinking Water — United States, 2011–2012 (MMWR Weekly).
Number of Waterborne-Disease Outbreaks Associated with Drinking Water* — Waterborne Disease and Outbreak Surveillance System, 2011–2012
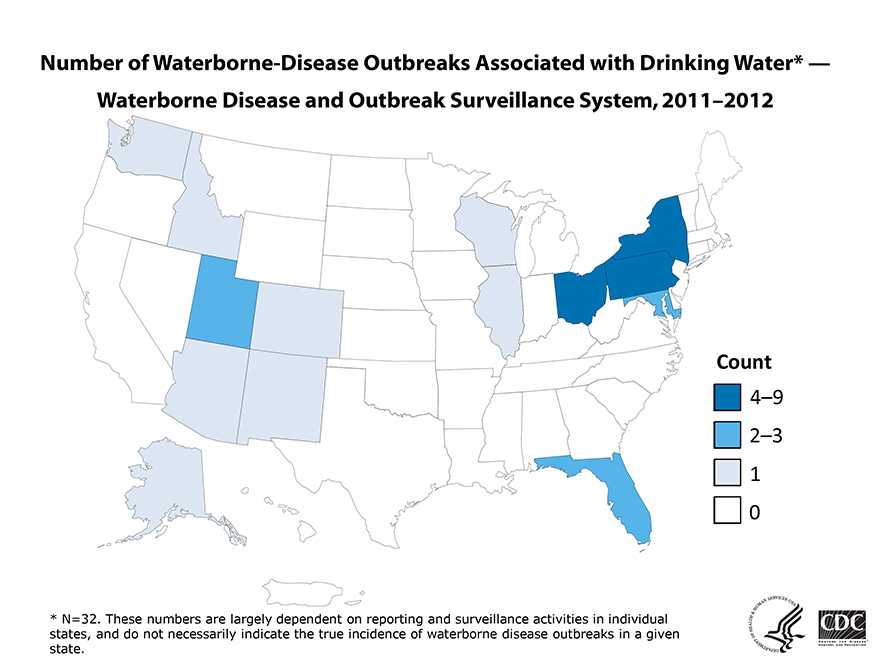
* N=32. These numbers are largely dependent on reporting and surveillance activities in individual states, and do not necessarily indicate the true incidence of waterborne disease outbreaks in a given state.
Download PDF
Download CSV
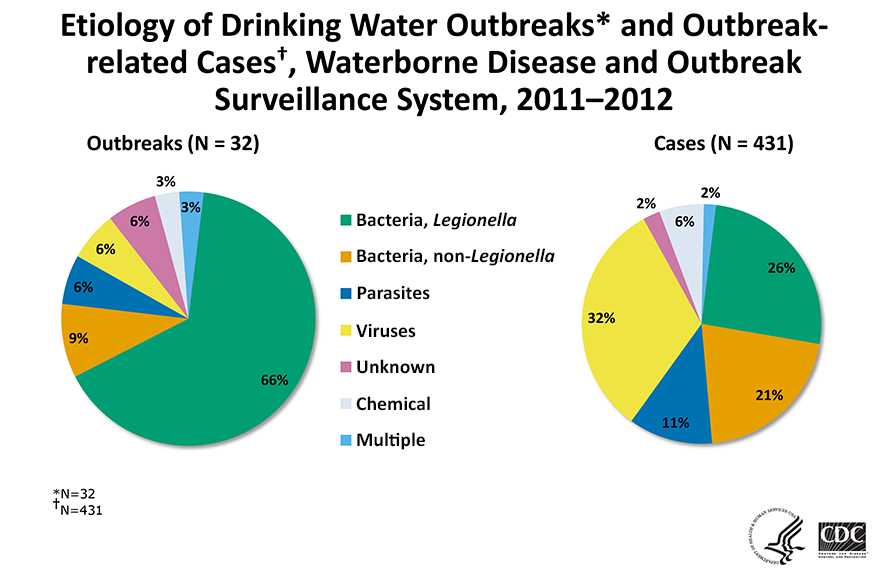
Top of PageEtiology of Drinking Water Outbreaks* and Outbreak-related Cases†, Waterborne Disease and Outbreak Surveillance System, 2011–2012
Download PDF
Download CSV
Top of PagePredominant Illness in Drinking Water Outbreaks* and Outbreak-related Cases†, Waterborne Disease and Outbreak Surveillance System, 2011–2012
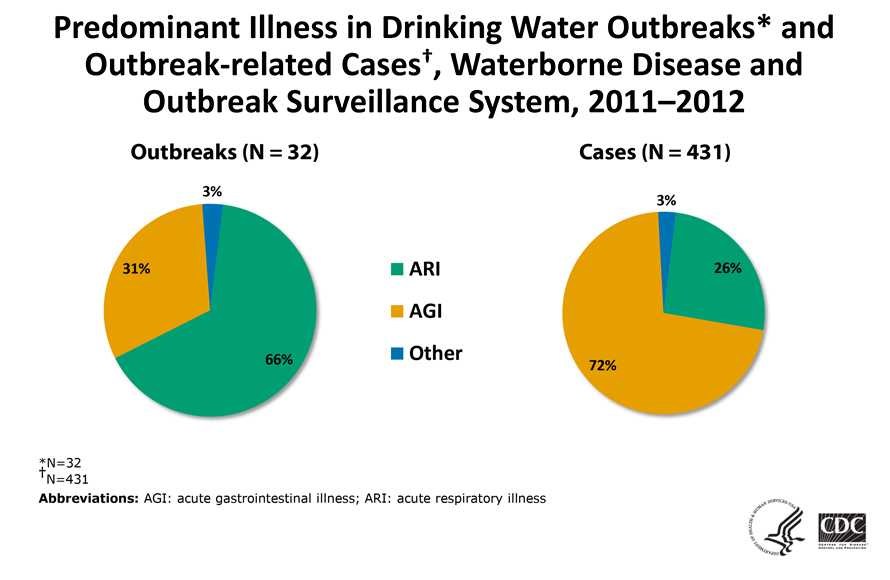
Abbreviations: AGI: acute gastrointestinal illness; ARI: acute respiratory illness
Download PDF
Download CSV
Top of PagePredominant Illness Reported for all Drinking Water Outbreaks, and Etiologies in Outbreaks of Acute Gastrointestinal Illness (AGI), Waterborne Disease and Outbreak Surveillance System, 2011–2012
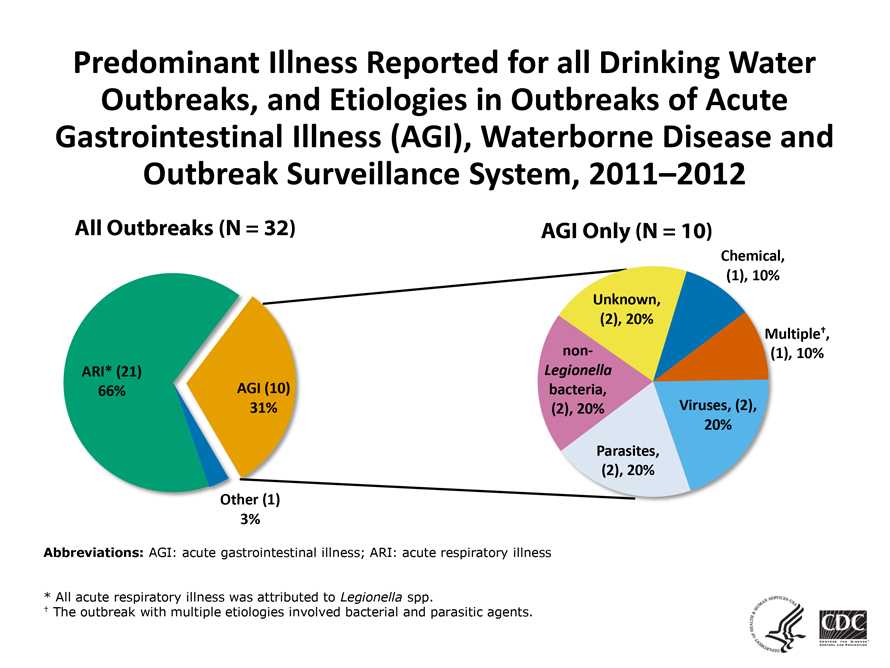
Abbreviations: AGI: acute gastrointestinal illness; ARI: acute respiratory illness
* All acute respiratory illness was attributed to Legionella spp.
† The outbreak with multiple etiologies involved bacterial and parasitic agents.
Download PDF
Download CSV
Top of PageWater Systems Associated with Drinking Water Outbreaks* and Outbreak-related Cases†, Waterborne Disease and Outbreak Surveillance System, 2011–2012
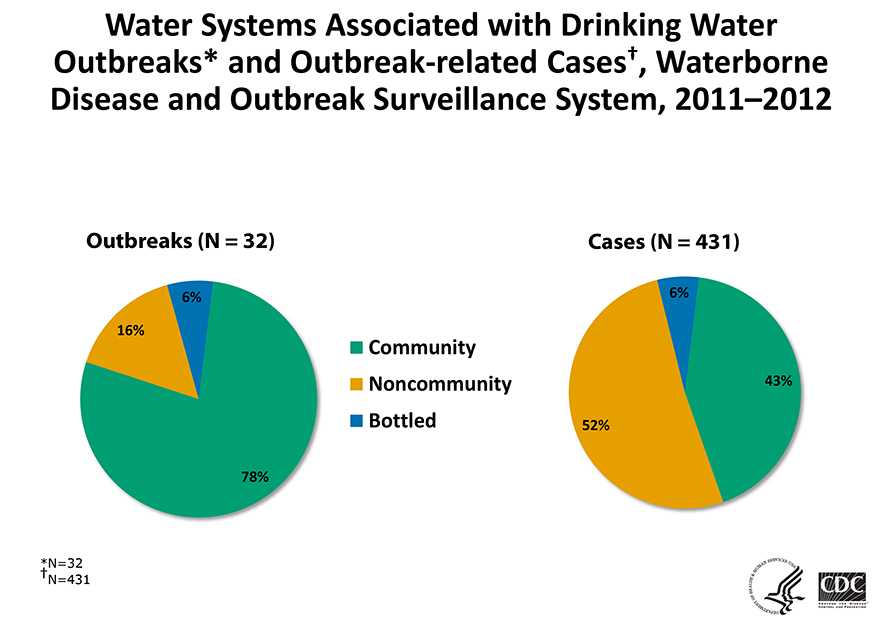
Download PDF
Download CSV
Top of PageWater Sources Associated with Drinking Water Outbreaks* and Outbreak-related Cases†, Waterborne Disease and Outbreak Surveillance System, 2011–2012
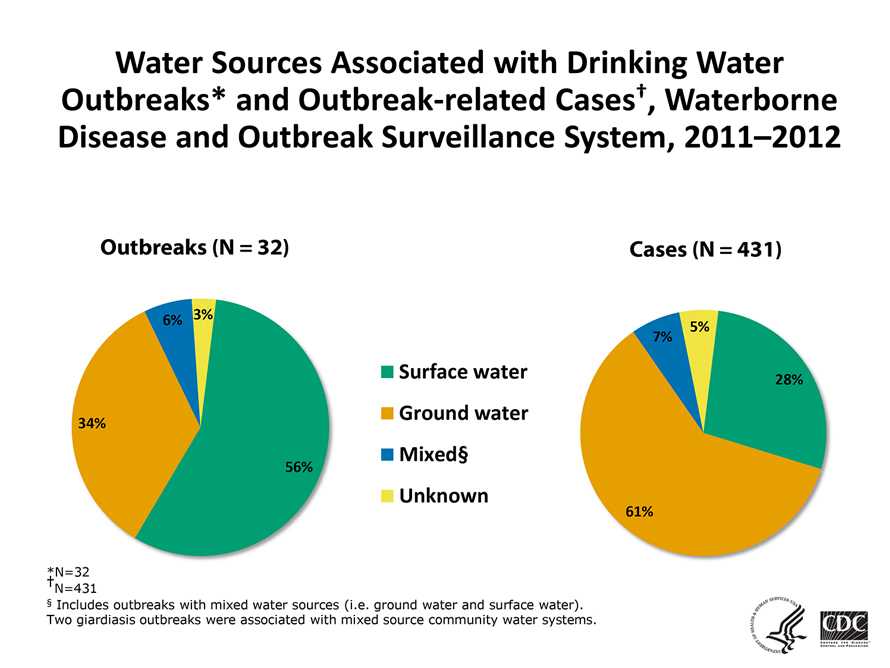
§ Includes outbreaks with mixed water sources (i.e. ground water and surface water). Two giardiasis outbreaks were associated with mixed source community water systems.
Download PDF
Download CSV
Top of PageDeficiencies Assigned to Drinking Water Outbreaks* and Outbreak-related Cases†, Waterborne Disease and Outbreak Surveillance System, 2011–2012
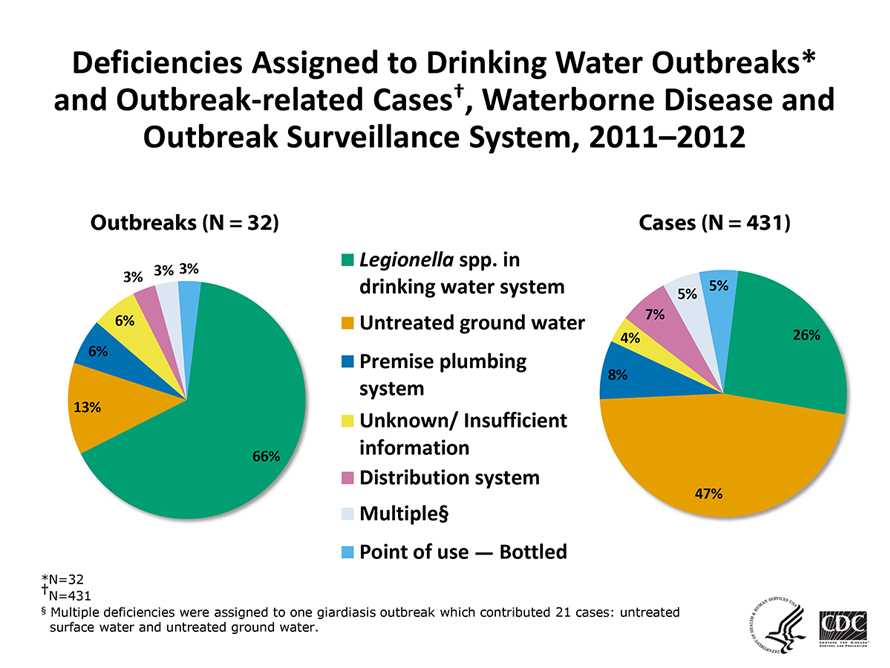
§ Multiple deficiencies were assigned to one giardiasis outbreak which contributed 21 cases: untreated surface water and untreated ground water.
Download PDF
Download CSV
Top of Page- Page last reviewed: August 13, 2015
- Page last updated: August 13, 2015
- Content source:


 ShareCompartir