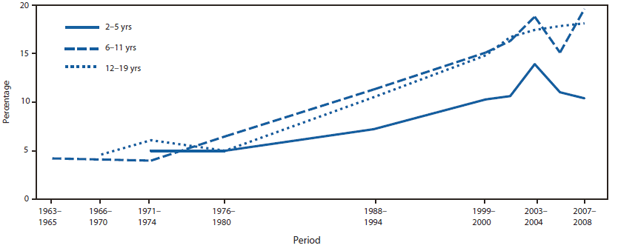
FIGURE 1. Prevalence of obesity among children and adolescents, by age group --- United States, 1963--2008
Persons using assistive technology might not be able to fully access information in this file. For assistance, please send e-mail to: mmwrq@cdc.gov. Type 508 Accommodation and the title of the report in the subject line of e-mail.
CDC Grand Rounds: Childhood Obesity in the United States
Please note: An erratum has been published for this article. To view the erratum, please click here.
The magnitude of the problem
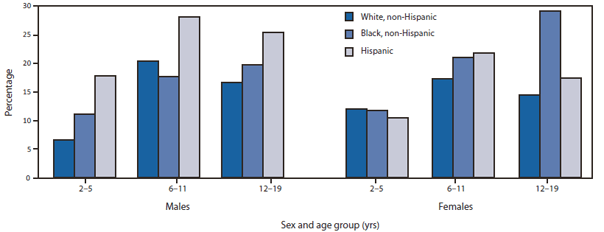
In the United States, childhood obesity affects approximately 12.5 million children and teens (17% of that population) (1). Changes in obesity prevalence from the 1960s show a rapid increase in the 1980s and 1990s, when obesity prevalence among children and teens tripled, from nearly 5% to approximately 15% (Figure 1) (1). During the past 10 years, the rapid increase in obesity has slowed and might have leveled. However, among the heaviest boys, a significant increase in obesity has been observed, with the heaviest getting even heavier. Moreover, substantial racial/ethnic disparities exist, with Hispanic boys and non-Hispanic black girls disproportionately affected by obesity (Figure 2) (1). Also, older children and teens are more likely to be obese compared with preschoolers (1).
In the short term, obesity in children can lead to psychosocial problems and to cardiovascular risk factors such as hypertension, high cholesterol, and abnormal glucose tolerance or diabetes. In one study, 70% of obese children had at least one additional cardiovascular risk factor, and 30% had two or more (2). Although the prevalence of type 2 diabetes in teens is very low, a recent report estimated that 15% of new diabetes cases among children and adolescents are type 2 diabetes (3). In the 1980s, type 2 diabetes in teens was virtually unheard of.
The prevalence of obesity among U.S. adults (34%) is twice that observed in children and translates into nearly 73 million adult men and women (4). On average, U.S. adults weigh 24 pounds more than they did in 1960 (5), and they are at increased risk for health conditions such as diabetes, cardiovascular disease, and certain cancers. Although obesity prevalence has remained mostly flat in the past 10 years, the costs associated with obesity have increased substantially during the same period. One study estimated that approximately 9% of all medical costs in 2008 were obesity-related and amounted to $147 billion, compared with $78.5 billion 10 years before (6).
Challenges and strategies to combat the problem
Identification of effective interventions. Environmental determinants of childhood obesity in the United States include shifts in food consumption, changes in physical activity levels, and higher levels of television viewing, with the consequent inactivity and marketing of food to children. CDC is focusing on best available evidence to implement intervention programs. For maximum population impact, the focus should be on strategies that alter the food and physical activity environments in places where persons live, learn, work, play, and pray. Interventions aimed at single behavioral targets are unlikely to have a substantial impact, and both evidence-based practice and practice-based evidence should be considered.
Breastfeeding has been shown to have substantial health benefits for children, who consequently might be at reduced risk for childhood obesity (7). The most recent data show that nearly 30% of mothers do not breastfeed, and only approximately 40% of children are still breastfed at age 6 months (the recommended duration of exclusive breast feeding is to age 4--6 months) (8). A study of mothers' experiences during their stay at maternity-care hospitals found that duration of breastfeeding increased when the number of baby-friendly steps the mother experienced increased (e.g., initiating breastfeeding early, exclusive breastfeeding, rooming in, on-demand feedings, no pacifiers, and providing information to new mothers) (9). Interventions that encourage breastfeeding in workplaces also would increase the chances of working mothers continuing to breastfeed longer.
Strategies to reduce energy intake include decreasing consumption of high energy-density foods, increasing consumption of fruits and vegetables, decreasing consumption of sugar-sweetened beverages, and decreasing time spent watching television and exposure to food marketed to children. A substantial proportion of all money spent on food consumed outside the home is spent on fast food (10). Institutions such as child-care facilities and schools should alter their purchasing strategies to reduce the availability of high-calorie foods. Approaches to reducing energy intake through decreasing consumption of sugar drinks (sodas and 10% juice--containing beverages) include 1) enacting regulations and policies that eliminate availability of such drinks, including sports drinks, in child-care settings and schools and at school events and afterschool programs, 2) increasing availability of fresh water in parks and recreational facilities, and 3) eliminating sugar drinks in school vending machines. Reducing the amount of time children spend watching television, and thus reducing exposure to food marketed to them, can be accomplished by limiting television time at home and in child-care settings and removing televisions from children's bedrooms.
Increasing energy output through increased physical activity plays an important role in preventing and reducing obesity-related illnesses and conditions such as hyperlipidemia, hyperinsulinemia, and elevated blood pressure, even if weight is not reduced (11). Activity levels can be increased by making it safer to walk or bike to school. Quality school physical education programs that keep children moving the majority of their time in physical education class should be implemented. Providing a safe environment for physical activity and establishing habits (e.g., regular physical activity) that will lead to activity into and throughout adulthood must become priorities.
An example of a comprehensive school-based program was one that was implemented in Philadelphia, Pennsylvania, aimed at 4th, 5th, and 6th graders, which included reducing television time, increasing physical activity, and increasing fruit and vegetable intake (11). This intervention was based on CDC's School Health Guidelines for Nutrition (12) and included changes in the school food supply to meet the Dietary Guidelines for Americans (13). The 2-year intervention resulted in a 50% reduction in the incidence of overweight and a 10% reduction in prevalence of overweight. Physical inactivity and television viewing also declined (14).
Policies and systems changes in action. Changing policy often is the most effective way to implement and sustain these kinds of environmental changes. Policies not traditionally thought of as health policies (e.g., involving transportation, land use, education, agriculture, and economics) can affect health and obesity rates. The following two examples of major policy-driven initiatives requiring system changes focus on access to healthy foods and improving the built environment, respectively.
According to the U.S. Department of Agriculture, approximately 23.5 million persons in urban and rural areas of the United States live in "food deserts" (i.e., low-income areas without access to healthy foods) (15). Improved access to healthy foods might improve eating habits and decrease obesity. The Fresh Food Financing Initiative (FFFI) in Pennsylvania is a public-private partnership that has improved access to healthy foods using one-time loans and grants; as of September 2009, it had committed $59.7 million to projects across the state (16). As a result of FFFI, approximately 500,000 persons now have access to healthy foods who did not have it before, nearly 5,000 jobs have been created or retained, and approximately 1.5 million square feet of retail space has been created or saved (16). Eighty-three projects have been implemented, ranging from large supermarkets in urban settings to small stores in small town/rural settings, farmers markets, and community-supported agriculture. Replication of FFFI is under way in California, Colorado, Illinois, Louisiana, New Jersey, and New York. The President's proposed 2011 budget includes support for a Healthy Food Financing Initiative (HFFI), which combines $345 million from the U.S. Department of Agriculture, U.S. Department of Health and Human Services, and U.S. Treasury Department for loans, grants, and tax credits to support a range of projects designed to increase access to healthy foods.*
Supporting HFFI and other policies to increase access to healthy foods through different food and farm policy innovations, and improving the built environment through strategies for walkable, bikeable, and safe neighborhoods, parks, and playgrounds, particularly in underresourced communities, are the focus of the Convergence Partnership, a collaborative of six major funding organizations and CDC.† PolicyLink, a national research and policy institute serves as the Convergence Partnership program lead, providing guidance about policy and strategy.§ Local strategies for enhancing the built environment to support healthy eating and active living include walkable and bikeable neighborhoods, public transit, joint use of school yards, and health impact assessments. Public education and advocacy efforts already have increased awareness of the connection between health and transportation and have altered policy proposals.
Implementation at the state level: the Maine experience. In Maine, the pediatric community partnered with community groups, the Maine-Harvard Prevention Research Center, and the state Center for Disease Control and Prevention to develop simple steps clinicians could follow in their practices to reduce childhood obesity. These partnerships led to formation of the Maine Youth Overweight Collaborative (MYOC) in 2004.¶ It started with a simple message: 5-2-1-0: five or more fruits and vegetables per day, 2 hours or less screen time per day, 1 hour or more of physical activity per day, and zero sugar drinks coupled with more water and low fat milk consumption. This message provided clinicians with basic steps to take to combat the childhood obesity epidemic. Before MYOC, clinicians documented body mass index for age and sex approximately 25% of the time; after 24 months of MYOC in action, approximately 90% of encounters resulted in a documented body mass index.
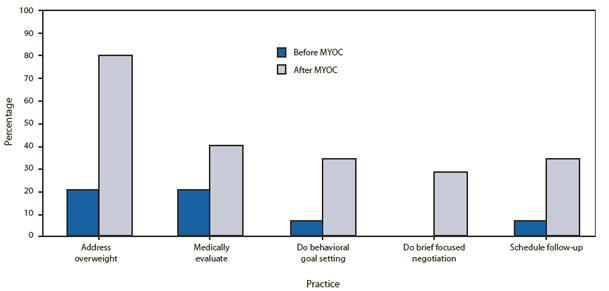
In 2006, a group of local businesses and health-care leaders in Portland, Maine, formed a unique profit/nonprofit partnership called Let's Go! that used lessons learned and tools and resources developed in MYOC to take the 5-2-1-0 message to additional settings: schools, child-care centers, communities, workplaces, after-school programs, and health-care settings.** The core principles of Let's Go! affirm that 1) environmental and policy changes influence behavior change, 2) interconnectivity across sectors is essential, and 3) strategies should be evidence-based and continuously evaluated. Let's Go! has a robust evaluation plan that focuses on qualitative and quantitative data. Because changes in obesity rates take years, progress is tracked through environmental and policy changes as well as behavioral data as precursors to changes in population weight status (Figure 3). Parents already are more likely able to identify all four healthy behaviors correctly, and a 27% increase in perceived behavior change was observed among children in three of four of the 5-2-1-0 targeted behaviors. Let's Go! has begun to expand statewide, and by June 2010, involved nearly 85,000 students in 262 schools, 40 child-care sites caring for thousands of children, approximately 50 physician practices, numerous after-school programs supporting approximately 2,500 youths, six of Portland's largest employers, and eight regions across Maine. Since June 2010, Let's Go! has been disseminated statewide to seven additional regions in Maine.
Other initiatives. The efforts already under way for obesity prevention and control are further strengthened by Let's Move, the First Lady's initiative to end childhood obesity in a generation, by empowering parents, encouraging healthier foods in schools, increasing physical activity, and increasing access to affordable healthy foods.†† Let's Move includes establishment of the intergovernmental Childhood Obesity Task Force and, in the U.S. Department of Health and Human Services, a Healthy Weight Task Force is developing broad approaches in multiple sectors. Other key programs include those instituted by the Convergence Partnership and programs initiated by CDC with funds from the American Recovery and Reimbursement Act of 2009.
Summary
Policy and environmental interventions show early evidence of improving environments that will lead to lower rates of obesity. Nonetheless, more studies of impact and effectiveness are needed, as are identification and evaluation of promising approaches from around the country. The high visibility accorded to childhood obesity by the Let's Move initiative and the funding provided to states and communities through the American Recovery and Reinvestment Act provide unparalleled opportunities to reverse the obesity epidemic.
Reported by
J Bell, MPA, PolicyLink, Oakland, California. VW Rogers, MD, Barbara Bush Children's Hospital, Maine Medical Center, Portland, Maine. WH Dietz, MD, PhD, Div of Nutrition, Physical Activity, and Obesity, National Center for Chronic Disease Prevention and Health Promotion; CL Ogden, PhD, Div of Health and Nutrition Examination Surveys, National Center for Health Statistics; C Schuler, PhD, Div of Respiratory Disease Studies, National Institute for Occupational Safety and Health; T Popovic, MD, PhD, Office of the Director, CDC.
References
- Ogden CL, Carroll MD, Curtin LR, Lamb MM, Flegal KM. Prevalence of high body mass index in US children and adolescents, 2007--2008. JAMA 2010;303:242--9.
- Freedman DS, Mei Z, Srinivasan SR, Berenson GS, Dietz WH. Cardiovascular risk factors and excess adiposity among overweight children and adolescents: The Bogalusa Heart Study. J Pediatr 2007;150:12--7.
- SEARCH for Diabetes in Youth Study Group. The burden of diabetes mellitus among US youth: prevalence estimates from the SEARCH for Diabetes in Youth Study. Pediatrics 2006;118:1510--8.
- Flegal KM, Carroll MD, Ogden CL, et al. Prevalence and trends in obesity among US adults, 1999--2008. JAMA 2010;303:235--41.
- Ogden CL, Fryar CD, Carroll MD, Flegal KM. Mean body weight, height, and body mass index, United States 1960--2002. Adv Data 2004;347:1--17.
- Finkelstein EA, Trogdon JG, Cohen JW, Dietz W. Annual medical spending attributable to obesity: payer- and service-specific estimates. Health Aff (Millwood) 2009;28:w822--31.
- Harder T, Bergmann R, Kallischnigg G, Plagemann. Duration of breastfeeding and risk of overweight: a meta-analysis. Am J Epidemiol 2005;162:397--403.
- CDC. Racial and ethnic differences in breastfeeding initiation and duration by state---National Immunization Survey, United States, 2004--2008. MMWR 2010;59:327--34.
- Philipp BL, Merewood A, Miller LW, et al. Baby-friendly hospital initiative improves breastfeeding initiation rates in a US hospital setting. Pediatrics 2001;108:677--81.
- The Keystone Forum on Away-from-Home Foods. Opportunities for preventing weight gain and obesity. Washington, DC: The Keystone Center; 2006.
- Gutin B, Barbeau P, Owens S, et al. Effects of exercise intensity on cardiovascular fitness, total body composition, and visceral adiposity in obese adolescents. Am J Clin Nutr 2002;75:818--26.
- CDC. Guidelines for school health programs to promote lifelong healthy eating. MMWR 1996;45(No. RR-9).
- US Department of Health and Human Services, US Department of Agriculture. Dietary guidelines for Americans. Washington DC: US Government Printing Office; 2005. Available at http://www.healthierus.gov/dietaryguidelines. Accessed January 18, 2011.
- Foster GD, Sherman S, Borradaile KE, et al. A policy-based school intervention to prevent overweight and obesity. Pediatrics 2008;121:e794--802.
- Economic Research Service, US Department of Agriculture. Access to affordable and nutritious food. Measuring and understanding food deserts and their consequences: report to Congress. Washington, DC: US Department of Agriculture; 2009. Available at http://www.ers.usda.gov/publications/ap/ap036. Accessed January 13, 2011.
- Karpyn A, Manon M, Treuhaft S, Giang T, Harries C, McCoubrey K. Policy solutions to the 'grocery gap'. Health Aff (Millwood) 2010;29:473--80.
This is another in a series of occasional MMWR reports titled CDC Grand Rounds. These reports are based on grand rounds presentations at CDC on high-profile issues in public health science, practice, and policy. Information about CDC Grand Rounds is available at http://www.cdc.gov/about/grand-rounds.

Alternate Text: The figure above shows the prevalence of obesity among children and adolescents, by age group, in the United States during 1963-2008. In the United States, childhood obesity affects approximately 12.5 million children and teens (17% of that population). Changes in obesity prevalence from the 1960s show a rapid increase in the 1980s and 1990s, when obesity prevalence among children and teens tripled from nearly 5% to approximately 15%.
FIGURE 2. Prevalence of obesity among children and adolescents, by sex, age group, and race/ethnicity --- United States, 2007--2008

* Additional information available at http://www.letsmove.gov/healthycommunity.php.
† Additional information available at http://www.convergencepartnership.org.
§ Additional information available at http://www.policylink.org.
¶ Additional information available at http://www.letsgo.org/resources/MYOC.php.
** Additional information available at http://www.letsgo.org.
†† Additional information available at http://www.letsmove.gov.
Alternate Text: The figure above shows the prevalence of obesity among children and adolescents, by sex, age group, and race/ethnicity, in the United States during 2007-2008. During the past 10 years, the rapid increase in obesity has slowed and might have leveled. However, among the heaviest boys, a significant increase in obesity has been observed, with the heaviest getting even heavier. Moreover, substantial racial/ethnic disparities exist, with Hispanic boys and non-Hispanic black girls disproportionately affected by obesity
FIGURE 3. Percentage of clinicians reporting that they "strongly agreed" with the use of selected practices to counter childhood obesity among their patients, before and after implementation of the Maine Youth Overweight Collaborative (MYOC) --- Maine, 2004--2006

Alternate Text: The figure above shows the percentage of clinicians reporting that they "strongly agreed" with the use of selected practices to counter childhood obesity among their patients, before and after implementation of the Maine Youth Overweight Collaborative (MYOC), during 2004-2006. Support for all five clinical practices increased substantially after implementation of MYOC.
Use of trade names and commercial sources is for identification only and does not imply endorsement by the U.S. Department of
Health and Human Services.
References to non-CDC sites on the Internet are
provided as a service to MMWR readers and do not constitute or imply
endorsement of these organizations or their programs by CDC or the U.S.
Department of Health and Human Services. CDC is not responsible for the content
of pages found at these sites. URL addresses listed in MMWR were current as of
the date of publication.
All MMWR HTML versions of articles are electronic conversions from typeset documents.
This conversion might result in character translation or format errors in the HTML version.
Users are referred to the electronic PDF version (http://www.cdc.gov/mmwr)
and/or the original MMWR paper copy for printable versions of official text, figures, and tables.
An original paper copy of this issue can be obtained from the Superintendent of Documents, U.S.
Government Printing Office (GPO), Washington, DC 20402-9371;
telephone: (202) 512-1800. Contact GPO for current prices.
**Questions or messages regarding errors in formatting should be addressed to
mmwrq@cdc.gov.
 ShareCompartir


