 |
|
|
|
|
|
|
| ||||||||||
|
|
|
|
|
|
|
||||
| ||||||||||
|
|
|
|
|
Persons using assistive technology might not be able to fully access information in this file. For assistance, please send e-mail to: mmwrq@cdc.gov. Type 508 Accommodation and the title of the report in the subject line of e-mail. Surveillance for Lyme Disease --- United States, 1992--2006Rendi Murphree Bacon, MS, Kiersten J. Kugeler, MPH, Paul S. Mead, MD
Corresponding author: Paul S. Mead, MD, Division of Vector-Borne Infectious Diseases, National Center for Zoonotic, Vector-Borne, and Enteric Diseases, CDC, 3150 Rampart Rd., MS P-O2, Fort Collins, CO 80521. Telephone: 970-221-6474; Fax: 970-221-4257; E-mail; pfm0@cdc.gov. AbstractProblem/Condition: Lyme disease is a multisystem disease that occurs in North America, Europe, and Asia. In the United States, the etiologic agent is Borrelia burgdorferi sensu stricto, a spirochete transmitted to humans by infected Ixodes scapularis and I. pacificus ticks. The majority of patients with Lyme disease develop a characteristic rash, erythema migrans (EM), accompanied by symptoms of fever, malaise, fatigue, headache, myalgia, or arthralgia. Other manifestations of infection can include arthritis, carditis, and neurologic deficits. Lyme disease can be treated successfully with standard antibiotic regimens. Reporting Period: 1992--2006. Description of System: U.S. health departments report cases of Lyme disease voluntarily to CDC as part of the National Notifiable Disease Surveillance System. Variables collected include patient age, sex, race, county and state of residence, date of illness onset, and reported signs and symptoms. Results: During 1992--2006, a total of 248,074 cases of Lyme disease were reported to CDC by health departments in the 50 states, the District of Columbia, and U.S. territories; the annual count increased 101%, from 9,908 cases in 1992 to 19,931 cases in 2006. During this 15-year period, 93% of cases were reported from 10 states (Connecticut, Delaware, Massachusetts, Maryland, Minnesota, New Jersey, New York, Pennsylvania, Rhode Island, and Wisconsin). Incidence was highest among children aged 5--14 years, and 53% of all reported cases occurred among males. More than 65% of patients with EM had illness onset in June and July, compared with 37% of patients with arthritis. Interpretation: Lyme disease is the most commonly reported vectorborne illness in the United States. The geographic distribution of cases is highly focused, with the majority of reported cases occurring in the northeastern and north-central states. During 1992--2006, the number of reported cases more than doubled. A disproportionate increasing trend was observed in children and in young males compared with other demographic groups. Public Health Action: The results presented in this report underscore the continued emergence of Lyme disease and the need for tick avoidance and early treatment interventions. Public health practitioners can use the data presented in this report to target prevention campaigns to populations with increasing incidence (i.e., children and young males). IntroductionLyme disease was first described in 1977 following investigation of a cluster of arthritis cases among children living near Lyme, Connecticut (1). Further study indicated that arthritis was a late manifestation of a multisystem, tick-transmitted disease. In 1981, a bacterial spirochete, Borrelia burgdorferi, was identified in Ixodes scapularis (2) and later demonstrated to be the etiologic agent of Lyme disease (3,4). B. burgdorferi occurs naturally in reservoir hosts, including mice, squirrels, shrews, and other small vertebrates (5). Ixodes scapularis and I. pacificus (also referred to as blacklegged or deer ticks) become infected with B. burgdorferi while feeding on the blood of natural reservoir hosts. During subsequent blood meals, the ticks can transmit infection among reservoir hosts or to incidental hosts, including humans. Although deer are not infected with B. burgdorferi, they play a role in transporting ticks and maintaining tick populations. In humans, infection with B. burgdorferi can result in dermatologic, musculoskeletal, neurologic, or cardiac abnormalities (6--8). In approximately 70%--80% of cases, patients develop a characteristic rash, erythema migrans (EM), within 30 days of infection with B. burgdorferi. EM is a red expanding rash, with or without central clearing, which often is accompanied by symptoms of fatigue, fever, headache, mild stiff neck, arthralgia, or myalgia. Within days or weeks, untreated infection can spread to other parts of the body, causing more serious neurologic conditions (e.g., meningitis, radiculopathy, and facial palsy) or cardiac abnormalities (e.g., carditis with atrioventricular heart block). Over a period of months or years, untreated infection can lead to mono- or oligoarticular arthritis, peripheral neuropathy, or encephalopathy. Lyme disease is diagnosed on the basis of physician-observed clinical manifestations and a history of probable exposure to infected ticks (8). Laboratory tests are neither suggested nor required to confirm diagnosis for patients with recent onset (2--3 weeks) of a characteristic EM rash (9). However, positive results of recommended two-tiered serologic testing (10) can provide confirmation of infection in patients with musculo-skeletal, neurologic, or cardiac symptoms. Testing methods that have not been adequately validated can be misleading (11) and are not recommended (12). The majority of infections can be cured with use of recommended antimicrobials. Patients with physician-diagnosed EM can be treated with oral doxycycline, amoxicillin, or cefuroxime axetil (7,8). Patients with other manifestations of Lyme disease are treated with either oral or intravenous antimicrobials (e.g., ceftriaxone), depending on the specific clinical condition. Measures to prevent Lyme disease and other tickborne infections include avoiding tick-infested areas when possible, using insect repellents containing 20%--30% DEET (N,N-diethyl-m-toluamide) on exposed skin and clothing, and performing daily self-examination for ticks (13). Tick abundance can be reduced around private homes and in recreational areas by removing brush and leaf litter, creating a buffer zone of wood chips or gravel between forests and lawn, applying acaricides, and excluding deer (13,14). Tickborne illness can be mitigated by prompt and proper tick removal and by recognizing and seeking treatment for early signs of illness (8,15,16). A single dose of doxycycline should be considered for prophylaxis of Lyme disease in persons aged >8 years who have been bitten by a nymph or adult I. scapularis or I. pacificus tick in an area in which at least 20% of ticks are thought to be infected with B. burgdorferi (8). The tick must have been attached for >36 hours and prophylactic antibiotic administered within 72 hours of tick removal (8). With the cooperation of state and local health departments, CDC initiated surveillance for Lyme disease in 1980; the first summary of 226 cases was published in 1981 (17). Before 1991, Lyme disease surveillance case definitions and reporting practices varied among states and between states and CDC. Standardized surveillance and reporting for Lyme disease began in 1991 after the Council of State and Territorial Epidemiologists (CSTE) designated Lyme disease as a nationally notifiable disease and published a standardized surveillance case definition* (18). This report describes the characteristics and distribution of Lyme disease cases reported in the United States during 1992--2006, providing 15-year trends and the frequency of reported symptoms. In addition, it details differences between cases reported from within and outside of the 10 states (Connecticut, Delaware, Maryland, Massachusetts, Minnesota, New Jersey, New York, Pennsylvania, Rhode Island, and Wisconsin) in which Lyme disease is highly endemic (19). These results underscore the continued emergence of Lyme disease and provide a basis for targeting prevention campaigns to populations with increasing incidence. MethodsSurveillance Case Definitions During 1991--1996, a case of Lyme disease was defined for national surveillance purposes as 1) physician-diagnosed EM of >5 cm in diameter or 2) at least one objective late manifestation (i.e. musculoskeletal, cardiovascular, or neurologic) with laboratory confirmation of infection with B. burgdorferi (18). Laboratory confirmation required 1) isolation of B. burgdorferi from clinical specimens, 2) demonstration of diagnostic levels of immunoglobulin M (IgM) and immunoglobulin G (IgG) antibodies to B. burgdorferi in serum or cerebrospinal fluid (CSF), or 3) significant change in IgM or IgG antibody response in paired serum samples. In 1997, CSTE and CDC implemented a revised surveillance case definition on the basis of the availability of improved serologic testing (20). Clinical criteria were not changed; however, laboratory confirmation was modified to require 1) isolation of B. burgdorferi from a clinical specimen or 2) demonstration of diagnostic levels of IgM or IgG antibodies to B. burgdorferi in serum or CSF. A two-test approach (a sensitive enzyme immunoassay or immunofluorescence antibody assay followed by Western blot) was recommended but not required (10). Data Sources U.S. state and territorial health departments report cases of Lyme disease voluntarily to CDC as part of the National Notifiable Disease Surveillance System (NNDSS). Provisional data are transmitted to CDC weekly using the National Electronic Telecommunications System for Surveillance, and final data are published annually in CDC's Summary of Notifiable Diseases (available at http://www.cdc.gov/mmwr). State or local health departments are responsible for ensuring that cases reported to CDC meet the case definition. This report is based on data for all Lyme disease cases reported to CDC for 1992--2006.§ During this 15-year period, state health officials used various methods to ascertain cases, including provider-initiated passive surveillance, laboratory-based surveillance, and enhanced or active surveillance. Basic demographic data (e.g., age, sex, race, and county of residence) were available for >90% of reported cases; however, information specific to Lyme disease (e.g., county of exposure, symptoms and signs, antibiotic treatment, and laboratory results) was incomplete. For example, only 61% of case reports contained data for reported signs and symptoms. Analyses Annual U.S.-, state-, county-, sex-, and age group--specific incidence rates per 100,000 population were calculated using U.S. Census Bureau population estimates for July 1 for each year of the reporting period (1992--2006). Analyses of symptom data were restricted to case reports for which at least one symptom was coded as "yes" (n = 150,829 records). Characteristics of cases reported from the 10 HP2010 reference states were compared with cases reported from all other (non-HP2010) states and territories. ResultsU.S. Case Counts and Rates During 1992--2006, a total of 248,074 Lyme disease cases were reported to CDC. Although annual counts fluctuated by as much as 57% from year to year, the overall trend indicates a steady increase in the number of reported cases (Figure 1). During the 15-year study period, the number of cases reported increased 101%, from 9,908 cases in 1992 to 19,931 cases in 2006. State Rates The 15-year mean annual rate for all states ranged from <0.01 cases per 100,000 population in Montana and Colorado to 73.6 cases per 100,000 population in Connecticut (median: 0.5 cases) (Table 1). The 10 HP2010 reference states accounted for 229,782 cases, representing 92.6% of overall cases and at least 88% of cases reported in any single year. Reported annual rates for seven HP2010 reference states (Maryland, Massachusetts, Minnesota, New Jersey, New York, Pennsylvania, and Wisconsin) were relatively stable during 1992--2006. Annual rates were more variable in three states (Connecticut, Delaware, and Rhode Island), in part because of changes in surveillance practices. In Connecticut, annual rates per 100,000 population increased from 53.7 cases in 1992 to 133.9 cases in 2002; in 2003, the rate decreased to 40.3 cases. In Delaware, the number of cases increased from 339 in 2004 to 646 in 2005, boosting the annual rate per 100,000 population from 40.9 to 76.7 cases. The annual rate per 100,000 population reported in Rhode Island increased from 27.5 cases in 1992 to 68.5 cases in 2003, then declined to 23.1 cases in 2004 and 3.6 cases in 2005; 28.9 cases were reported in 2006. County Rates County of residence was provided for 243,430 (98.1%) cases. The mean number of counties reporting at least one case of Lyme disease was 714 (range: 625--796). In all years, the percentage of counties reporting at least one case was >75 in six states (Connecticut, Delaware, Massachusetts, Maryland, New Jersey, and Rhode Island). In contrast, during 1992--2006, the percentage of counties reporting at least one case increased from 33% to 74% in Minnesota, from 79% to 97% in Pennsylvania, and from 76% to 97% in Wisconsin. In New York, the percentage of counties reporting at least one case ranged from 61% to 85%, with no obvious increasing or decreasing temporal trend. The 15-year average county-specific rate for counties reporting at least one case during 1992--2006 ranged from <0.01 cases per 100,000 population in Honolulu County, Hawaii, to 595.1 cases per 100,000 population in Nantucket County, Massachusetts (median: 0.7 cases per 100,000 population) (Figure 2). Counties with the highest average county-specific rate for three 5-year periods during the 15-year reporting period (1992--1996, 1997--2001, and 2002--2006) are presented (Table 2). Five counties ranked among the top 10 incidence counties for each 5-year period: Windham County, Connecticut; Nantucket County, Massachusetts; Hunterdon County, New Jersey; Dutchess County, New York; and Putnam County, New York. The only counties outside the northeast to rank among the top 10 counties for any 5-year period were Washburn County and Burnett County, Wisconsin. Because of marked differences in population size across counties, a high rate does not necessarily indicate a substantial number of reported cases. Selected Demographics Information regarding age was available for 241,931 (97.5%) reported cases. Reported ages ranged from <1--106 years and were bimodal in distribution (Figure 3). Average annual rates peaked among children aged 5--9 years (8.6 cases per 100,000 population) and adults aged 55--59 years (7.8 cases per 100,000 population). The lowest rate was reported among adults aged 20--24 years (3.0 cases per 100,000 population). Information about sex was available for 243,564 (99.1%) reported cases. Of these, 129,349 (53.1%) occurred among males, yielding an average annual rate per 100,000 population of 6.3 cases for males and 5.4 cases for females. During 1992--2006, rates increased disproportionately among males compared with females (Figure 4). This trend was most pronounced among persons aged 5--19 years; rates per 100,000 population in this age group increased 194% in males, from 3.5 cases in 1992 to 10.3 cases in 2006, and 114% in females, from 2.9 cases in 1992 to 6.2 cases in 2006. Information regarding race was available for 166,194 (70.0%) reported cases. Of these, 156,346 (94.1%) patients were identified as white, 2,765 (1.7%) as black, 1,299 (0.8 %) as Asian/Pacific Islander, and 452 (0.3%) as American Indian/Alaska Native. Age and sex of persons with Lyme disease differed among the 10 HP2010 reference states compared with other states. In the reference states, the modal age was 7 years, and males accounted for 120,369 (53.4%) reported cases. In the remaining states, the modal age was 44 years, and males accounted for 8,890 (49.4%) cases. Seasonality Month of disease onset was available for 188,340 (75.9%) reported cases (Figure 5). Although cases occurred in all months of the year; the majority (48,413 [25.7%]) of patients had onset in June, July (56,507 [30.0%]), or August (22,867 [12.1%]), the 3 months in which ticks actively seek mammalian hosts and human outdoor activity is greatest. In the HP2010 reference states, 99,762 (56.5%) cases had onset during June or July, compared with 5,518 (44.2%) among non-HP2010 reference states. Among 150,829 cases with reported clinical features, seasonal variation was most pronounced for cases with EM (Figure 6). Approximately 67% of patients with EM had onset in June and July, compared with 37% of those with arthritis. Clinical Features Information on clinical features of illness was available for 150,829 (60.8%) cases. Among these, EM was reported for 104,387 (69.2%) cases, arthritis characterized by brief attacks of joint swelling for 48,272 (32.0%) cases, neurologic symptoms (facial palsy or cranial neuritis, radiculoneuropathy, lymphocytic meningitis, encephalitis, or encephalomyelitis) for 18,157 (12.0%) cases, and second- or third-degree atrioventricular block for 1,222 (0.8%) cases. More than one clinical manifestation was reported for 19,321 (12.8%) cases. Data on clinical features of cases from all states was representative of data on clinical features of cases from the HP2010 reference states. By comparison, among 7,745 cases reported from non-HP2010 states, EM was reported less frequently (4,887 cases [63.0%]), and musculoskeletal, neurologic, and cardiac manifestations were reported more frequently (3,285 cases [42.4%], 1,442 cases [18.6%], and 100 cases [1.3%], respectively). Temporal trends in national data indicate that the overall frequency of reported clinical features were generally stable over time (Figure 7). However, the frequency of reported symptoms was highly variable across the youngest age categories (Figure 8) and among HP2010 reference states (Table 3). DiscussionDuring 1992--2006, the annual number of Lyme disease cases reported to CDC increased considerably, while remaining highly focused in northeastern and north-central states. Multiple reasons might explain this increase, including a true increase in the number of infections, enhanced surveillance, increased awareness among health-care professionals and the public, misdiagnosis, and reporting errors (21--23). In six HP2010 reference states (Connecticut, Delaware, Massachusetts, Maryland, New Jersey, and Rhode Island) in which the majority of counties regularly reported cases, a true increase in transmission might have resulted from greater tick densities and encroachment of human development into rural and suburban areas. In other HP2010 reference states, particularly Minnesota, Pennsylvania, and Wisconsin, the number of counties reporting cases increased appreciably, suggesting an additional role for geographic expansion of reservoir mammals and vector ticks into new areas. In certain states, especially those in the southeastern United States, Lyme disease surveillance is complicated by the occurrence of southern tick-associated rash illness, a condition that can resemble early Lyme disease but is not caused by B. burgdorferi (24--26). Overall, features of reported cases changed little over time. Peak rates were reported among children, males, and whites in each year throughout the 15-year period. However, rates increased disproportionately among young males compared with young females; the reasons for this difference are not known. The proportion of cases with EM and arthritis, the most commonly reported symptoms, has been relatively stable since 1993. However, across age categories, the frequency of reported symptoms varied widely among persons aged <20 years, with the lowest percentage of EM (58.2%) and the highest percentage of arthritis (38.7%) reported for children aged 10--14 years. These findings provide a basis for targeting prevention campaigns to populations with increasing incidence. The findings in this report highlight both the benefits of infectious disease surveillance and the opportunity for improvement. Detailed analysis of reported cases enables public health authorities to define the demographics and distribution of disease and to survey trends. However, growing case counts and the implementation of electronic laboratory reporting have created a substantial reporting burden on certain state and local health departments as they attempt to verify compliance with the surveillance case definition (27,28). This burden has caused certain states to curtail or modify portions of their surveillance system, resulting in fluctuations in case tallies. In 2007, CSTE revised the national surveillance case definition for Lyme disease with the twin goals of reducing the burden of reporting while potentially enhancing the system's ability to capture a broader range of clinical manifestations. The revised case definition, which was implemented in January 2008, specifies required laboratory evidence in more detail than previous iterations and allows reporting of confirmed and, for the first time, probable cases of Lyme disease to CDC (29). Limitations The findings in this report are subject to at least three limitations. First, an unknown portion of all Lyme disease cases are reported; cases probably are underreported in areas in which the disease is endemic and overreported in areas in which the disease is not endemic. Misdiagnosis and overreporting from areas in which the disease is not endemic might explain the demographic differences noted between cases reported from HP2010 and non-HP2010 reference states. Second, variation in reporting practices and adherence to the surveillance case definition occurs among states, in part because states invest unequally in infrastructure for Lyme disease surveillance. As a result, Lyme disease--specific variables for cases reported by certain states are incomplete, unavailable, or not transmitted to CDC. Finally, cases are reported on the basis of the patient's state of residence rather than on the state in which the exposure occurred. Therefore, Lyme disease in a traveler returning from an area in which the disease is highly endemic cannot be construed as evidence of local transmission. ConclusionThe number of reported cases of Lyme disease continues to increase, underscoring the need for targeted prevention strategies, early disease recognition and treatment, and a sustainable surveillance system. During the 15-year study period, incidence increased disproportionately among children, particularly males. Geographic expansion was apparent in Minnesota, Pennsylvania, and Wisconsin. Differences in the features of cases reported from HP2010 reference states and all other states suggest either aberrant reporting or fundamental differences in the epidemiology of Lyme disease in areas in which the disease is not endemic. The percentage of cases for which signs of disseminated infection were reported did not decrease during the reporting period, underscoring the need for continued education about early disease recognition and treatment. Despite the limitations of national surveillance data, these findings are useful in defining demographics, distribution, and trends in Lyme disease cases. Intensive surveillance methodologies, such as active population-based surveillance and the use of nonhuman data (e.g., serologic testing of dogs and surveillance for vectors), could be used to augment these data and provide a better understanding of this emerging infectious disease. Acknowledgments The data provided in this report were collected and reported by state, territorial, and local health departments, health-care providers, and laboratories. References
* The Lyme disease surveillance case definition was developed to standardize national public health surveillance and reporting of Lyme disease cases; it is not meant to be used as absolute criteria for clinical diagnosis. In 2000, these 10 states were defined as Healthy People 2010 (HP2010) Lyme disease reference states. A Healthy People 2010 goal (objective no. 14-8) is to reduce Lyme disease to 9.7 new cases per 100,000 population in the 10 HP2010 reference states (19) through the implementation of community-based prevention programs, host-targeted acaricides to reduce the numbers of vector ticks, and appropriate use of Lyme disease vaccine. However, the only vaccine approved by the Food and Drug Administration for use against Lyme disease in humans was removed from sale by the manufacturer in February 2002 citing low demand, greatly reducing the possibility of achieving this objective. § Although data for 1991 were available, these data were excluded from the analysis because certain states reported aggregate case counts rather than information for individual case reports. Table 1 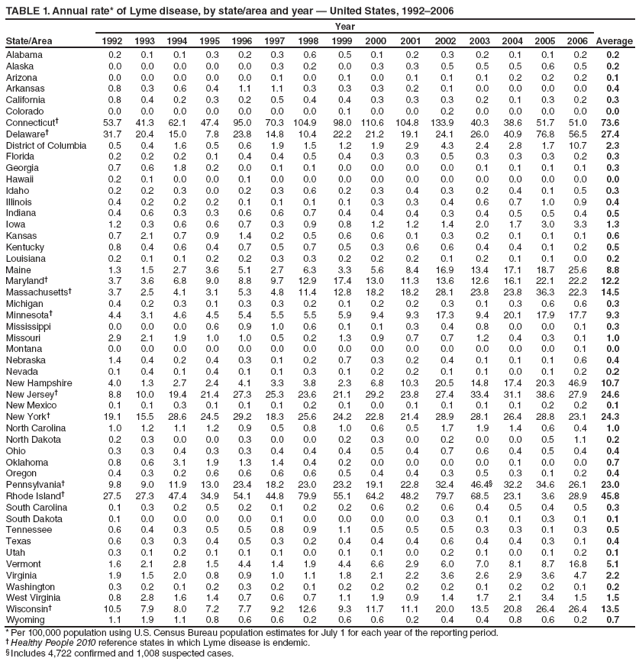 Return to top. Figure 1 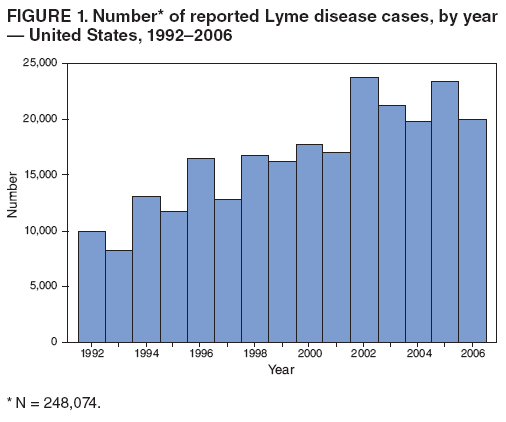 Return to top. Table 2  Return to top. Figure 2 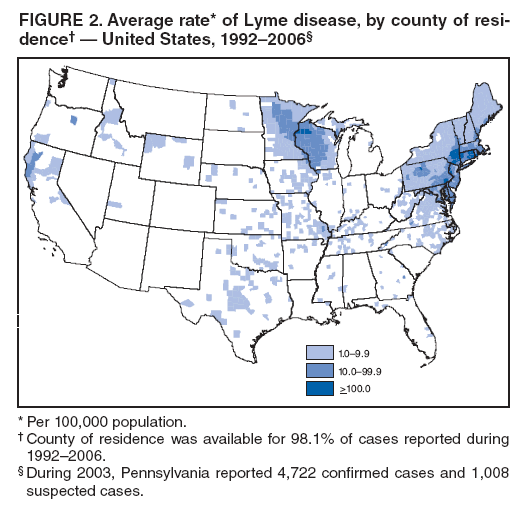 Return to top. Table 3 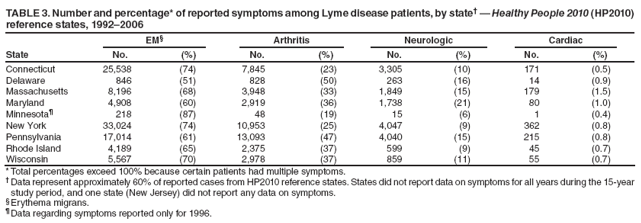 Return to top. Figure 3 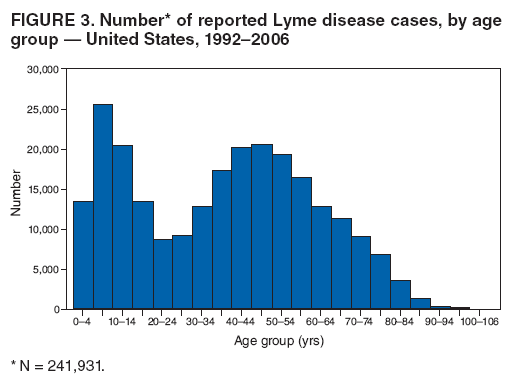 Return to top. Figure 4 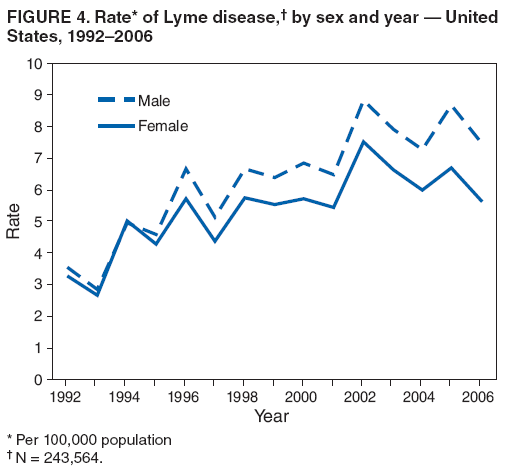 Return to top. Figure 5 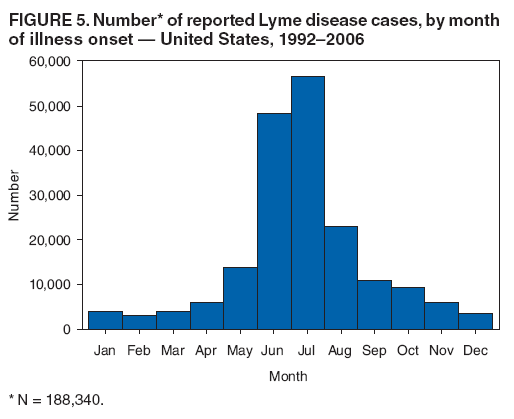 Return to top. Figure 6 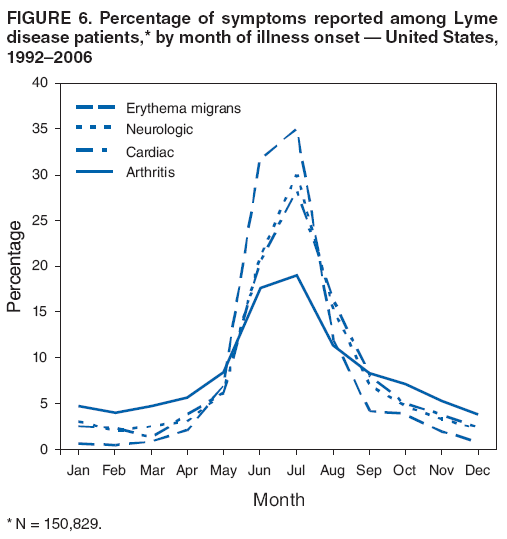 Return to top. Figure 7 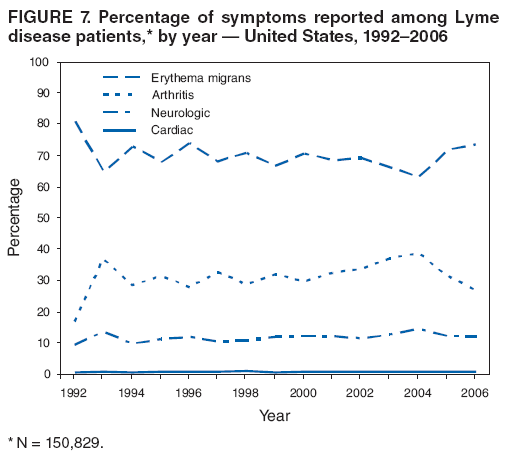 Return to top. Figure 8 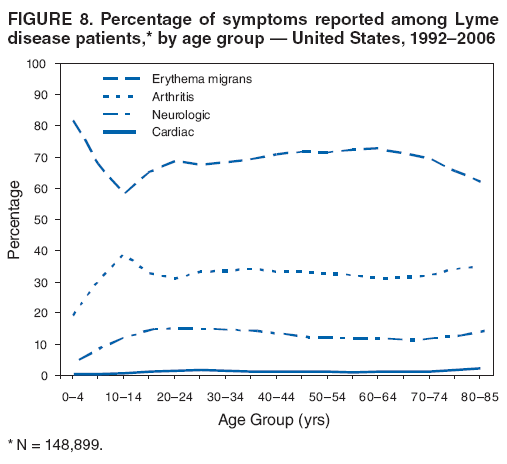 Return to top.
All MMWR HTML versions of articles are electronic conversions from typeset documents. This conversion might result in character translation or format errors in the HTML version. Users are referred to the electronic PDF version (http://www.cdc.gov/mmwr) and/or the original MMWR paper copy for printable versions of official text, figures, and tables. An original paper copy of this issue can be obtained from the Superintendent of Documents, U.S. Government Printing Office (GPO), Washington, DC 20402-9371; telephone: (202) 512-1800. Contact GPO for current prices. **Questions or messages regarding errors in formatting should be addressed to mmwrq@cdc.gov.Date last reviewed: 9/24/2008 |
|||||||||
|