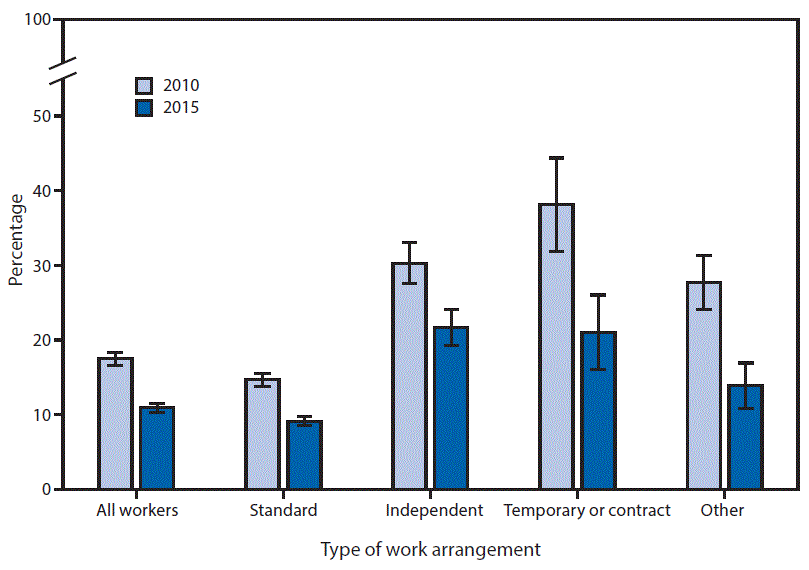
QuickStats: Percentage* of Currently Employed Adults† with No Health Insurance,§ by Type of Work Arrangement¶ — National Health Interview Survey, 2010 and 2015**
Weekly / August 18, 2017 / 66(32);864

* With 95% confidence intervals indicated with error bars.
† Persons working for pay at a job or business, being with a job or business but not at work, or working not for pay at a family-owned job or business a week before the time of the interview.
§ Persons having no health insurance at the time of the interview under private health insurance, Medicare, Medicaid, a state-sponsored health plan, other government programs, or military health plan.
¶ Based on responses to a question that asked, “The next question refers to your current, main job. Which of the following best describes your work arrangement?” The responses were classified into four categories: 1) Standard: a regular, permanent employee, 2) Independent: work as an independent contractor, independent consultant or freelance worker, 3) Temporary or contract: paid by a temporary agency or work for a contractor who provides workers and services to others under contract), 4) Other: some other work arrangement.
** Estimates were based on a sample of the U.S. civilian, noninstitutionalized population aged ≥18 years. Adults who were not currently employed at the time of interview were not included in the denominators when calculating percentages.
The percentage of all workers with no health insurance decreased from 17.5% in 2010 to 10.9% in 2015. The percentage also declined in each type of work arrangement. In 2015, independent workers (21.7%) or temporary/contract workers (21.0%) were more likely to lack health insurance than workers with a standard work arrangement (9.1%).
Source: National Health Interview Survey. https://www.cdc.gov/nchs/nhis/index.htm.
Reported by: Sara E. Luckhaupt, MD, SLuckhaupt@cdc.gov, 513-841-4123; Abay Asfaw, PhD; Sara L. Tamers, PhD; Chia-ping Su, MD.
Suggested citation for this article: QuickStats: Percentage of Currently Employed Adults with No Health Insurance, by Type of Work Arrangement — National Health Interview Survey, 2010 and 2015. MMWR Morb Mortal Wkly Rep 2017;66:864. DOI: http://dx.doi.org/10.15585/mmwr.mm6632a9.
Use of trade names and commercial sources is for identification only and does not imply endorsement by the U.S. Department of
Health and Human Services.
References to non-CDC sites on the Internet are
provided as a service to MMWR readers and do not constitute or imply
endorsement of these organizations or their programs by CDC or the U.S.
Department of Health and Human Services. CDC is not responsible for the content
of pages found at these sites. URL addresses listed in MMWR were current as of
the date of publication.
All HTML versions of MMWR articles are generated from final proofs through an automated process. This conversion might result in character translation or format errors in the HTML version. Users are referred to the electronic PDF version (https://www.cdc.gov/mmwr) and/or the original MMWR paper copy for printable versions of official text, figures, and tables.
Questions or messages regarding errors in formatting should be addressed to mmwrq@cdc.gov.
- Page last reviewed: August 17, 2017
- Page last updated: August 17, 2017
- Content source:


 ShareCompartir