Blood Folate Levels: The Latest NHANES Results
NCHS Data Brief No. 6, May 2008
On this Page
- Key findings
- Have levels of RBC folate, a measure of long-term body stores changed since NHANES III?
- Has the prevalence of low RBC folate improved since NHANES III?
- Did NHANES 2005-2006 RBC folate levels differ by sex and age?
- Were there race and ethnicity differences in median RBC folate levels of women of childbearing age in 2005-2006?
- Have median serum folate levels, a measure of recent folate intake, changed since NHANES III?
- Has the prevalence of low serum folate improved since 1988-1994?
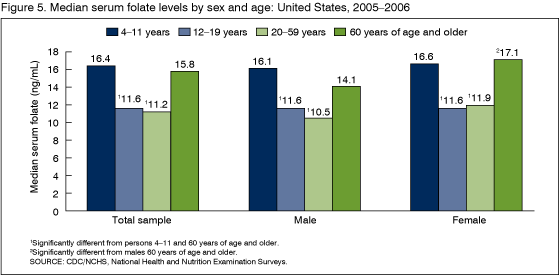
- Did median serum folate levels differ by sex and age in 2005-2006?
- Did median serum folate levels of women of childbearing age vary by race and ethnicity group in 2005-2006?
- Summary
- Definitions
- Data source and methods
- About the authors
- References
- Appendix
PDF Version (470 KB)
by Margaret A. McDowell, M.P.H., R.D.; David A. Lacher, M.D.; Christine M. Pfeiffer, Ph.D.; Joseph Mulinare, M.D., M.S.P.H.; Mary Frances Picciano, Ph.D.; Jeanne I. Rader, Ph.D.; Elizabeth A. Yetley, Ph.D.; Jocelyn Kennedy-Stephenson, M.S.; and Clifford L. Johnson, M.S.P.H.
Key Findings
Data from the National Health and Nutrition Examination Surveys
- Very large increases in blood folate levels of the U.S. population occurred between 1988-1994 and 1999-2000. Small fluctuations in blood folate levels occurred over the time period 1999-2006.
- The median red blood cell (RBC) folate level of the U.S. population 4 years of age and older was 266 ng/mL in 2005-2006.
- The median serum folate level of the U.S. population 4 years of age and older was 12.2 ng/mL in 2005-2006.
- In 2005-2006, the prevalence of low RBC folate (less than 140 ng/mL) among U.S. women of childbearing age (15-45 years) was 4.5%.
- In 2005-2006, the prevalence of low serum folate (less than 3 ng/mL) among U.S. women of childbearing age was 0.3%.
Folate is an essential vitamin for good health. Women of childbearing age are among the population subgroups that have been shown previously to have low blood folate levels (1,2). Low blood folate levels are associated with an increased risk of neural tube birth defects. Beginning in 1998, the Food and Drug Administration (FDA) required the addition of folic acid (a form of folate) to all enriched breads, cereals, flours, corn meal, pasta products, rice, and other cereal grain products sold in the United States (3). Blood folate data from the National Health and Nutrition Examination Surveys (NHANES) have documented improvements in the folate status of the U.S. population after folate fortification was implemented (4). Red blood cell (RBC) folate measures long-term folate intake and low levels are associated with adverse health effects. Serum folate reflects recent folate intake and low levels are an early indicator of inadequate folate status. Pre- and postfortification blood folate levels of the U.S. population 4 years of age and older and prevalence of low blood folate among women of childbearing age (15-45 years) are reported.
Keywords: folic acid fortification, prevalence, red blood cell folate, serum folate, survey, trends, National Health and Nutrition Examination Surveys
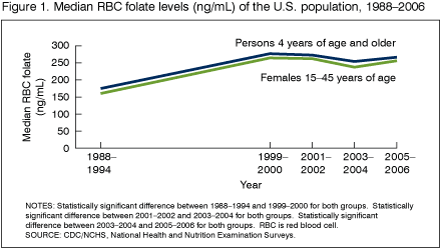
Have levels of RBC folate, a measure of long-term body stores changed since NHANES III (1988-1994)?
Median RBC folate levels increased between 1988 and 1994 (prefortification) and 1999 and 2000 (postfortification) followed by small fluctuations between 1999-2000 and 2005-2006.
Median RBC folate levels of persons 4 years of age and older increased nearly 60%, from 174 ng/mL to 276 ng/mL between 1988-1994 and 1999-2000. The NHANES 2005-2006 value is 266 ng/mL.
Median RBC folate levels of women of childbearing age increased 65%, from 160 ng/mL to 264 ng/mL between 1988-1994 and 1999-2000. The NHANES 2005-2006 value is 257 ng/mL.
Has the prevalence of low RBC folate (less than 140 ng/mL) improved since NHANES III (1988-1994)?
The prevalence of low RBC folate in the U.S. population 4 years of age and older declined from 30.4% in 1988-1994 to 2.8% in 1999-2000 and rates have remained low since that time.
Low RBC folate is of particular concern for women of childbearing age. The prevalence of low RBC folate among U.S. women of childbearing age declined from 37.6% in 1988-1994 to 5.1% in 1999-2000. The 2005-2006 value was 4.5%.
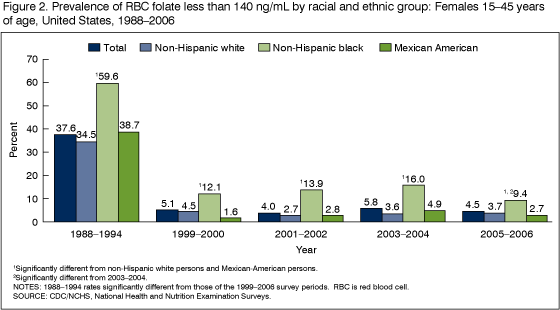
The prevalence of low RBC folate was consistently higher among non-Hispanic black women compared with non-Hispanic white and Mexican-American women. Significant improvements have been made in the RBC folate status of all race and ethnicity groups. Among non-Hispanic black women, the prevalence of low RBC folate declined from 59.6% in 1988-1994 to 12.1% in 1999-2000. During the same time period, the prevalence of low RBC folate declined from 34.5% to 4.5% among non-Hispanic white women and from 38.7% to 1.6% among Mexican-American women.
In 2005-2006, the prevalence of low RBC folate was 9.4% for non-Hispanic black, 3.7% for non-Hispanic white, and 2.7% for Mexican-American women.
Did NHANES 2005-2006 RBC folate levels differ by sex and age?
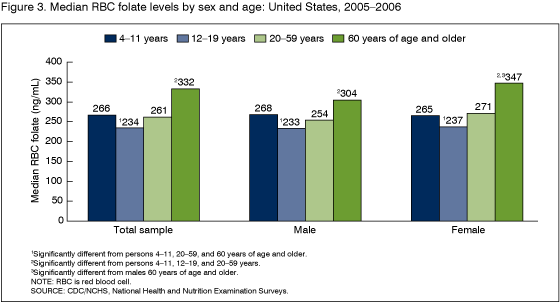
Median RBC folate levels varied by sex and age.
RBC folate levels were lowest among adolescents 12-19 years of age and highest among adults 60 years of age and older.
Females 60 years of age and older had higher median RBC folate levels (347 ng/mL) compared with males 60 years of age and older (304 ng/mL).
Were there race and ethnicity differences in median RBC folate levels of women of childbearing age in 2005-2006?
Median RBC folate levels of women of childbearing age varied by race and ethnicity.
The median RBC folate level of non-Hispanic black women (210 ng/mL) was significantly lower compared with non-Hispanic white and Mexican-American women, whereas the median levels of non-Hispanic white (272 ng/mL) and Mexican-American (252 ng/mL) women were similar.
Have median serum folate levels, a measure of recent folate intake, changed since NHANES III (1988-1994)?
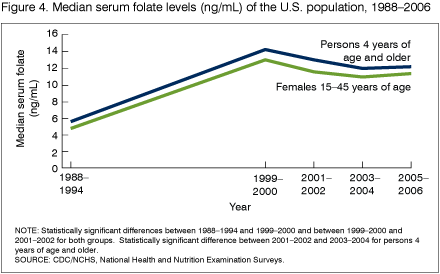
Median serum folate levels nearly tripled for the U.S. population 4 years of age and older from 5.5 ng/mL in 1988-1994 (prefortification) to 14.2 ng/mL in 1999-2000 (postfortification).
After a modest decline in median serum folate levels from 1999-2000 through 2003-2004, the 2005-2006 estimate of 12.2 ng/mL shows no change since the previous 2-year period.
Median serum folate levels of women of childbearing age (15-45 years) increased from 4.8 ng/mL in 1988-1994 to 13.0 ng/mL in 1999-2000. The NHANES 2005-2006 value is 11.4 ng/mL.
Has the prevalence of low serum folate (less than 3 ng/mL) improved since 1988-1994?
The prevalence of low serum folate in the U.S. population 4 years of age and older declined from 15.5% in 1988-1994 to 0.5% in 1999-2000 and rates have remained below 1% since that time.
The prevalence of low serum folate among women of childbearing age declined from 20.6% in 1988-1994 to 0.8% in 1999-2000. The prevalence of low serum folate has remained low and stable among women of childbearing age between 1999-2000 and 2005-2006.
There were no race and ethnicity differences in the prevalence of low serum folate among women of childbearing age in 2005-2006. The prevalence of low serum folate was 0.3% overall and the rates were 0.4% for Mexican-American women, 0.0% for non-Hispanic black women, and 0.4% for non-Hispanic white women.
Did median serum folate levels differ by sex and age in 2005-2006?
Serum folate levels were highest in young children and older adults; median serum folate was significantly higher in children 4-11 years of age and adults 60 years of age and older compared with adolescents 12-19 years of age and adults 20-59 years of age.
Females 60 years of age and older had the highest median serum folate level (17.1 ng/mL) and their serum folate level was significantly higher compared with their male counterparts (14.1 ng/mL).
Did median serum folate levels of women of childbearing age (15-45 years) vary by race and ethnicity group in 2005-2006?
Non-Hispanic white women had significantly higher median serum folate (11.8 ng/mL) compared with non-Hispanic black (9.8 ng/mL) and Mexican-American women (10.4 ng/mL).
Summary
The NHANES data demonstrate that measures of folate status that reflect both short-term and long-term folate intake have improved. The median serum and RBC folate levels of the U.S. population 4 years of age and older and of women of childbearing age have increased significantly over the time period from 1988 to 2006. The large increases in blood folate levels that occurred between 1988-1994 and 1999-2000 were followed by small fluctuations from 1999 to 2006.
In addition to the overall trends in blood folate, the most recent NHANES data also showed that the prevalence of low blood folate has improved among women of childbearing age. The prevalence of low serum folate among women of childbearing age was very low in all racial and ethnic groups and significant reductions in the prevalence of low RBC folate have also occurred in all racial and ethnic subgroups. Government agencies, health care organizations, and health care providers are continuing to work together to educate consumers, particularly minority women of childbearing age, to consume adequate amounts of folate.
Definitions
Folate: a water-soluble B vitamin that is found in many foods.
Folic acid: Folic acid is the synthetic form of folate that is found in dietary supplements and added to enriched flour and grain products such as breads, pasta, rice, and cereals.
Median value: The 50th percentile value of the distribution. One-half of the sample (or population) is above the median value and one-half is below the value.
Neural tube defect: A group of birth defects that are caused by incomplete development of the brain, spinal cord, or their protective coverings. Spina bifida is one of the most common types of neural tube defects.
Data source and methods
The National Health and Nutrition Examination Survey (NHANES) data (5) were used for all of the analyses presented in this data brief. NHANES is conducted by the Centers for Disease Control and Prevention's (CDC), National Center for Health Statistics, to monitor the health and nutritional status of the U.S. population. The annual NHANES samples are composed of the civilian, noninstitutionalized U.S. household population. The annual samples are selected using a complex, multistage sampling method that includes the selection of primary sampling units (counties), household segments within the counties, and sample persons from selected households. Prior to 1999, NHANES data were collected periodically. NHANES became a continuous annual survey in 1999.
Every year approximately 5,000 infants, children, and adults from the United States are selected to participate in NHANES. The NHANES sample design includes oversampling in order to produce reliable estimates of health and nutritional measures for population subgroups. In 1999-2006, the oversampled groups included black and Mexican-American persons, persons with low income, adolescents 12-19 years of age, and adults 60 years of age and older.
Survey participants are asked to complete the household interview and health examination components of the survey. The laboratory component of the health examination includes an extensive array of laboratory tests that are performed on blood, urine, and other types of specimens. CDC's National Center for Environmental Health Laboratory in Atlanta, Ga., performed the serum and RBC folate analyses for NHANES III and NHANES 1999-2006. The folate analysis methodology and quality assurance provisions are described in the NHANES Laboratory Procedures Manuals for each of the 2-year survey cycles (6-9). An earlier report examined U.S. blood folate trends and methodological considerations for their interpretation (4).
The NHANES examination sample weights were used for all of the data analyses reported. The survey sample weights account for the differential probabilities of selection, nonresponse, and noncoverage. The standard errors of the percentages were estimated using Taylor series linearization, a method that incorporates the sample weights and sample design (10). Differences between groups were evaluated using a univariate t-statistic. Trend tests were performed to evaluate changes in blood folate levels over time. Trends were examined using log-transformed data because the blood folate distributions were skewed. All significance tests were two-sided using p < 0.05 as the level of statistical significance. All data analyses were performed using the statistical packages SAS version 9.1 (SAS Institute, Cary, N.C.) and SUDAAN version 9.0 (RTI, Research Triangle Park, N.C.).
About the authors
Margaret A. McDowell, David A. Lacher, and Clifford L. Johnson are with the Centers for Disease Control and Prevention's (CDC) National Center for Health Statistics, Division of Health and Nutrition Examination Surveys; Christine M. Pfeiffer is with CDC's National Center for Environmental Health, Division of Laboratory Sciences; Joseph Mulinare is with CDC's National Center for Birth Defects and Developmental Disabilities, Division of Birth Defects and Developmental Disabilities; Mary Frances Picciano and Elizabeth A. Yetley are with the National Institutes of Health, Office of Dietary Supplements; Jeanne I. Rader is with the Food and Drug Administration, Division of Bioanalytical Chemistry, Center for Food Safety and Applied Nutrition; and Jocelyn Kennedy-Stephenson is with the Northrop Grumman Corporation under contract to CDC's National Center for Health Statistics.
References
- Senti FR, Pich SM. Analysis of folate data from the second National Health and Nutrition Examination Survey (NHANES II). J Nutr 115:1398-402. 1985.
- Wright JD, Bialostosky K, Gunter EW, et al. Blood folate and vitamin B12: United States, 1988-1994. National Center for Health Statistics. Vital Health Stat 11 (243):1-78. 1998.
- Food and Drug Administration. Food standards: Amendment of standards of identity for enriched grain products to require addition of folic acid. Final Rule. Federal Register 61(44):8781-97. 1996.
- Pfeiffer CM, Johnson CL, Jain RB, Yetley EA, Picciano MF, Rader JI, et al. Trends in blood folate and vitamin B-12 concentrations in the United States, 1988-2004. Am J Clin Nutr. 86(3):718-27. 2007.
- Centers for Disease Control and Prevention, National Center for Health Statistics. Datasets and Related Documentation. Available from: NHANES Questionnaires, Datasets, and Related Documentation [Accessed January 29, 2008.]
- Centers for Disease Control and Prevention, National Center for Health Statistics. Laboratory Manuals and Procedures for NHANES 1999-2000. Available from: NHANES 1999-2000 Laboratory Files [Accessed January 29, 2008].
- Centers for Disease Control and Prevention, National Center for Health Statistics. Laboratory Manuals and Procedures for NHANES 2001-2002. [Accessed January 29, 2008].
- Centers for Disease Control and Prevention, National Center for Health Statistics. Laboratory Manuals and Procedures for NHANES 2003-2004. [Accessed January 29, 2008].
- Centers for Disease Control and Prevention, National Center for Health Statistics. Laboratory Manuals and Procedures for NHANES 2005-2006. [Accessed January 29, 2008].
- National Center for Health Statistics. The National Health and Nutrition Examination Surveys (NHANES) Analytic and Reporting Guidelines. Updated September 2006. [Accessed January 29, 2008].
Suggested citation
McDowell MA, Lacher DA, Pfeiffer CM, Mulinare J, Picciano MF, Rader JI, et al. Blood folate levels: The latest NHANES results. NCHS data briefs, no. 6, Hyattsville, MD: National Center for Health Statistics. 2008.
Copyright information
All material appearing in this report is in the public domain and may be reproduced or copied without permission; citation as to source, however, is appreciated.
National Center for Health Statistics
Director - Edward J. Sondik, Ph.D.
Acting Co-Deputy Directors - Jennifer H. Madans, Ph.D, and Michael H. Sadagursky
Appendix
Table 1. Median RBC folate levels (ng/mL) of the U.S. population 4 years and older: United States, 1988-1994 and 1999-2006
| Survey period | N | Median | 95% confidence interval |
|---|---|---|---|
| 1988-1994 | 23,402 | 174 | (169, 180) |
| 1999-2000 | 7,491 | 276 | (267, 290) |
| 2001-2002 | 8,336 | 274 | (265, 281) |
| 2003-2004 | 7,700 | 254 | (247, 263) |
| 2005-2006 | 7,752 | 266 | (263, 271) |
NOTES: Data table for Figure 1. RBC is red blood cell.
SOURCE: CDC/NCHS, National Health and Nutrition Examination Survey.
Table 2. Median RBC folate levels (ng/mL) of females 15-45 years of age: United States, 1988-1994 and 1999-2006
| Survey period | N | Median | 95% confidence interval |
|---|---|---|---|
| 1988-1994 | 5,371 | 160 | (154, 169) |
| 1999-2000 | 1,702 | 264 | (246, 286) |
| 2001-2002 | 1,932 | 263 | (252, 276) |
| 2003-2004 | 1,666 | 238 | (229, 250) |
| 2005-2006 | 1,863 | 257 | (250, 267) |
NOTES: Data table for Figure 1. RBC is red blood cell.
SOURCE: CDC/NCHS, National Health and Nutrition Examination Survey.
Table 3. Rates of low RBC folate among females 15-45 years of age by race-ethnicity group: United States, 1988-1994 and 1999-2006
| Total sample | Non-Hispanic white | Non-Hispanic black | Mexican American | ||||||
|---|---|---|---|---|---|---|---|---|---|
| Survey period | N | Percent | 95% confidence interval | Percent | 95% confidence interval | Percent | 95% confidence interval | Percent | 95% confidence interval |
| 1988-1994 | 5,371 | 37.6 | (34.4, 40.9) | 34.5 | (30.6, 38.6) | 59.6 | (56.5, 62.6) | 38.7 | (33.4, 44.2) |
| 1999-2000 | 1,702 | 5.1 | (3.3, 7.7) | 4.5 | (2.2, 9.0) | 12.1 | (7.4, 19.1) | 1.6 | (0.6, 4.0) |
| 2001-2002 | 1,932 | 4.0 | (2.6, 6.1) | 2.7 | (1.2, 6.0) | 13.9 | (9.4, 20.0) | 2.8 | (1.3, 5.9) |
| 2003-2004 | 1,666 | 5.8 | (4.7, 7.1) | 3.6 | (2.7, 4.7) | 16.0 | (11.8, 21.3) | 4.9 | (2.9, 8.2) |
| 2005-2006 | 1,863 | 4.5 | (3.5, 5.8) | 3.7 | (2.4, 5.6) | 9.4 | (6.2, 13.9) | 2.7 | (1.4, 5.3) |
NOTES: Data table for Figure 2. RBC is red blood cell.
SOURCE: CDC/NCHS, National Health and Nutrition Examination Survey.
Table 4. Median RBC folate levels (ng/mL) of the U.S. population 4 years of age and older by sex and age group: United States, 2005-2006
| Total sample | Male | Female | |||||
|---|---|---|---|---|---|---|---|
| Age | N | Median | 95% confidence interval | Median | 95% confidence interval | Median | 95% confidence interval |
| All persons 4 years and older | 7,752 | 266 | (263, 271) | 259 | (254, 265) | 274 | (268, 283) |
| 4-11 years | 1,268 | 266 | (262, 272) | 268 | (262, 275) | 265 | (258, 273) |
| 12-19 years | 1,987 | 234 | (227, 241) | 233 | (224, 241) | 237 | (228, 243) |
| 20-59 years | 3,083 | 261 | (256, 269) | 254 | (246, 262) | 271 | (263, 280) |
| 60 years and older | 1,414 | 332 | (314, 346) | 304 | (290, 325) | 347 | (329, 372) |
NOTES: Data table for Figure 3. RBC is red blood cell.
SOURCE: CDC/NCHS, National Health and Nutrition Examination Survey.
Table 5. Median serum folate levels (ng/mL) of the U.S. population 4 years and older: United States, 1988-1994 and 1999-2006
| Survey period | Sample size | Median | 95% confidence interval |
|---|---|---|---|
| 1988-1994 | 23,361 | 5.5 | ( 5.2, 5.7) |
| 1999-2000 | 7,411 | 14.2 | (13.4, 14.9) |
| 2001-2002 | 8,242 | 13.0 | (12.6, 13.4) |
| 2003-2004 | 7,692 | 11.9 | (11.5, 12.4) |
| 2005-2006 | 7,639 | 12.2 | (11.9, 12.7) |
NOTES: Data table for Figure 4. RBC is red blood cell.
SOURCE: CDC/NCHS, National Health and Nutrition Examination Survey.
Table 6. Median serum folate levels (ng/mL) of females 15-45 years of age: United States, 1988-1994 and 1999-2006
| Survey period | Sample size | Median | 95% confidence interval |
|---|---|---|---|
| 1988-1994 | 5,373 | 4.8 | (4.5, 5.2) |
| 1999-2000 | 1,694 | 13.0 | (12.0, 14.2) |
| 2001-2002 | 1,917 | 11.6 | (11.3, 12.2) |
| 2003-2004 | 1,655 | 10.8 | (10.3, 11.3) |
| 2005-2006 | 1,847 | 11.4 | (10.9, 11.9) |
NOTE: Data table for Figure 4.
SOURCE: CDC/NCHS, National Health and Nutrition Examination Survey.
Table 7. Median serum folate levels (ng/mL) of the U.S. population 4 years of age and older by sex and age group: United States, 2005-2006
| Total sample | Male | Female | |||||
|---|---|---|---|---|---|---|---|
| Age | N | Median | 95% confidence interval | Median | 95% confidence interval | Median | 95% confidence interval |
| All persons 4 years and older | 7,639 | 12.2 | (11.9, 12.7) | 11.6 | (11.2, 12.0) | 13.2 | (12.6, 13.8) |
| 4-11 years | 1,212 | 16.4 | (15.9, 17.1) | 16.1 | (15.4, 16.9) | 16.6 | (16.0, 17.6) |
| 12-19 years | 1,970 | 11.6 | (11.2, 12.1) | 11.6 | (11.3, 12.0) | 11.6 | (11.0, 12.3) |
| 20-59 years | 3,060 | 11.2 | (10.8, 11.6) | 10.5 | (10.2, 11.0) | 11.9 | (11.5, 12.5) |
| 60 years and older | 1,397 | 15.8 | (15.0, 16.8) | 14.1 | (12.5, 15.6) | 17.1 | (16.2, 18.0) |
NOTE: Data table for Figure 5.
SOURCE: CDC/NCHS, National Health and Nutrition Examination Survey.
- Page last reviewed: November 6, 2015
- Page last updated: January 19, 2010
- Content source:


 ShareCompartir