Marital Status is Associated With Health Insurance Coverage for Working-age Women at all Income Levels, 2007
NCHS Data Brief No. 11, December 2008
PDF Version (453 KB)
by Amy B. Bernstein, Sc.D.; Robin A. Cohen, Ph.D.; Kate M. Brett, Ph.D.; and Mary Ann Bush, M.S.
Key findings
Data from the National Health Interview Survey
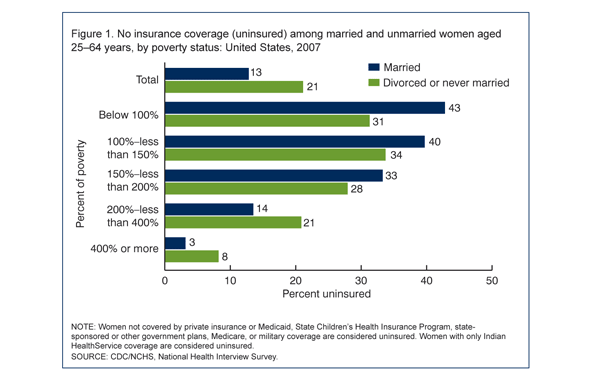
- Overall, unmarried (divorced or never married) women aged 25-64 years are more likely to be uninsured (21%) than married women (13%) in the same age group..
- Poor married women are more likely to be uninsured than poor unmarried women, in part because they are less likely to have Medicaid coverage.
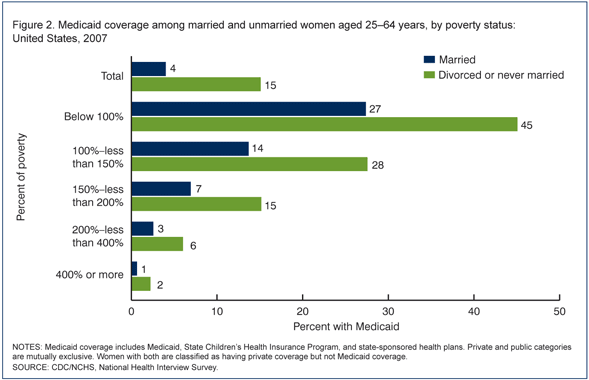
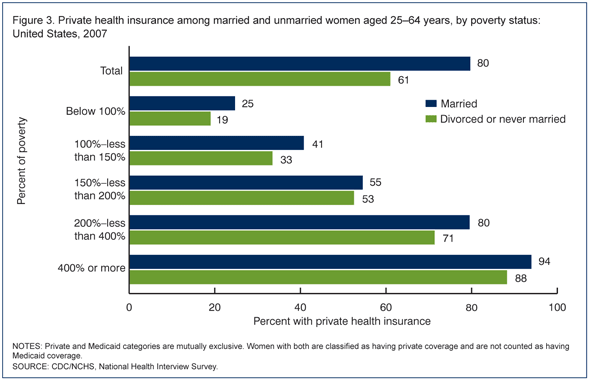
- Married women are more likely to have private insurance, and less likely to have Medicaid, than unmarried women.
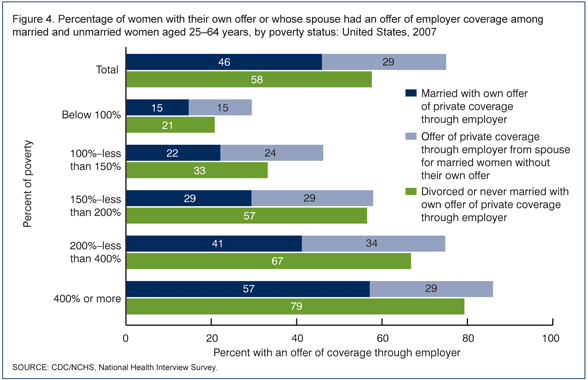
- The probability of an offer of health insurance through an employer increases with family income for both married and unmarried women.
Marriage affects health insurance coverage. As marriage rates in the United States decline (1), fewer women will have the opportunity to obtain health insurance coverage through their spouse. Marriage can also increase family income and may make health insurance more affordable. Because poor and low-income unmarried women are more likely to be eligible for Medicaid than their married counterparts, changes in Medicaid eligibility may also affect coverage rates disproportionately for poor and low-income unmarried women.
Keywords: Medicaid, private health insurance, marital status, National Health Interview Survey
Overall, unmarried women aged 25-64 years are about 60% more likely than married women to lack health insurance coverage, but that disadvantage is not consistent across poverty status groups.

Married women are less likely than unmarried women to be poor, but poor married women are more likely than poor unmarried women to be uninsured.
More than two-thirds of women have family income at 200% of the federal poverty level or more. In this income group, unmarried women are more likely to be uninsured than married women.
Even among those with family income at or above 400% of the federal poverty level, 8% of unmarried women are uninsured-almost three times the rate for married women.
At any level of family income, unmarried women aged 25-64 years are more likely than married women to have Medicaid or other public coverage.

Unmarried women are almost four times as likely as married women to have Medicaid.
Almost one-half (45%) of poor unmarried women have Medicaid compared with about one-quarter of poor married women.
Married women aged 25-64 years are more likely than unmarried women to have private health insurance coverage.

The percentages of both married and unmarried women with private insurance increase with family income.
A large majority of married and unmarried women with family income at or above 400% of the federal poverty level have private coverage.
Married women with family incomes at or above 400% of the federal poverty level are almost four times as likely to have private insurance as married women living in poverty; unmarried women in the wealthiest group are more than four times as likely to have private insurance as unmarried poor women.
Married women and their spouses are more likely to have an offer of private health insurance through an employer than unmarried women

The percentage of women with their own offer of health insurance through an employer increases with increasing family income regardless of marital status.
Married women are more likely to have an offer of health insurance through an employer than unmarried women, because they may have an offer either through their own workplace or that of their spouse.
At all levels of family income, married women are less likely than unmarried women to have their own offer of private insurance through their employer.
Summary
Marital status is an important predictor of having health insurance coverage for women aged 25-64 years, in all poverty status groups. Unmarried women are less likely to have private health insurance coverage and more likely to have Medicaid coverage, than married women across all income groups, with the exception of women between 150% and 200% of the federal poverty level.
Poor women are more likely than women at higher incomes to have Medicaid or other public coverage, because Medicaid was developed as a safety net program for medically needy poor and low income persons (2). Poor married women are less likely to have Medicaid than poor unmarried women, and so among poor and low income women living below 200% of the federal poverty level, married women are actually more likely to be uninsured than are unmarried women. Among women with family incomes at or above 200% of the federal poverty level, few women have Medicaid coverage, and unmarried women are more likely to be uninsured than married women.
Although unmarried women are more likely to be uninsured, more women aged 25-64 years are married than unmarried. Therefore, the majority of uninsured women are married. In 2007, about 6.5 million uninsured women were married compared with 5 million uninsured women who were not married (unpublished estimates from the National Health Interview Survey).
Private, employer-sponsored coverage remains the most commonly held type of health insurance (3), and married women are more likely to have private coverage than unmarried women in almost all income groups. However, married poor women aged 25-64 years are 32% more likely to have private insurance than unmarried poor women, whereas among women at or above 400% of the federal poverty level, married women are only 7% more likely than unmarried women to have private coverage. Declining marriage rates in the U.S. may increase uninsurance rates in the future.
Definitions
Health insurance coverage: Broadly defined to include both public and private payors who cover medical expenditures incurred by a defined population in a variety of settings. This includes people covered by private health insurance, whether offered through employment or purchased individually, and coverage through public programs such as Medicare, Medicaid, State Children's Health Insurance Program, and other state-sponsored programs. Persons with only Indian Health Service coverage or having only a private plan that paid for one type of service such as accidents or dental care were not considered to be covered by health insurance. In this report, coverage is measured at one point in time, which is the day of the National Health Interview Survey (NHIS) interview.
Married women: Classified as married if they responded that they currently are married. In the NHIS all persons aged 14 years and older are asked: "Are you now married, widowed, divorced, separated, never married, or living with a partner?"
Unmarried: Is indicated when women report that they were currently divorced or that they had never been married. Widows and women who reported being separated, or who reported living with a partner but who did not report being married, are not included in the analysis because their health insurance coverage status relative to their current or late spouse is unclear, based on state law and survivor benefits status. About 6% of women aged 25-64 years reported being separated or widowed.
Poverty status or percentage of the federal poverty level: Based on family income, family size, and the number of children in the family, and, for families with two or fewer adults, on the age of the adults in the family. The federal poverty level is based on definitions originally developed by the Social Security Administration. These include a set of income thresholds that vary by family size and composition. Families or individuals with income below their appropriate thresholds are classified as below the federal poverty level. These thresholds are updated annually by the U.S. Census Bureau to reflect changes in the Consumer Price Index for all urban consumers (CPI-U). For more information, see Income, poverty, and health insurance coverage in the United States: 2005. P60-231, Series P-60 No 231. Washington, D.C. U.S. Government Printing Office, 2005. Available from the U.S. Census Bureau website.
Private insurance: Indicated when respondents report they were covered at the time of their NHIS interview by private health insurance through an employer, union, or if they purchased a policy on their own. Private health insurance includes managed care such as health maintenance organizations (HMOs). It does not include military health plans.
Offers of employer-sponsored health insurance: Indicated by a "yes" response to the following question, which was asked of all persons 18 years of age and over who were working for pay at a job or business, or with a job or business, but not at work, or working but not for pay at a family-owned job or business: "Regarding [your/name's] job or work last week, was health insurance offered to [you/name] through [your/name's] workplace?
Medicaid: Indicated when respondents report they were covered at the time of their NHIS interview by Medicaid or a state sponsored health program, and are also considered covered by Medicaid if they reported coverage by the State Children's Health Insurance Program (SCHIP), or other state-sponsored plans. In this analysis, health insurance categories are hierarchical, and women covered by both private insurance and Medicaid are considered to have private insurance.
Uninsured status: Indicated when respondents indicate they did not have coverage under private health insurance, Medicare, Medicaid, SCHIP, a state sponsored health plan, other government sponsored programs, or a military health plan (TRICARE, VA, or CHAMP-VA). A person was also defined as uninsured if he or she had only Indian Health Service coverage or had only a private plan that paid for one type of service such as accidents or dental care.
Data source and methods
Data from the 2007 National Health Interview Survey (NHIS) were used for this analysis. The NHIS is conducted continuously throughout the year by interviewers of the U.S. Census Bureau for the Centers for Disease Control and Prevention's National Center for Health Statistics (NCHS). The NHIS collects information about the health and health care of the civilian, noninstitutionalized U.S. population. Interviews are conducted in respondents' homes, but follow-ups to complete interviews may be conducted over the telephone. Questions about health insurance coverage and offers of health insurance coverage are asked of family respondents in the family component of the survey. The questions may be viewed on the NHIS websitethe NHIS Website. In the 2007 NHIS, information was collected on a total of 75,764 persons in 29,266 households. The household response rate was 87.1%. For further information about the NHIS, including the questionnaire, see the NHIS Website.
The NHIS is designed to yield a nationally representative sample, and this analysis uses weights to produce national estimates. Data weighting procedures are described in more detail elsewhere (NHIS Methods). Point estimates and estimates of corresponding variances for this analysis were calculated using SUDAAN software (4) to account for the complex sample design of the NHIS. The Taylor series linearization method was chosen for variance estimation. All estimates shown meet the NCHS standard of having a relative standard error less than or equal to 30%. Differences between percentages were evaluated using two-sided significance tests at the 0.05 level. Terms such as "higher than" and "less than" indicate statistically significant differences. Terms such as "similar" and "no difference" indicate that the statistics being compared were not significantly different. Lack of comment regarding the difference between any two statistics does not necessarily suggest that the difference was tested and found to be not significant.
Only women aged 25-64 years are included in this analysis of the relationship between marital status and health insurance coverage, because most women under age 25 are not married, and the Medicare program covers almost all people aged 65 years and over. Women with unknown marital status (1.3%) or unknown health insurance coverage (1%) are excluded from all tabulations.
Estimates by poverty status are based on both reported and imputed family income. Family income information was completely missing for 10.6% of persons and was reported only into broad categories for an additional 23.6% of persons in 2007. Therefore, family income was imputed for 34.2% of persons in 2007 using NHIS imputed income files (5).
Appendix I. Selected sociodemographic characteristics among married and unmarried women aged 25-64 years: United States, 2007
| Percent of Women aged 25-64 years | ||||||
|---|---|---|---|---|---|---|
| Marital status | Total % of group | SE | Married % of group | SE | Divorced or never married % of group | SE |
| Married | 64.4 | 0.48 | ... | ... | ||
| Divorced | 13.6 | 0.29 | ... | ... | ||
| Separated | 3.2 | 0.14 | ... | ... | ||
| Widowed | 3.1 | 0.13 | ... | ... | ||
| Never married | 15.7 | 0.35 | ... | ... | ||
| Percent of Women aged 25-64 years | ||||||
|---|---|---|---|---|---|---|
| Poverty status | Total % of group | SE | Married % of group | SE | Divorced or never married % of group | SE |
| All poverty levels | 100.0 | ... | 100.0 | ... | 100.0 | ... |
| Below 100% of poverty | 10.7 | 0.32 | 5.9 | 0.27 | 17.4 | 0.67 |
| 100% to less than 150% | 8.2 | 0.24 | 6.2 | 0.25 | 11.3 | 0.50 |
| 150% to less than 200% | 8.4 | 0.26 | 6.9 | 0.29 | 10.7 | 0.56 |
| 200% to less than 400% | 29.5 | 0.43 | 28.9 | 0.54 | 31.0 | 0.77 |
| 400% of poverty or more | 43.3 | 0.56 | 52.1 | 0.65 | 29.7 | 0.84 |
| Percent of Women aged 25-64 years | ||||||
|---|---|---|---|---|---|---|
| Age | Total % of group | SE | Married % of group | SE | Divorced or never married % of group | SE |
| All women 25-64 years | 100.0 | ... | 100.0 | ... | 100.0 | ... |
| 25-34 years | 24.7 | 0.41 | 21.5 | 0.45 | 34.2 | 0.79 |
| 35-44 years | 26.6 | 0.37 | 28.3 | 0.45 | 24.4 | 0.68 |
| 45-54 years | 27.8 | 0.36 | 28.9 | 0.48 | 25.2 | 0.69 |
| 55-64 years | 20.9 | 0.35 | 21.3 | 0.44 | 16.3 | 0.58 |
SE is standard error.
... Category not applicable.
NOTE: Women with unknown marital status and unknown insurance status are excluded from totals.
DATA SOURCE: CDC/NCHS, National Health Interview Survey.
About the authors
Amy Bernstein, Kate Brett, and Mary Ann Bush are with the Centers for Disease Control and Prevention's (CDC) National Center for Health Statistics (NCHS), Office of Analysis and Epidemiology; and Robin A. Cohen is with CDC's NCHS, Division of Health Interview Statistics.
References
- Cherlin AJ. American marriage in the early twenty-first century. The future of children: Marriage and child well-being;15 (2):33-56.
- Centers for Medicare and Medicaid Services (CMS) website. National Center for Health Statistics. Health, United States, 2007 with chartbook on trends in the health of Americans. Hyattsville MD: 2007.
- National Center for Health Statistics. Health, United States, 2007 with chartbook on trends in the health of Americans. Hyattsville MD: 2007
- Research Triangle Institute. SUDAAN (Release 9.1). Research Triangle Park, NC: Research Triangle Institute. 2004.
- Schenker N, Raghunathan TE, Chiu P, Makuc DM, Zhang G, Cohen AJ. Multiple imputation of family income and personal earnings in the National Health Interview Survey: Methods and examples [PDF - 813 KB]. August 28, 2008.
Suggested citation
Bernstein AB, Cohen RA, Brett KM, Bush M. Marital status is associated with health insurance coverage for working-age women at all income levels, 2007. NCHS data brief, no 11. Hyattsville, MD: National Center for Health Statistics. 2008.
Copyright information
All material appearing in this report is in the public domain and may be reproduced or copied without permission; citation as to source, however, is appreciated.
National Center for Health Statistics
Director
Edward J. Sondik, Ph.D.
Acting Co-Deputy Directors
Jennifer H. Madans, Ph.D.
Michael H. Sadagursky
- Page last reviewed: November 6, 2015
- Page last updated: January 19, 2010
- Content source:


 ShareCompartir