Regional Variation in Use of Complementary Health Approaches by U.S. Adults
On This Page
- Key findings
- Nonvitamin, nonmineral dietary supplements, chiropractic or osteopathic manipulation, yoga, and massage therapy were the most common complementary health approaches used in 2012.
- Use of practitioner-based chiropractic or osteopathic manipulation was twice as high in the West North Central region as in the United States overall.
- Adult use of nonvitamin, nonmineral dietary supplements was highest in the Mountain, Pacific, and West North Central regions.
- The use of yoga with deep breathing or meditation was approximately 40% higher in the Pacific and Mountain regions than the national average.
- In 2012, adults living in the Pacific, Mountain, and West North Central regions were most likely to have used massage therapy during the past 12 months.
- Summary
- Definitions
- Data sources and methods
- About the authors
- References
- Suggested citation
NCHS Data Brief No. 146, April 2014
PDF Version (701 KB)
Jennifer A. Peregoy, M.P.H.; Tainya C. Clarke, Ph.D., M.P.H.; Lindsey I. Jones, M.P.H.; Barbara J. Stussman, B.A.; and Richard L. Nahin, Ph.D., M.P.H.
Key findings
Data from the National Health Interview Survey, 2012
- Use of nonvitamin, nonmineral dietary supplements (17.9%) was greater than any other complementary health approach used by U.S. adults in 2012.
- The use of practitioner-based chiropractic or osteopathic manipulation was nearly twice as high in the West North Central region as in the United States overall.
- Use of nonvitamin, nonmineral dietary supplements was highest in the Mountain, Pacific, and West North Central regions.
- Use of yoga with deep breathing or meditation was approximately 40% higher in the Pacific and Mountain regions than in the United States overall.
Complementary health approaches are defined as “a group of diverse medical and health care interventions, practices, products, or disciplines that are not generally considered part of conventional medicine” (1). They range from practitioner-based approaches, such as chiropractic manipulation and massage therapy, to predominantly self-care approaches, such as nonvitamin, nonmineral dietary supplements, meditation, and yoga. This report presents estimates of the four most commonly used complementary health approaches among adults aged 18 and over in nine geographic regions, using data from the 2012 National Health Interview Survey adult alternative medicine supplement (2).
Keywords: National Health Interview Survey, U.S. regions, chiropractic, dietary supplements
Nonvitamin, nonmineral dietary supplements, chiropractic or osteopathic manipulation, yoga, and massage therapy were the most common complementary health approaches used in 2012.
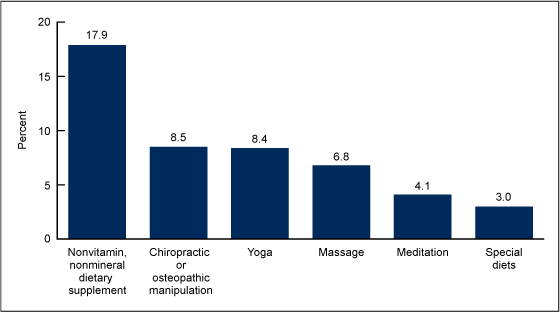
- The use of nonvitamin, nonmineral dietary supplements (17.9%) was more than twice that of all other complementary health approaches (Figure 1).
- In 2012, chiropractic and osteopathic manipulation was used by 8.5% of U.S. adults, yoga by 8.4%, and massage by 6.8%.
- Other complementary health approaches commonly used by adults in 2012 include meditation (4.1%) and special diets (3.0%).
Figure 1. Percentage of adults who used complementary health approaches in the past 12 months, by type of approach: United States, 2012
NOTE: Not all complementary health approaches are presented in this figure.
SOURCE: CDC/NCHS, National Health Interview Survey, 2012.
Use of practitioner-based chiropractic or osteopathic manipulation was twice as high in the West North Central region as in the United States overall.
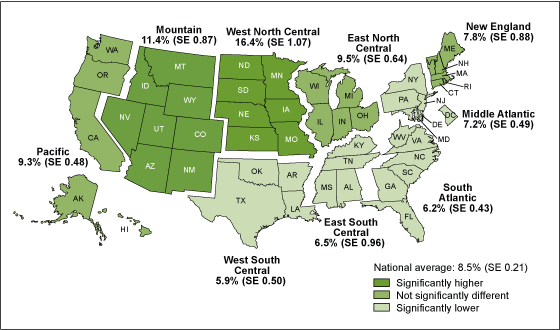
- In 2012, 16.4% of adults in the West North Central region, and 11.4% of adults in the Mountain region, used practitioner-based chiropractic or osteopathic manipulation, both of which were higher than the national average (8.5%) (Figure 2).
- Lower use of practitioner-based chiropractic or osteopathic manipulation was found in the East South Central (6.5%), South Atlantic (6.2%), and West South Central (5.9%) regions compared to the national average.
- The Pacific (9.3%) and East North Central (9.5%) regions had similar percentages of practitioner-based chiropractic or osteopathic manipulation use compared to the percentage for the nation as a whole.
Figure 2. Percentage of adults who saw a practitioner for chiropractic or osteopathic manipulation in the past 12 months, by region: United States, 2012
NOTES: SE is standard error. Significance is evaluated at the 0.05 level.
SOURCE: CDC/NCHS, National Health Interview Survey, 2012.
Adult use of nonvitamin, nonmineral dietary supplements was highest in the Mountain, Pacific, and West North Central regions.
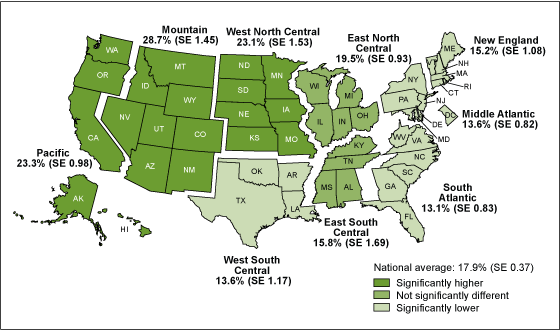
- The Mountain (28.7%), Pacific (23.3%), and West North Central (23.1%) regions had the highest percentage of adults using nonvitamin, nonmineral dietary supplements (Figure 3).
- The Middle Atlantic (13.6%), West South Central (13.6%), and South Atlantic (13.1%) regions had the lowest percentage of adults using nonvitamin, nonmineral dietary supplements.
- Use of nonvitamin, nonmineral dietary supplements in the East South Central (15.8%) and East North Central (19.5%) regions did not differ from the percentage for the nation as a whole (17.9%).
Figure 3. Percentage of adults who used nonvitamin, nonmineral dietary supplements in the past 12 months, by region: United States, 2012
NOTES: SE is standard error. Significance is evaluated at the 0.05 level.
SOURCE: CDC/NCHS, National Health Interview Survey, 2012.
The use of yoga with deep breathing or meditation was approximately 40% higher in the Pacific and Mountain regions than the national average.
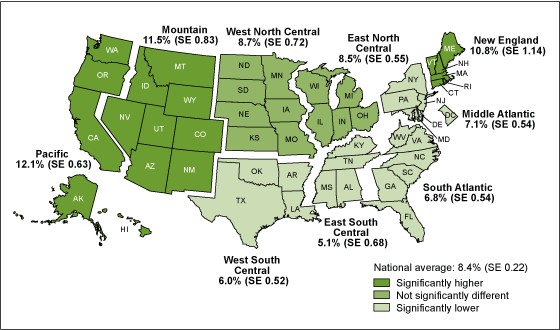
- Yoga with deep breathing or meditation use in the East South Central (5.1%), West South Central (6.0%), South Atlantic (6.8%), and Middle Atlantic (7.1%) regions was lower than the percentage for the nation as a whole (Figure 4).
- When compared to the national average, no significant difference was observed in the percentage of adults who used yoga with deep breathing or meditation in the West North Central (8.7%) and East North Central (8.5%) regions.
Figure 4. Percentage of adults who practiced yoga with deep breathing or meditation in the past 12 months, by region: United States, 2012
NOTES: SE is standard error. Significance is evaluated at the 0.05 level.
SOURCE: CDC/NCHS, National Health Interview Survey, 2012.
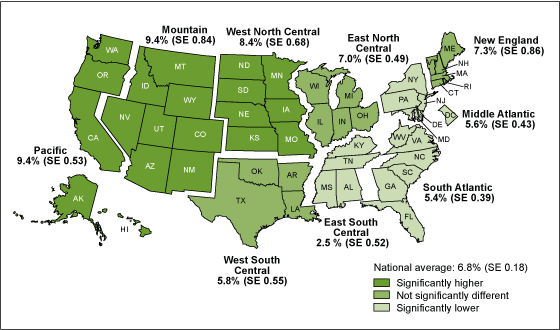
In 2012, adults living in the Pacific, Mountain, and West North Central regions were most likely to have used massage therapy during the past 12 months.
- The percentage of adults using massage therapy was higher in the Pacific (9.4%), Mountain (9.4%), and West North Central (8.4%) regions than in the nation as a whole (6.8%) (Figure 5).
- No significant difference was found in the use of massage therapy in the West South Central (5.8%), East North Central (7.0%), and New England (7.3%) regions when compared to the national average.
- Use of massage therapy in the East South Central (2.5%), South Atlantic (5.4%), and Middle Atlantic (5.6%) regions was lower than the national average.
Figure 5. Percentage of adults who used massage therapy in the past 12 months, by region: United States, 2012
NOTES: SE is standard error. Significance is evaluated at the 0.05 level.
SOURCE: CDC/NCHS, National Health Interview Survey, 2012.
Summary
In 2012, nonvitamin, nonmineral dietary supplements (17.9%), practitioner-based chiropractic or osteopathic manipulation (8.5%), yoga with deep breathing or meditation (8.4%), and massage therapy (6.8%) were the most common complementary health approaches used by U.S. adults. Previous research demonstrated that regional differences exist in the use of complementary health approaches among adults in the United States (3,4), and this report reveals that those regional differences persist across a wide range of complementary health approaches. Environmental and cultural factors unique to towns, regions, and economic factors have long been linked to differences in health behaviors and general health measures in the U.S. population (5). Similar environmental and cultural factors may be related to the regional differences of complementary health approach uses that are presented in this report.
Definitions
Complementary health approaches: Include acupuncture, Ayurveda, biofeedback, chelation therapy, chiropractic or osteopathic manipulation, craniosacral therapy, energy healing therapy, guided imagery, herbs and other nonvitamin supplements, hypnosis, homeopathy, massage, meditation (mantra, mindfulness, and spiritual), Alexander technique, Feldenkreis, Pilates, Trager psychophysical integration, naturopathy, progressive relaxation, special diets, traditional healers, and yoga (with meditation or deep breathing), tai chi, and qi gong exercises. For more information about specific health approaches, refer to the National Center for Complementary and Alternative Medicine.
Chiropractic manipulation: A technique that uses a type of hands-on therapy to adjust problems related to the body’s structure, primarily the spine, and its function.
Massage: Manipulation of the body’s muscle and connective tissues to enhance the physical functioning of those tissues, and promote relaxation and well-being. It is usually performed by massage therapists.
Meditation: A group of techniques with origins in Eastern religious or spiritual traditions. In meditation, a person learns to focus his or her attention and suspend the stream of thoughts that normally occupy the mind. This practice is believed to result in a state of greater physical relaxation, mental calmness, and psychological balance. In 2012, meditation included mantra meditation (including Transcendental Meditation, relaxation response, and clinically standardized meditation), mindfulness meditation (including vipassana, Zen Buddhist meditation, mindfulness-based stress reduction, and mindfulness-based cognitive therapy), and spiritual meditation (including centering prayer and contemplative meditation).
Nonvitamin, nonmineral dietary supplements: Include herbs and other nonvitamin supplements such as pills, capsules, tablets, or liquids that have been labeled as dietary supplements. This category does not include vitamin or mineral supplements, homeopathic treatments, or drinking herbal or green teas.
Osteopathic manipulation: A full-body system of hands-on techniques to alleviate pain, restore function, and promote health and well-being.
Regions: Categories were slightly modified from the nine U.S. Census Bureau-designated divisions: New England—ME, VT, NH, MA, CT, RI; Middle Atlantic—NY, NJ, PA, DC, DE, MD; East North Central—OH, IL, IN, MI, WI; West North Central—MN, IA, MO, ND, SD, KS, NE; South Atlantic—WV, VA, NC, SC, GA, FL; East South Central—KY, TN, MS, AL; West South Central—LA, OK, AR, TX; Mountain—NV, NM, AZ, ID, UT, CO, MT, WY; and Pacific—WA, OR, CA, AK, HI.
Special diets: A variety of nutritional approaches ranging from a basic, healthy vegetable-based diet to adopting highly restrictive diets and supplement programs. Some diets are highly restrictive; examples of special diets include Zone, vegan, and Ornish diets.
Yoga: Of Hindu origin, a combination of breathing exercises, meditation, and physical postures used to achieve a state of relaxation and balance of mind, body, and spirit. Survey respondents were classified as having practiced yoga during the past 12 months only if they indicated they had practiced deep-breathing exercises or meditation as part of their yoga exercise.
Data sources and methods
Data from the 2012 NHIS were used for this analysis. NHIS data are collected continuously throughout the year for the Centers for Disease Control and Prevention’s (CDC) National Center for Health Statistics (NCHS) by interviewers from the Census Bureau. NHIS collects information about the health and health care of the civilian noninstitutionalized U.S. population. Interviews are conducted in respondents’ homes, but follow-ups to complete interviews may be conducted over the telephone.
In 2012, detailed health information was collected on a total of 34,525 persons aged 18 and over from the Sample Adult component of the survey. For further information about NHIS, including the questionnaire, visit the NHIS website.
Questions on complementary health approaches were from the 2012 adult alternative medicine (ALT) supplement embedded in the Sample Adult component of the survey. The processes used to develop the 2012 ALT supplement, as well as those fielded in 2002 and 2007, have been previously described (6). The 2012 NHIS ALT supplement collected information from sample adults on their use of 18 complementary health approaches, which included 10 types of provider-based health therapies. NHIS participants were asked if they used or saw a practitioner for each of these approaches during the past 12 months.
Note that the 2012 questionnaire differed substantially from the 2007 questionnaire. Based on cognitive testing and input from expert panels (6), the definitions of certain modalities were modified to reduce false-positive responses. Data users should take these differences into account when conducting analyses and making comparisons between data from 2012 and previous survey years.
The NHIS ALT data were weighted to produce national and regional estimates. Data weighting procedures are described in more detail elsewhere (7). Point estimates and estimates of their variances were calculated using SUDAAN software (8) to account for the complex sampling design of NHIS. The Taylor series linearization method was chosen for estimation of standard errors. Differences between percentages were evaluated using two-sided significance tests at the 0.05 level. The estimated standard error of the difference between regional and national estimates accounted for nonindependence of regional and national estimates by incorporating their covariance.
About the authors
Jennifer A. Peregoy, Tainya C. Clarke, and Lindsey I. Jones are with CDC/NCHS, Division of Health Interview Statistics. Barbara J. Stussman and Richard L. Nahin are with the National Institutes of Health, National Center for Complementary and Alternative Medicine.
References
- National Center for Complementary and Alternative Medicine, National Institutes of Health. Exploring the science of complementary and alternative medicine: Third strategic plan, 2011–2015. NIH publication no 11–7643, D458. 2011.
- National Health Interview Survey. Adult alternative medicine supplement [PDF – 1.4 MB].
- Barnes PM, Powell-Griner E, McFann K, Nahin RL. Complementary and alternative medicine use among adults: United States, 2002. Advance data from vital and health statistics; no 343. Hyattsville, MD: National Center for Health Statistics. 2004.
- Barnes PM, Bloom B, Nahin RL. Complementary and alternative medicine use among adults and children: United States, 2007. National health statistics reports; no 12. Hyattsville, MD: National Center for Health Statistics. 2008.
- Hartley D. Rural health disparities, population health, and rural culture. Am J Public Health 94(10):1675–8. 2004.
- Stussman BJ, Bethell CD, Gray C, Nahin RL. Development of the adult and child complementary medicine questionnaires fielded on the National Health Interview Survey. BMC Complement Altern Med 13:328. 2013.
- Botman SL, Moore TF, Moriarity CL, Parsons VL. Design and estimation for the National Health Interview Survey, 1995–2004. National Center for Health Statistics. Vital Health Stat 2(130). 2000.
- RTI International. SUDAAN (Release 11.0.0) [computer software]. 2012.
Suggested citation
Peregoy JA, Clarke TC, Jones LI, et al. Regional variation in use of complementary health approaches by U.S. adults. NCHS data brief, no 146. Hyattsville, MD: National Center for Health Statistics. 2014.
Copyright information
All material appearing in this report is in the public domain and may be reproduced or copied without permission; citation as to source, however, is appreciated.
National Center for Health Statistics
Charles J. Rothwell, M.S., M.B.A., Director
Jennifer H. Madans, Ph.D., Associate Director for Science
Division of Health Interview Statistics
Jane F. Gentleman, Ph.D., Director
- Page last reviewed: November 6, 2015
- Page last updated: April 16, 2014
- Content source:


 ShareCompartir
