Health of Hispanic Adults: United States, 2010–2014
On This Page
- Key findings
- Did the age-adjusted percentage of adults who were in fair or poor health vary among Hispanic subgroups?
- Did the age-adjusted percentage of adults with multiple chronic conditions differ among Hispanic subgroups?
- Did the age-adjusted percentage of adults with serious psychological distress vary among Hispanic subgroups?
- Did the age-adjusted percentage of adults who were unable to work due to health problems differ among Hispanic subgroups?
- Did the age-adjusted percentage of adults who had a social participation restriction differ among Hispanic subgroups?
- Summary
- Definitions
- Data source and methods
- About the authors
- References
- Suggested citation
NCHS Data Brief No. 251, June 2016
PDF Version (388 KB)
Jacqueline W. Lucas, M.P.H, Gulnur Freeman, M.P.A., and Patricia F. Adams
Key findings
Data from the National Health Interview Survey, 2010–2014
- Overall, Puerto Rican adults consistently reported poorer health status than non-Hispanic adults.
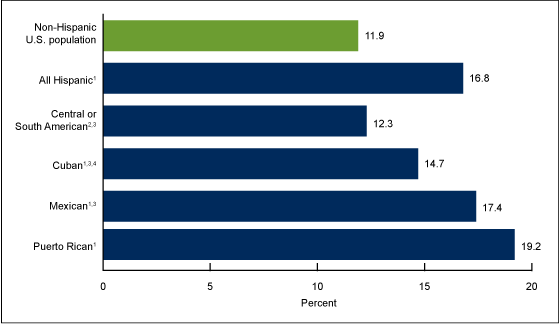
- Puerto Rican (19.2%) and Mexican (17.4%) adults were more likely than Central or South American (12.3%) and Cuban (14.7%) adults to be in fair or poor health.
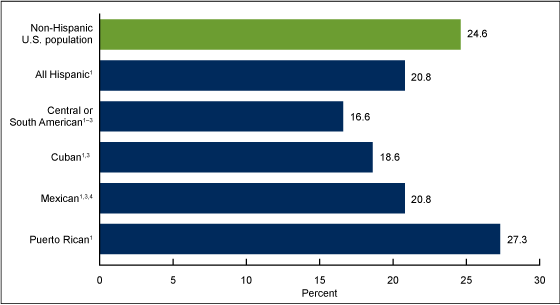
- Puerto Rican adults (27.3%) were more likely than Central or South American adults (16.6%) to have had multiple chronic conditions.
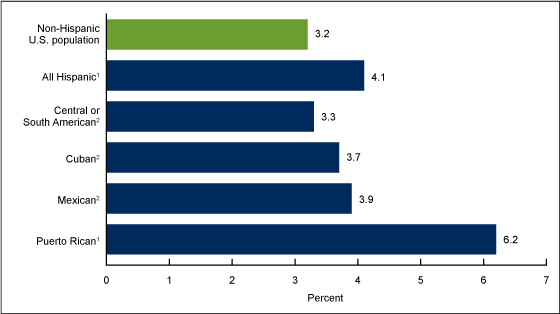
- Puerto Rican adults (6.2%) were nearly twice as likely to report serious psychological distress in the past 30 days compared with Central or South American adults (3.3%).
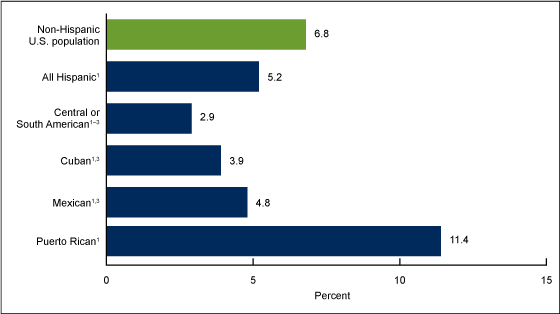
- Puerto Rican adults (11.4%) were more likely than Central or South American (2.9%), Cuban (3.9%), and Mexican (4.8%) adults to be unable to work due to health problems.
There are 54 million Hispanic persons living in the United States, making them the largest minority group in the country (1). Disaggregated data on Hispanic subgroups are needed to understand the health of Hispanic persons of diverse backgrounds (2). This report presents selected estimates of health measures for all Hispanic adults aged 18 and over and for the following four Hispanic subgroups: Central or South American, Cuban, Mexican, and Puerto Rican adults. Comparisons are also made across the subgroups and with the non-Hispanic U.S. adult population as a whole.
Keywords: health status, chronic conditions, disparities, National Health Interview Survey
Did the age-adjusted percentage of adults who were in fair or poor health vary among Hispanic subgroups?
- Puerto Rican (19.2%) and Mexican (17.4%) adults were more likely than Central or South American (12.3%) and Cuban (14.7%) adults to be in fair or poor health (Figure 1).
- The age-adjusted percentage of Hispanic adults (16.8%) with fair or poor health was higher compared with non-Hispanic U.S. adults (11.9%).
- Cuban, Mexican, and Puerto Rican adults were all more likely than non-Hispanic U.S. adults to be in fair or poor health.
- No significant difference was observed in the prevalence of fair or poor health between Central or South American adults and non-Hispanic U.S. adults.
Figure 1. Age-adjusted percentage of adults aged 18 and over who were in fair or poor health, by ethnicity and Hispanic subgroup: United States, 2010–2014
1Significantly different from non-Hispanic U.S. population (p < 0.05).
2Significantly different from Mexican (p < 0.05).
3Significantly different from Puerto Rican (p < 0.05).
4Significantly different from Central or South American (p < 0.05).
NOTES: Age-adjusted by the direct method to the 2000 U.S. Census population using age groups:
18–44, 45–64, 65–74, and 75 and over. Access data table for Figure 1.
SOURCE: NCHS, National Health Interview Survey, 2010–2014.
Did the age-adjusted percentage of adults with multiple chronic conditions differ among Hispanic subgroups?
- Puerto Rican (27.3%) and Mexican (20.8%) adults were more likely to have two or more chronic conditions—including hypertension, coronary heart disease, stroke, diabetes, cancer, arthritis, hepatitis, emphysema, weak or failing kidneys, or asthma—compared with Central or South American (16.6%) and Cuban (18.6%) adults (Figure 2).
- The age-adjusted percentage of Hispanic adults (20.8%) who have had multiple chronic conditions was lower compared with non-Hispanic U.S. adults (24.6%).
- Central or South American, Cuban, and Mexican adults were less likely to have had multiple chronic conditions compared with non-Hispanic U.S. adults, but Puerto Rican adults were more likely than non-Hispanic U.S. adults to have had multiple chronic conditions.
Figure 2. Age-adjusted percentage of adults aged 18 and over who had multiple chronic conditions, by ethnicity and Hispanic subgroup: United States, 2010–2014
1Significantly different from non-Hispanic U.S. population (p < 0.05).
2Significantly different from Mexican (p < 0.05).
3Significantly different from Puerto Rican (p < 0.05).
4Significantly different from Central or South American (p < 0.05).
NOTES: Age-adjusted by the direct method to the 2000 U.S. Census population using age groups:
18–44, 45–64, 65–74, and 75 and over. Access data table for Figure 2.
SOURCE: NCHS, National Health Interview Survey, 2010–2014.
Did the age-adjusted percentage of adults with serious psychological distress vary among Hispanic subgroups?
- The age-adjusted percentage of serious psychological distress in the past 30 days was higher among Puerto Rican adults (6.2%) compared with Central or South American (3.3%), Cuban (3.7%), and Mexican (3.9%) adults (Figure 3).
- Puerto Rican adults (6.2%) were nearly twice as likely to report serious psychological distress in the past 30 days compared with Central or South American adults (3.3%).
- Hispanic adults (4.1%) were more likely to have had serious psychological distress in the past 30 days compared with non-Hispanic U.S. adults (3.2%).
- There were no significant differences in the age-adjusted percentages of adults with serious psychological distress among Central or South American, Cuban, and Mexican adults. There was also no significant difference between these groups and the non-Hispanic U.S. population.
Figure 3. Age-adjusted percentage of adults aged 18 and over who had serious psychological distress, by ethnicity and Hispanic subgroup: United States, 2010–2014
1Significantly different from non-Hispanic U.S. population (p < 0.05).
2Significantly different from Puerto Rican (p < 0.05).
NOTES: Age-adjusted by the direct method to the 2000 U.S. Census population using age groups:
18–44, 45–64, 65–74, and 75 and over. Access data table for Figure 3.
SOURCE: NCHS, National Health Interview Survey, 2010–2014.
Did the age-adjusted percentage of adults who were unable to work due to health problems differ among Hispanic subgroups?
- Puerto Rican adults (11.4%) were more likely than Central or South American (2.9%), Cuban (3.9%), Mexican (4.8%), and non-Hispanic U.S. (6.8%) adults to be unable to work due to health problems (Figure 4).
- Mexican adults were more likely to be unable to work due to health problems compared with Central or South American adults.
- Hispanic adults (5.2%) were less likely than non-Hispanic U.S. adults (6.8%) to be unable to work due to health problems.
Figure 4. Age-adjusted percentage of adults aged 18–64 who were unable to work due to health problems, by ethnicity and Hispanic subgroup: United States, 2010–2014
1Significantly different from non-Hispanic U.S. population (p < 0.05).
2Significantly different from Mexican (p < 0.05).
3Significantly different from Puerto Rican (p < 0.05).
NOTES: Age-adjusted by the direct method to the 2000 U.S. Census population using age groups:
18–44, 45–64, 65–74, and 75 and over. Access data table for Figure 4.
SOURCE: NCHS, National Health Interview Survey, 2010–2014.
Did the age-adjusted percentage of adults who had a social participation restriction differ among Hispanic subgroups?
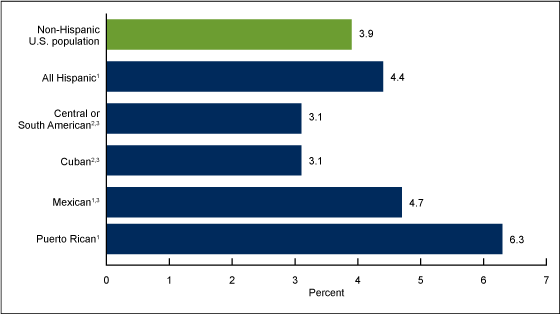
- After age adjustment, Puerto Rican adults (6.3%) were more likely than Central or South American (3.1%), Cuban (3.1%), Mexican (4.7%), and
non-Hispanic U.S. (3.9%) adults to have had a social participation restriction (Figure 5). - Mexican adults were more likely than Cuban and Central or South American adults to have had a social participation restriction.
- Hispanic adults (4.4%) were more likely than non-Hispanic U.S. adults (3.9%) to have had a social participation restriction. Central or South American (3.1%) and Cuban (3.1%) adults were equally as likely to have had a social participation restriction, and both groups were less likely than non-Hispanic adults to have had a social participation restriction.
Figure 5. Age-adjusted percentage of adults aged 18 and over who had a social participation restriction, by ethnicity and Hispanic subgroup: United States, 2010–2014
1Significantly different from non-Hispanic U.S. population (p < 0.05).
2Significantly different from Mexican (p < 0.05).
3Significantly different from Puerto Rican (p < 0.05).
NOTES: Age-adjusted by the direct method to the 2000 U.S. Census population using age groups:
18–44, 45–64, 65–74, and 75 and over. Access data table for Figure 5.
SOURCE: NCHS, National Health Interview Survey, 2010–2014.
Summary
This report provides national estimates of fair or poor health, multiple chronic conditions, serious psychological distress, inability to work due to health reasons, and social participation restrictions for four subgroups of Hispanic adults aged 18 and over in the United States. Compared with non-Hispanic U.S. adults, Hispanic adults had higher rates of fair or poor health, social participation restrictions, and serious psychological distress, but they had lower rates of being unable to work due to health reasons and having multiple chronic conditions.
The U.S. Hispanic population consists of individuals originally from various countries in North America, Central or South America, the Caribbean, and Europe. Although the Hispanic population in the United States may share a common language, there is considerable variation among subgroups in terms of cultural background, socioeconomic status, and care-seeking behaviors.
These analyses showed that Central and South American adults had similar or better health than the non-Hispanic U.S. population, while Puerto Rican adults had worse health than the non-Hispanic U.S. population. Puerto Rican adults were also generally more likely to have poorer health compared with other Hispanic subgroups, and Central or South American adults were generally less likely to have poorer health compared with other Hispanic subgroups. The findings in this report are consistent with previous studies, which show disparities among Hispanic subgroups (3,4), and highlight the importance of considering Hispanic subgroups when examining Hispanic health.
Definitions
Fair or poor health status: Family respondents were asked to assess the health of all family members, specifically, whether their “health in general is excellent, very good, good, fair, or poor?” When the sample adult is not the family respondent, this information is reported by a proxy.
Multiple chronic conditions: Based on a positive response to two or more of the separate survey questions that assess chronic conditions, including whether adults had ever been told by a doctor or other health professional that they had hypertension, coronary heart disease, stroke, diabetes, cancer, arthritis, hepatitis, or emphysema; had experienced weak or failing kidneys or chronic bronchitis during the past 12 months; or currently had asthma (5).
Serious psychological distress: Based on responses from six separate survey questions about how often a respondent felt sad, nervous, restless, hopeless, that everything was an effort, or worthless during the past 30 days.The response codes (0–4) for each of the six items are summed to yield a scale with a
0–24 range. A value of 13 or more for this scale is used here to define serious psychological distress (6). Adults with missing data for any of the six psychological distress questions were excluded from the calculation of the serious psychological distress indicator for this analysis (about 1.5% of respondents from 2010 to 2014).
Unable to work: Based on the questions, ‘‘Does a physical, mental, or emotional problem now keep [family members 18 years of age or older] from working at a job or business?’’ and for persons not kept from working, ‘‘Are [family members 18 years of age or older] limited in the kind or amount of work they can do because of a physical, mental, or emotional problem?’’ For this report, the age group is limited to those aged 18–64. When the sample adult is not the family respondent, this information is reported by a proxy.
Social participation restriction: Respondents who reported “very difficult” or “can’t do at all” to either of the following survey questions were defined as having had social participation restriction: “By yourself, and without using any special equipment, how difficult is it for you to (a) go out to things like shopping, movies, or sporting events, and (b) participate in social activities such as visiting friends, attending clubs and meetings, or going to parties?”
Data source and methods
Data from the 2010–2014 National Health Interview Survey (NHIS) were used for this analysis. NHIS data are collected continuously throughout the year by the National Center for Health Statistics. NHIS collects information about the health and health care of the civilian noninstitutionalized U.S. population. Interviews are conducted in respondents’ homes, but follow-ups to complete interviews may be conducted by telephone.
In 2010–2014, information was collected on a total of 165,950 sample adults aged 18 and over. There were 28,880 Hispanic adults in the Sample Adult files, including 17,392 Mexican or Mexican American, 4,723 Central or South American, 2,846 Puerto Rican, 1,484 Cuban, and 2,435 other Hispanic adults. These groups comprise 60.2%, 16.4%, 10.0%, 5.0%, and 8.0% of the Hispanic population, respectively. To control for differences in age distributions within Hispanic subgroups and the effect of age on the health characteristics studied here, estimates were age-adjusted using the projected 2000 U.S. population from the U.S. Census Bureau as the standard population and the following age groups: 18–44, 45–64, 65–74, and 75 and over. Estimates for adults aged 18–64 were age-adjusted using age groups 18–24, 25–44, and 45–64. Differences between percentages were evaluated using two-sided significance tests at the p < 0.05 level. All differences reported are statistically significant unless otherwise indicated. For further information about NHIS, including the questionnaire, visit the NHIS website.
NHIS is designed to yield a nationally representative sample, and this analysis used the sample adult weight to produce national estimates. Data weighting procedures are described elsewhere (7). Estimates for this analysis were calculated using SUDAAN software (8).
About the authors
Jacqueline W. Lucas, Gulnur Freeman, and Patricia F. Adams are with the National Center for Health Statistics, Division of Health Interview Statistics.
References
- U.S. Census Bureau. Facts for features: Hispanic Heritage Month 2014: Sept. 15–Oct. 15. Washington, D.C. 2014.
- Daviglus ML, Talavera GA, Avilés-Santa ML, Allison M, Cai J, Criqui MH, et.al. Prevalence of major cardiovascular risk factors and cardiovascular diseases among Hispanic/Latino individuals of diverse backgrounds in the United States. JAMA 308(17):1775–84. 2012.
- Dominguez K, Penman-Aguilar A, Chang MH, et.al. Vital signs: Leading causes of death, prevalence of diseases and risk factors, and use of health services among Hispanics in the United States—2009–2013. MMWR Morb Mortal Wkly Rep 64(17):469–78. 2015.
- Hajat A, Lucas JB, Kington R. Health outcomes among Hispanic subgroups: United States, 1992–95. Advance data from vital and health statistics; no. 310. Hyattsville, Maryland: National Center for Health Statistics. 2000.
- Goodman RA, Posner SF, Huang ES, et.al. Defining and measuring chronic conditions: Imperatives for research, policy, program, and practice. Prev Chronic Dis. 2013.
- Kessler RC, Barker PR, Colpe LJ, Epstein JF, Gfoerer JC, Hiripi E, et al. Screening for serious mental illness in the general population. Arch Gen Psychiatry 60(2):184–9. 2003.
- Parsons VL, Moriarity CL, Jonas K, et al. Design and estimation for the National Health Interview Survey, 2006–2015. National Center for Health Statistics. Vital Health Stat 2(165). 2014.
- RTI International. SUDAAN (Release 11.0.0) [computer software]. 2012.
Suggested citation
Lucas JW, Freeman G, Adams PF. Health of Hispanic adults: United States, 2010–2014. NCHS data brief, no 251. Hyattsville, MD: National Center for Health Statistics. 2016.
Copyright information
All material appearing in this report is in the public domain and may be reproduced or copied without permission; citation as to source, however, is appreciated.
National Center for Health Statistics
Charles J. Rothwell, M.S., M.B.A., Director
Jennifer H. Madans, Ph.D., Associate Director for Science
Division of Health Interview Statistics
Marcie L. Cynamon, Director
Stephen J. Blumberg, Ph.D., Associate Director for Science
- Page last reviewed: June 17, 2016
- Page last updated: June 17, 2016
- Content source:


 ShareCompartir
