Sugar-sweetened Beverage Consumption Among U.S. Adults, 2011–2014
On This Page
- Key findings
- About one-half of U.S. adults consumed at least one sugar-sweetened beverage on a given day.
- For both men and women, calories consumed from sugar-sweetened beverages on a given day decreased with age.
- Calories consumed from sugar-sweetened beverages differed by race and Hispanic origin for both men and women.
- The percentage of total daily calories consumed from sugar-sweetened beverages decreased with age for both men and women.
- The percentage of total daily calories consumed from sugar-sweetened beverages differed by race and Hispanic origin for both men and women.
- Summary
- Definitions
- Data source and methods
- About the authors
- References
- Suggested citation
NCHS Data Brief No. 270, January 2017
PDF Version (363 KB)
Asher Rosinger, Ph.D., M.P.H.; Kirsten Herrick, Ph.D., M.Sc.; Jaime Gahche, M.P.H.; and Sohyun Park, Ph.D.
Key findings
Data from the National Health and Nutrition Examination Survey
- Approximately one-half of U.S. adults consumed at least one sugar-sweetened beverage on a given day.
- Men consumed an average 179 kilocalories (kcal) from sugar-sweetened beverages, which contributed 6.9% of total daily caloric intake. Women consumed an average 113 kcal from sugar-sweetened beverages, which contributed 6.1% of total caloric intake.
- Young adults had the highest mean intake and percentage of daily calories from sugar-sweetened beverages relative to older adults.
- Non-Hispanic Asian men and women consumed the least calories and the lowest percentage of total calories from sugar-sweetened beverages compared with non-Hispanic white, non-Hispanic black, and Hispanic men and women.
Sugar-sweetened beverages are a major contributor of calories and added sugars to diets of U.S. adults (1). Studies have found that sugar-sweetened beverage consumption has been linked to weight gain, metabolic syndrome, dental caries, and type 2 diabetes in adults (2–4). The 2015–2020 Dietary Guidelines for Americans recommend reducing added sugars consumption to less than 10% of total calories per day and, specifically, to choose beverages with no added sugars (1). This report presents results for consumption of sugar-sweetened beverages among U.S. adults aged 20 and over for 2011–2014 by sex, age, and race and Hispanic origin.
Keywords: National Health and Nutrition Examination Survey, NHANES, calories, kcal
About one-half of U.S. adults consumed at least one sugar-sweetened beverage on a given day.
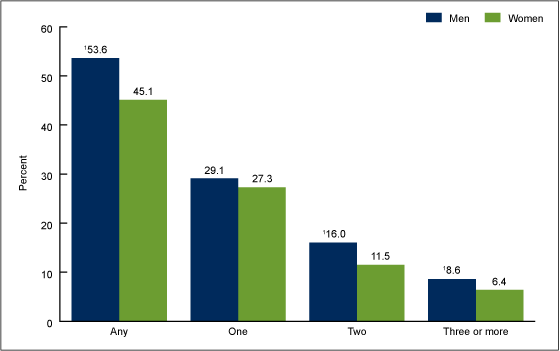
- During 2011–2014, 49.3% of U.S. adults consumed at least one sugar-sweetened beverage on a given day (Figure 1).
- A higher percentage of men (53.6%) than women (45.1%) consumed at least one sugar-sweetened beverage. Men were also more likely than women to consume two sugar-sweetened beverages or three or more on a given day.
- Among men, 29.1% consumed one sugar-sweetened beverage, 16.0% consumed two sugar-sweetened beverages, and 8.6% consumed three or more on a given day.
- Among women, 27.3% consumed one sugar-sweetened beverage, 11.5% consumed two sugar-sweetened beverages, and 6.4% consumed three or more on a given day.
Figure 1. Percentage of adults aged 20 and over who consumed sugar-sweetened beverages on a given day, by number of beverages and sex: United States, 2011–2014
1Significantly different from women, p < 0.05.
NOTES: The percentage of U.S. adults who consumed one sugar-sweetened beverage or more on a given day was 49.3%. Access data table for Figure 1.
SOURCE: NCHS, National Health and Nutrition Examination Survey, 2011–2014.
For both men and women, calories consumed from sugar-sweetened beverages on a given day decreased with age.
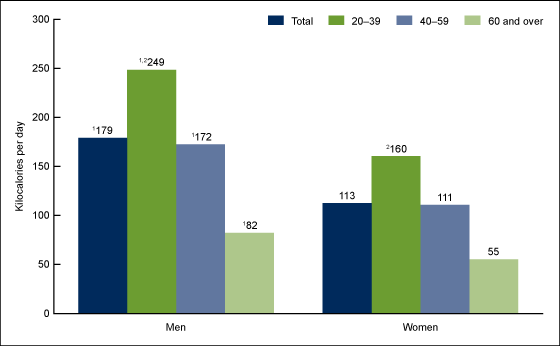
- Overall, adults aged 20 and over consumed an average 145 kilocalories (kcal) from sugar-sweetened beverages on a given day during 2011–2014. Men consumed more calories from sugar-sweetened beverages (179 kcal) than women (113 kcal) (Figure 2).
- Men consumed more calories from sugar-sweetened beverages compared with women in all age groups.
- Among both men and women, mean total calories consumed from sugar-sweetened beverages decreased with increasing age.
- Men aged 20–39 consumed 249 kcal, men aged 40–59 consumed 172 kcal, and men aged 60 and over consumed 82 kcal from sugar-sweetened beverages on a given day.
- Women aged 20–39 consumed 160 kcal, women aged 40–59 consumed 111 kcal, and women aged 60 and over consumed 55 kcal from sugar-sweetened beverages.
Figure 2. Mean kilocalories from sugar-sweetened beverages on a given day for adults aged 20 and over, by sex and age: United States, 2011–2014
1Significantly different from women, p < 0.05.
2Linear trend by age, p < 0.05.
NOTES: The total mean kilocalories (kcal) consumed from sugar-sweetened beverages on a given day by U.S. adults was 145 kcal. Access data table for Figure 2.
SOURCE: NCHS, National Health and Nutrition Examination Survey, 2011–2014.
Calories consumed from sugar-sweetened beverages differed by race and Hispanic origin for both men and women.
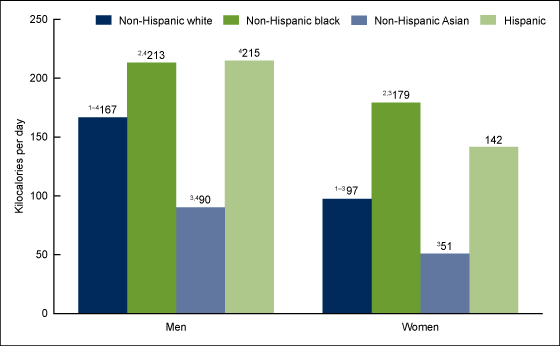
- Hispanic men (215 kcal) and non-Hispanic black men (213 kcal) had the highest mean calorie intake from sugar-sweetened beverages, followed by non-Hispanic white men (167 kcal) and non-Hispanic Asian men (90 kcal) (Figure 3).
- Non-Hispanic black women (179 kcal) had the highest caloric intake from sugar-sweetened beverages, followed by Hispanic (142 kcal), non-Hispanic white (97 kcal), and non-Hispanic Asian women (51 kcal).
- Men had higher mean calorie intake from sugar-sweetened beverages than women across all race and Hispanic-origin groups.
Figure 3. Mean kilocalories from sugar-sweetened beverages on a given day for adults aged 20 and over, by sex and race and Hispanic origin: United States, 2011–2014
1Significantly different from non-Hispanic black, p < 0.05.
2Significantly different from non-Hispanic Asian, p < 0.05.
3Significantly different from Hispanic, p < 0.05.
4Significantly different from women, p < 0.05.
NOTE: Access data table for Figure 3.
SOURCE: NCHS, National Health and Nutrition Examination Survey, 2011–2014.
The percentage of total daily calories consumed from sugar-sweetened beverages decreased with age for both men and women.
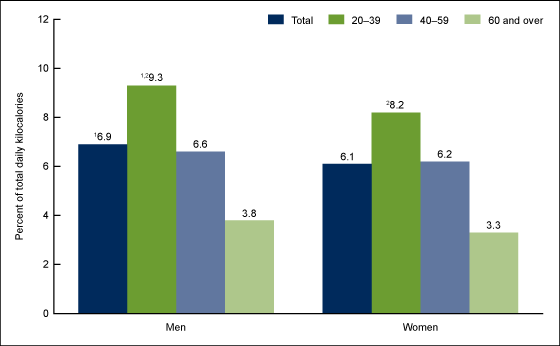
- U.S. adults consumed an average 6.5% of their total daily calories from sugar-sweetened beverages (Figure 4).
- Overall and for those aged 20–39, men consumed a higher mean percentage of total daily calories from sugar-sweetened beverages than women.
- Among both men and women, the percentage of total calories that were consumed from sugar-sweetened beverages decreased with increasing age.
- Sugar-sweetened beverages contributed 9.3% of total daily calories consumed for men aged 20–39, 6.6% for men aged 40–59, and 3.8% for men aged 60 and over.
- Sugar-sweetened beverages contributed 8.2% of total daily calories consumed for women aged 20–39, 6.2% for women aged 40–59, and 3.3% for women aged 60 and over.
Figure 4. Mean percentage of total daily kilocalories consumed from sugar-sweetened beverages on a given day by adults aged 20 and over, by sex and age: United States, 2011–2014
1Significantly different from women, p < 0.05.
2Linear trend by age, p < 0.05.
NOTES: The mean total percentage of calories consumed from sugar-sweetened beverages on a given day by U.S. adults was 6.5%. Access data table for Figure 4.
SOURCE: NCHS, National Health and Nutrition Examination Survey, 2011–2014.
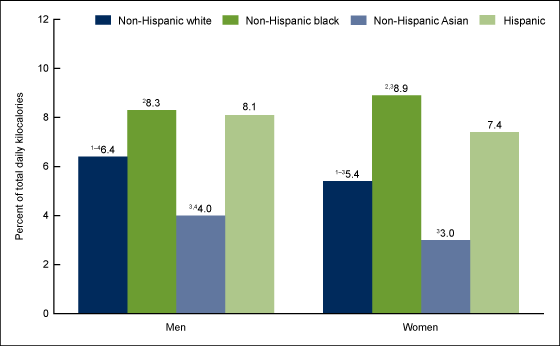
The percentage of total daily calories consumed from sugar-sweetened beverages differed by race and Hispanic origin for both men and women.
- Sugar-sweetened beverages contributed the highest proportion of total daily calories for non-Hispanic black (8.3%) and Hispanic (8.1%) men, followed by non-Hispanic white (6.4%) and non-Hispanic Asian (4.0%) men (Figure 5).
- Sugar-sweetened beverages contributed the highest proportion of total daily calories for non-Hispanic black women at 8.9%, followed by Hispanic (7.4%), non-Hispanic white (5.4%), and non-Hispanic Asian (3.0%) women.
- Non-Hispanic white and non-Hispanic Asian men consumed a higher mean percentage of total daily calories from sugar-sweetened beverages compared with non-Hispanic white and non-Hispanic Asian women.
Figure 5. Mean percentage of total daily kilocalories consumed from sugar-sweetened beverages on a given day by adults aged 20 and over, by sex and race and Hispanic origin: United States, 2011–2014
1Significantly different from non-Hispanic black, p < 0.05.
2Significantly different from non-Hispanic Asian, p < 0.05.
3Significantly different from Hispanic, p < 0.05.
4Significantly different from women, p < 0.05.
NOTE: Access data table for Figure 5.
SOURCE: NCHS, National Health and Nutrition Examination Survey, 2011–2014.
Summary
Among U.S. adults aged 20 and over, 53.6% of men and 45.1% of women consumed at least one sugar-sweetened beverage on a given day in 2011–2014. Overall, U.S. adults consumed an average 145 kcal from sugar-sweetened beverages, and 6.5% of their daily energy intake came from sugar-sweetened beverages. Mean caloric intake from sugar-sweetened beverages was 179 kcal for men, which made up 6.9% of their total daily calories. Women consumed 113 kcal from sugar-sweetened beverages, contributing 6.1% of their total daily calories. Among both men and women, consumption of sugar-sweetened beverages decreased with increasing age, and calories consumed from sugar-sweetened beverages were almost triple among young adults compared with older adults.
Among men, sugar-sweetened beverage intake was highest among both non-Hispanic black and Hispanic men, followed by non-Hispanic white and non-Hispanic Asian men. For women, sugar-sweetened beverage intake was highest among non-Hispanic black, followed by Hispanic, non-Hispanic white, and non-Hispanic Asian women.
Definitions
Sugar-sweetened beverage: For this report, sugar-sweetened beverages include regular soda, fruit drinks (including sweetened bottled waters and fruit juices and nectars with added sugars), sports and energy drinks, sweetened coffees and teas, and other sugar-sweetened beverages (including horchata and sugarcane beverages). Sugar-sweetened beverages do not include diet drinks (defined as less than 40 kcal/240 mL of the beverage); 100% fruit juice; beverages sweetened by the survey participant, including coffee and teas; alcohol; or flavored milks. This definition is consistent with previous reports (5).
Calorie, kilocalorie (kcal): A measure representing dietary energy intake (1). Calorie is usually used when discussing energy from foods and diets. In this report, the term calories in the text denotes kilocalories.
Data source and methods
Data from the National Health and Nutrition Examination Survey (NHANES) for survey years 2011–2012 and 2013–2014 were used for this analysis. NHANES is a cross-sectional survey, designed to monitor the health and nutritional status of the civilian noninstitutionalized U.S. population (6). The survey combines interviews conducted in the participants’ homes and standardized physical examinations conducted in mobile examination centers (MECs). For this report, data were collected through an in-person 24-hour dietary recall interview, which covers intake during the day (24 hours, midnight to midnight) prior to the standardized physical examination in the MEC (7).
The NHANES sample is selected through a complex, multistage probability design. For 2011–2012 and 2013–2014, non-Hispanic black, non-Hispanic Asian, and Hispanic persons, among other groups, were oversampled to obtain reliable estimates for these population subgroups. Race and Hispanic-origin categories reflect persons reporting only one race; those reporting “other” race and more than one race are included in the total but are not reported separately.
Data were analyzed using the day one dietary sample weights to account for the days of the week, differential probabilities of selection, nonresponse, and noncoverage. The standard errors of means and percentages were estimated using Taylor series linearization, a method that incorporates the sample design and sample weights. Pregnant and lactating women were included in the analysis. Differences between groups were evaluated using a univariate t statistic at the p < 0.05 significance level. Tests for age trends were evaluated using linear regression, and the significance was set at p < 0.05. Statistical analyses were conducted using Stata version 13.1 (College Park, Texas).
About the authors
Asher Rosinger is with the Centers for Disease Control and Prevention’s (CDC) Epidemic Intelligence Service, assigned to the National Center for Health Statistics (NCHS), Division of Health and Nutrition Examination Surveys (DHANES). Kirsten Herrick and Jaime Gahche are with DHANES. Sohyun Park is with CDC’s Division of Nutrition, Physical Activity, and Obesity.
References
- U.S. Department of Health and Human Services, U.S. Department of Agriculture. 2015–2020 Dietary Guidelines for Americans. 8th ed. 2015.
- Malik VS, Pan A, Willett WC, Hu FB. Sugar-sweetened beverages and weight gain in children and adults: A systematic review and meta-analysis. Am J Clin Nutr 98(4):1084–102. 2013.
- Malik VS, Popkin BM, Bray GA, Després JP, Willett WC, Hu FB. Sugar-sweetened beverages and risk of metabolic syndrome and type 2 diabetes: A meta-analysis. Diabetes Care 33(11):2477–83. 2010.
- Bernabé E, Vehkalahti MM, Sheiham A, Aromaa A, Suominen AL. Sugar-sweetened beverages and dental caries in adults: A 4-year prospective study. J Dent 42(8):952–8. 2014.
- Kit BK, Fakhouri TH, Park S, Nielsen SJ, Ogden CL. Trends in sugar-sweetened beverage consumption among youth and adults in the United States: 1999–2010. Am J Clin Nutr 98(1):180–8. 2013.
- National Center for Health Statistics. National Health and Nutrition Examination Survey: Questionnaires, datasets, and related documentation. NHANES 2011–2012, NHANES 2013–2014.
- National Center for Health Statistics. National Health and Nutrition Examination Survey: MEC in-person dietary interviewers procedures manual. Dietary interview component. NHANES 2011–2012, NHANES 2013–2014.
Suggested citation
Rosinger A, Herrick K, Gahche J, Park S. Sugar-sweetened beverage consumption among U.S. adults, 2011–2014. NCHS data brief, no 270. Hyattsville, MD: National Center for Health Statistics. 2017.
Copyright information
All material appearing in this report is in the public domain and may be reproduced or copied without permission; citation as to source, however, is appreciated.
National Center for Health Statistics
Charles J. Rothwell, M.S., M.B.A., Director
Jennifer H. Madans, Ph.D., Associate Director for Science
Division of Health and Nutrition Examination Surveys
Kathryn S. Porter, M.D., M.S., Director
Ryne Paulose-Ram, Ph.D., Associate Director for Science
- Page last reviewed: January 26, 2017
- Page last updated: January 26, 2017
- Content source:


 ShareCompartir
