Selected Health Conditions Among Native Hawaiian and Pacific Islander Adults: United States, 2014
On This Page
- Key findings
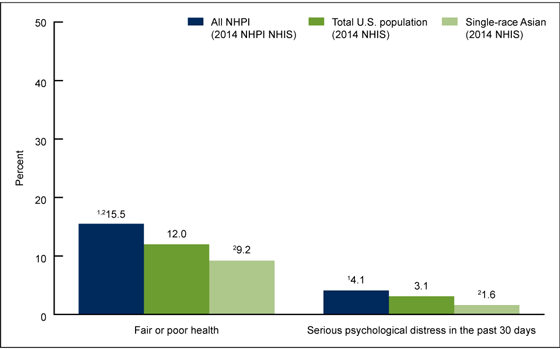
- NHPI adults were more likely to be in fair or poor health and to have experienced serious psychological distress in the past 30 days compared with single-race Asian adults.
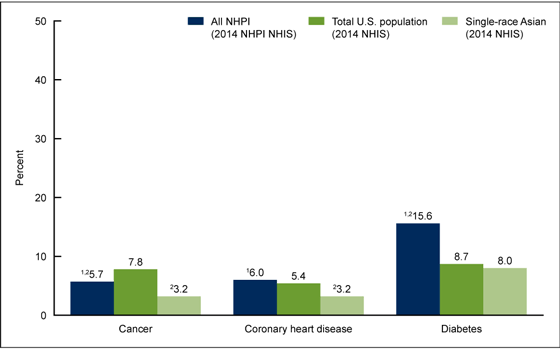
- Compared with single-race Asian adults, NHPI adults were more likely to have each of the three leading causes of death analyzed.
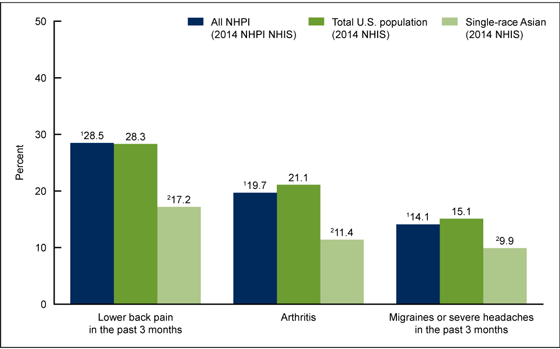
- NHPI adults were more likely than single-race Asian adults to have lower back pain, arthritis, and severe headaches.
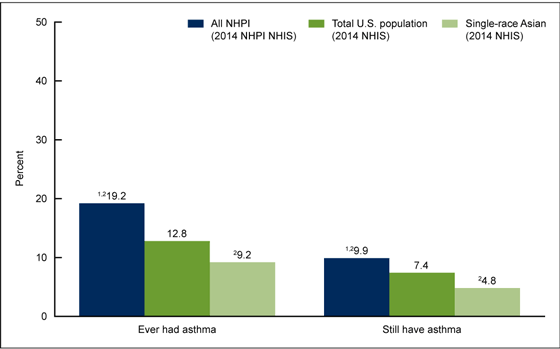
- NHPI adults were more likely than single-race Asian adults to have ever been diagnosed with and still have asthma.
- Summary
- Definitions
- Data sources and methods
- About the authors
- References
- Suggested citation
NCHS Data Brief No. 277, March 2017
PDF Version (333 KB)
Adena M. Galinsky, Ph.D., Carla E. Zelaya, Ph.D., Patricia M. Barnes, M.A., and Catherine Simile, Ph.D.
Key findings
Data from the Native Hawaiian and Pacific Islander National Health Interview Survey (NHPI NHIS) and the National Health Interview Survey (NHIS)
- The age-sex-adjusted percentages of NHPI adults with fair or poor health (15.5%), serious psychological distress (4.1% in past 30 days), cancer (5.7%), coronary heart disease (6.0%), diabetes (15.6%), lower back pain (28.5% in past 3 months), arthritis (19.7%), migraines (14.1% in past 3 months), and asthma (9.9%) were greater than the corresponding percentages for single-race Asian adults.
- NHPI adults were more likely than all U.S. adults to be in fair or poor health, to have diabetes, and to have ever had asthma, but they were less likely to have cancer.
Although the Asian or Pacific Islander federal race category was split into two in 1997 (1), few reliable health statistics are available for the Native Hawaiian and Pacific Islander (NHPI) population. In 2014, the National Center for Health Statistics (NCHS) fielded a first-of-its-kind federal survey focused exclusively on NHPI population health. This report uses data from that survey, in combination with 2014 data from the annual National Health Interview Survey (NHIS), to highlight differences in the prevalence of selected health conditions between the NHPI population and the Asian population with whom they have historically been combined.
Keywords: Fair or poor health, Native Hawaiian and Pacific Islander National Health Interview Survey
NHPI adults were more likely to be in fair or poor health and to have experienced serious psychological distress in the past 30 days compared with single-race Asian adults.
- The percentage of NHPI adults who were in fair or poor health was 15.5%, which was higher than the percentage among single-race Asian adults (9.2%) and all U.S. adults (12.0%) (Figure 1).
- The percentage of all NHPI adults (4.1%) who had experienced serious psychological distress in the past 30 days was higher than the percentage among single-race Asian adults (1.6%) and higher than, but not significantly different from, the percentage of all U.S. adults (3.1%).
Figure 1. Age-sex-adjusted percentage of adults aged 18 and over in fair or poor health, or who had experienced serious psychological distress, by race: United States, 2014

1Significantly different from single-race Asian persons (p < 0.05).
2Significantly different from total U.S. population (p < 0.05).
NOTES: NHPI is Native Hawaiian and Pacific Islander. NHIS is National Health Interview Survey. All NHPI refers to persons who were identified as NHPI alone or in combination with other races. Access data table for Figure 1.
SOURCES: NCHS, Native Hawaiian and Pacific Islander National Health Interview Survey (NHPI NHIS), 2014 and NCHS, National Health Interview Survey (NHIS), 2014.
Compared with single-race Asian adults, NHPI adults were more likely to have each of the three leading causes of death analyzed.
- A higher percentage of all NHPI adults (5.7%) had cancer compared with single-race Asian adults (3.2%), while the percentage for NHPI adults was lower than that for all U.S. adults (7.8%) (Figure 2).
- A higher percentage of all NHPI adults (6.0%) had coronary heart disease compared with single-race Asian adults (3.2%); the percentage of all NHPI adults was higher than, but not significantly different from, the percentage of all U.S. adults (5.4%).
- A higher percentage of all NHPI adults (15.6%) had diabetes compared with single-race Asian adults (8.0%) and all U.S. adults (8.7%).
Figure 2. Age-sex-adjusted percentage of adults aged 18 and over with cancer, coronary heart disease, or diabetes, by race: United States, 2014

1Significantly different from single-race Asian persons (p < 0.05).
2Significantly different from total U.S. population (p < 0.05).
NOTES: NHPI is Native Hawaiian and Pacific Islander. NHIS is National Health Interview Survey. All NHPI refers to persons who were identified as NHPI alone or in combination with other races. Access data table for Figure 2.
SOURCES: NCHS, Native Hawaiian and Pacific Islander National Health Interview Survey (NHPI NHIS), 2014 and NCHS, National Health Interview Survey (NHIS), 2014.
NHPI adults were more likely than single-race Asian adults to have lower back pain, arthritis, and severe headaches.
- A higher percentage of all NHPI adults (28.5%) had lower back pain in the past 3 months compared with single-race Asian adults (17.2%) (Figure 3).
- A higher percentage of all NHPI adults (19.7%) had arthritis compared with single-race Asian adults (11.4%); the percentage of all NHPI adults was lower than, but not significantly different from, the percentage of all U.S. adults (21.1%).
- A higher percentage of all NHPI adults (14.1%) had migraines or severe headaches in the past 3 months compared with single-race Asian adults (9.9%); the percentage of all NHPI adults was lower than, but not significantly different from, the percentage of all U.S. adults (15.1%).
Figure 3. Age-sex-adjusted percentage of adults aged 18 and over with pain in lower back, arthritis, or migraines, by race: United States, 2014

1Significantly different from single-race Asian persons (p < 0.05).
2Significantly different from total U.S. population (p < 0.05).
NOTES: NHPI is Native Hawaiian and Pacific Islander. NHIS is National Health Interview Survey. All NHPI refers to persons who were identified as NHPI alone or in combination with other races. Access data table for Figure 3.
SOURCES: NCHS, Native Hawaiian and Pacific Islander National Health Interview Survey (NHPI NHIS), 2014 and NCHS, National Health Interview Survey (NHIS), 2014.
NHPI adults were more likely than single-race Asian adults to have ever been diagnosed with and still have asthma.
- A higher percentage of all NHPI adults (19.2%) had ever been diagnosed with asthma compared with both single-race Asian adults (9.2%) and all U.S. adults (12.8%) (Figure 4).
- A higher percentage of all NHPI adults (9.9%) still had asthma compared with both single-race Asian adults (4.8%) and all U.S. adults (7.4%).
Figure 4. Age-sex-adjusted percentage of adults aged 18 and over who ever had asthma or still have asthma, by race: United States, 2014

1Significantly different from single-race Asian persons (p < 0.05).
2Significantly different from total U.S. population (p < 0.05).
NOTES: NHPI is Native Hawaiian and Pacific Islander. NHIS is National Health Interview Survey. All NHPI refers to persons who were identified as NHPI alone or in combination with other races. Access data table for Figure 4.
SOURCES: NCHS, Native Hawaiian and Pacific Islander National Health Interview Survey (NHPI NHIS), 2014 and NCHS, National Health Interview Survey (NHIS), 2014.
Summary
In 2014, NHPI adults reported a consistent pattern of poorer health compared with single-race Asian adults for all ten measures in this report.
NHPI adults were also more likely than all U.S. adults to be in fair or poor health, to have diabetes, and to have ever had asthma, but they were less likely to have cancer. NHPI adults did not differ significantly from all U.S. adults in their likelihood of having each of the three pain-related conditions analyzed (lower back pain, arthritis, and migraines), serious psychological distress, and coronary heart disease.
Historically, few reliable health statistics have been available for the NHPI population because they constitute only about 0.4% of the total U.S. population (2). Thus, this type of analysis has generally not been possible, either because NHPI and Asian data were aggregated to produce Asian or Pacific Islander statistics, or relatedly, because survey sample sizes for NHPI were too small to calculate reliable estimates. Using the relatively large NHPI sample from the 2014 NHPI NHIS, it is possible to calculate reliable NHPI estimates with smaller variance and thereby discern differences between the NHPI population and other racial groups. These results highlight some of the important differences between the NHPI and Asian populations that are obscured when the two groups are combined.
Definitions
Arthritis: Respondents were asked if they had ever been told by a doctor or other health professional that they had some form of arthritis, rheumatoid arthritis, gout, lupus, or fibromyalgia. Those who answered “yes” were classified as having arthritis.
Cancer: Respondents were asked if they had ever been told by a doctor or other health professional that they had a cancer or malignancy of any kind.
Coronary heart disease: In separate questions, respondents were asked if they had ever been told by a doctor or other health professional that they had coronary heart disease, angina (or angina pectoris), or heart attack (or myocardial infarction). Prevalence of coronary heart disease includes coronary heart disease, angina, and heart attack.
Diabetes: Respondents were asked if they had ever been told by a doctor or other health professional that they had diabetes (or sugar diabetes; female respondents were instructed to exclude pregnancy-related diabetes). Responses from persons who said they had borderline diabetes were treated as unknown with respect to diabetes.
Ever and current asthma: Respondents were asked, “Has a doctor or other health professional ever told you that you had asthma?” and “Do you still have asthma?”
General health status: Respondents were asked to assess their own health and that of family members living in the same household as excellent, very good, good, fair, or poor.
Lower back pain and migraines or severe headaches: In separate questions, respondents were asked, “During the past 3 months, did you have low back pain?” and “During the past 3 months, did you have a severe headache or migraine?” For both questions, respondents were instructed to report pain that had lasted 1 whole day or more, and conversely, not to report fleeting or minor aches or pains.
Serious psychological distress: Based on responses from six survey questions about how often a respondent felt sad, nervous, restless, hopeless, everything was an effort, and worthless during the past 30 days. The response codes (0–4) for each of the six items are summed to yield a scale with a 0–24 range. A value of 13 or more for this scale was used to define serious psychological distress (3).
Data sources and methods
Data from the 2014 NHPI NHIS and the 2014 NHIS were used for this analysis. All estimates for the NHPI population were calculated using 2014 NHPI NHIS data. All estimates for the total U.S. population and single-race Asian population were calculated using 2014 NHIS data.
NHIS data are collected continuously throughout the year for NCHS by interviewers from the U.S. Census Bureau. NHIS collects information about the health and health care of the civilian noninstitutionalized U.S. population. NHPI NHIS data were collected between February and November of 2014 by experienced NHIS interviewers. For both surveys, interviews were conducted in respondents’ homes, with telephone follow-up to complete interviews when needed (4,5). Following questions about the household and family, one adult aged 18 or over was randomly selected from each family for a detailed interview. All sample adults in NHPI NHIS are single- or multiple-race NHPI. Analyses in this report are based on data from 2,590 NHPI sample adults from NHPI NHIS and 36,697 sample adults from 2014 NHIS.
Both surveys were designed to yield a nationally representative sample, and this analysis used the appropriate weights to produce national estimates. Point estimates and estimates of corresponding variance accounted for the complex sampling designs of NHIS and NHPI NHIS. Compared with single-race Asian adults, NHPI adults were more likely to be younger and male. To control for differences in age and sex distributions within race groups and the effect of age and sex on the health characteristics studied, estimates were age-sex-adjusted using the projected 2000 U.S. population from the U.S. Census Bureau as the standard population and using age groups 18–24, 25–34, 35–44, 45–64, and 65 and over. Differences between percentages were evaluated using two-sided significance tests at the 0.05 level. The estimated standard error of the difference between all NHPI and total U.S. estimates did not account for nonindependence.
About the authors
Adena M. Galinsky, Carla E. Zelaya, and Catherine Simile are with the National Center for Health Statistics (NCHS), Division of Health Interview Statistics. Patricia M. Barnes is with NCHS, Division of Research Methodology.
References
- Office of Management and Budget. Revisions to the standards for the classification of federal data on race and ethnicity. Fed Regist 62(210):58782–90. 1997.
- Hixson L, Hepler BB, Kim MO. The Native Hawaiian and Other Pacific Islander population: 2010. 2010 Census briefs. 2012.
- Kessler RC, Barker PR, Colpe LJ, Epstein JF, Gfroerer JC, Hiripi E, et al. Screening for serious mental illness in the general population. Arch Gen Psychiatry 60(2):184–9. 2003.
- National Center for Health Statistics. Survey description, Native Hawaiian and Pacific Islander National Health Interview Survey, 2014. 2017.
- National Center for Health Statistics. Survey description, National Health Interview Survey, 2014. 2015.
Suggested citation
Galinsky AM, Zelaya CE, Barnes PM, Simile C. Selected health conditions among Native Hawaiian and Pacific Islander adults: United States, 2014. NCHS data brief, no 277. Hyattsville, MD: National Center for Health Statistics. 2017.
Copyright information
All material appearing in this report is in the public domain and may be reproduced or copied without permission; citation as to source, however, is appreciated.
National Center for Health Statistics
Charles J. Rothwell, M.S., M.B.A., Director
Jennifer H. Madans, Ph.D., Associate Director for Science
Division of Health Interview Statistics
Marcie L. Cynamon, Director
Stephen J. Blumberg, Ph.D., Associate Director for Science
Division of Research and Methodology
Nathaniel Schenker, Ph.D., Director
Donald Malec, Ph.D., Associate Director for Science
- Page last reviewed: March 15, 2017
- Page last updated: March 15, 2017
- Content source:


 ShareCompartir