Mining Publication: Metal Operator Mining Facts - 2006
Original creation date: September 2008
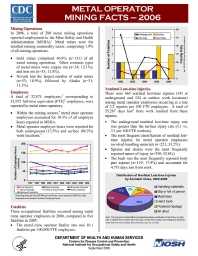
Mining Operations: In 2006, a total of 280 metal mining operations reported employment to the Mine Safety and Health Administration (MSHA). Metal mines were the smallest mining commodity sector, comprising 1.9% of all mining operations. Gold mines comprised 46.8% (n=131) of all metal mining operations. Other common types of metal mines were copper ore (n=34; 12.1%), and iron ore (n=33; 11.8%). Nevada had the largest number of metal mines (n=53; 18.9%), followed by Alaska (n=31; 11.1%). Employees: A total of 32,874 employees, corresponding to 33,972 full-time equivalent (FTE) employees, were reported by metal mine operators. Within the mining sectors, metal mine operator employees accounted for 10.3% of all employee hours reported to MSHA. Metal operator employee hours were reported for both underground (13.5%) and surface (86.5%) work locations. Fatalities: Three occupational fatalities occurred among metal mine operator employees in 2006, compared to five fatalities in 2005.The metal mine operator fatality rate was 10.1 fatalities per 100,000 FTE employees. Nonfatal Lost-time Injuries: There were 665 nonfatal lost-time injuries (141 at underground and 524 at surface work locations) among metal operator employees occurring at a rate of 2.2 injuries per 100 FTE employees. A total of 35,287 days lost from work resulted from these injuries. The underground nonfatal lost-time injury rate was greater than the surface injury rate (3.1 vs. 2.1 per 100 FTE workers). The most frequent classification of nonfatal lost-time injuries for metal operator employees involved handling materials (n=221; 33.2%). Sprains and strains were the most frequently reported nature of injury (n=350; 52.6%). The back was the most frequently reported body part injured (n=119; 17.9%) and accounted for 4,751 days lost from work.
Authors: National Institute for Occupational Safety and Health
Brochure/flyer - September 2008
NIOSHTIC2 Number: 20034769
Pittsburgh, PA: U.S. Department of Health and Human Services, Public Health Service, Centers for Disease Control and Prevention, National Institute for Occupational Safety and Health, DHHS (NIOSH) Publication No. 2008-160, 2008 Sep; :1-2
See Also
- Coal Operator Mining Facts - 2005
- Metal Operator Mining Facts - 2002
- Metal Operator Mining Facts - 2004
- Metal Operator Mining Facts - 2005
- Noncoal Contractor Mining Facts - 2003
- Nonmetal Operator Mining Facts - 2002
- Nonmetal Operator Mining Facts - 2008
- Sand and Gravel Operator Mining Facts - 2006
- Stone Operator Mining Facts - 2003
- Stone Operator Mining Facts - 2005
- Page last reviewed: 9/21/2012
- Page last updated: 9/21/2012
- Content source: National Institute for Occupational Safety and Health, Mining Program


 ShareCompartir
