


YOUNG WORKER SAFETY AND HEALTH
 ShareCompartir
Charts on Young Worker Employment, Injuries and Illnesses
Selected Charts on Young Worker Employment, Injuries and Illnesses
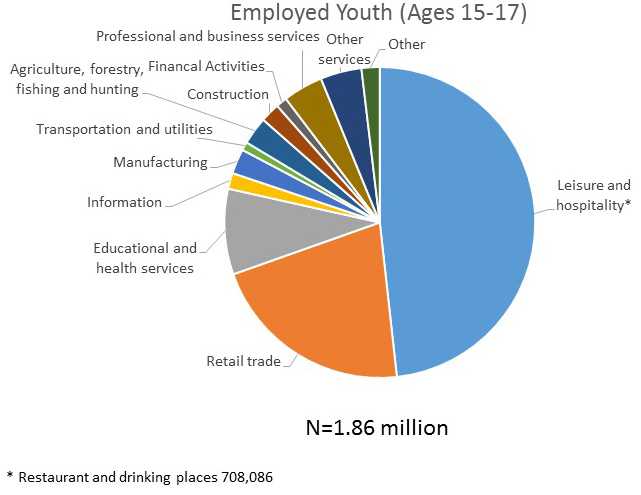
Distribution of Employed Youth (Ages 15-17) by Industry Sector, United States, 2015
This pie chart shows the distribution of employed youth ages 15-17 years by industry sector in 2015. The industry sector with the largest numbers of employed youth was the leisure and hospitality sector, accounting for 48% of all youth employment, mostly in restaurants and other food services. This was followed by the retail trade sector with 21% of youth employment, then the educational and health services sector with 9% of youth employment. (Source: Bureau of Labor Statistics’ Current Population Survey. NIOSH analyses using public microdata files.)
Download data in Excel format Download image file in PDF format
- Page last reviewed: April 11, 2017
- Page last updated: April 11, 2017
- Content source:
- National Institute for Occupational Safety and Health Division of Safety Research