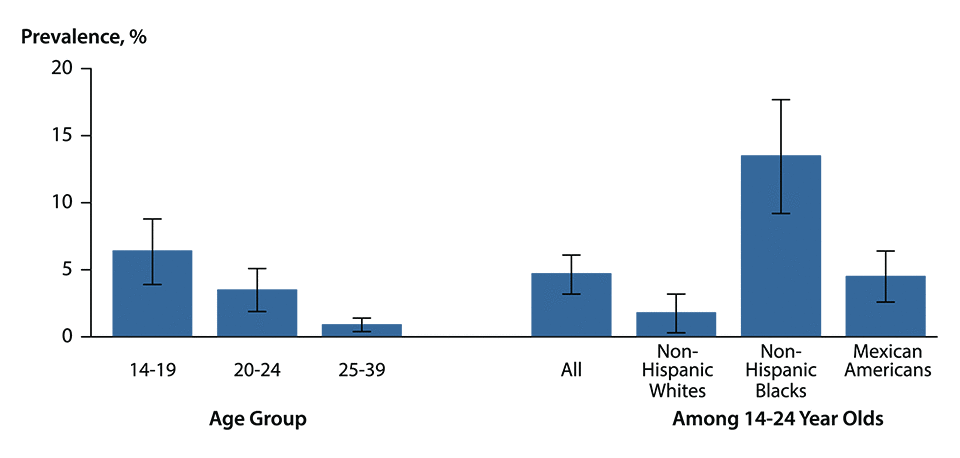
Figure 11. Chlamydia — Prevalence Among Sexually-Active Women Aged 14–39 Years by Race/Ethnicity and Age Group, National Health and Nutrition Examination Survey, 2007–2012
This web page is archived for historical purposes and is no longer being updated. Newer data is available on the STD Data and Statistics page.

NOTE: Error bars indicate 95% confidence intervals.
SOURCE: Torrone E, Papp J, Weinstock H; Centers for Disease Control and Prevention (CDC). Prevalence of Chlamydia trachomatis genital infection among persons aged 14–39 — United States, 2007–2012. MMWR Morb Mortal Wkly Rep. 2014 Sep 26;63(38):834–8.
- Page last reviewed: October 17, 2016 (archived document)
- Content source:


 ShareCompartir