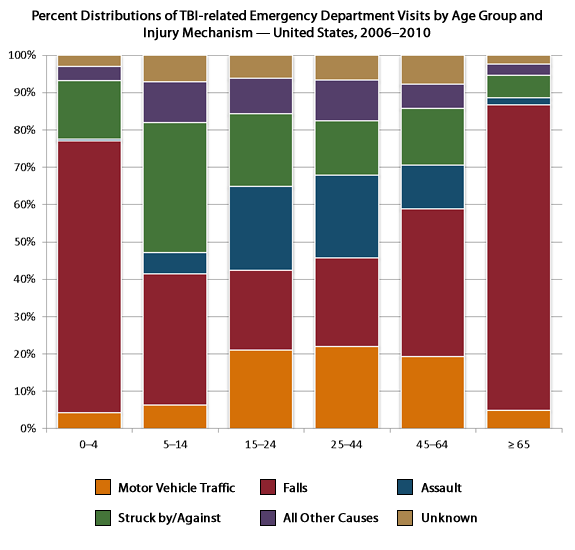
Percent Distributions of TBI-related Emergency Department Visits by Age Group and Injury Mechanism — United States, 2006–2010
The injury mechanisms (external causes of injury) associated with TBI-related ED visits vary by age group. Falls are the primary mechanisms of TBI-related ED visits in the youngest (0–4 years) and oldest (65 years and older) age groups, accounting for 72.8% and 81.8% of TBI-related ED visits, respectively. Injuries caused by being struck by/against an object (34.9%) and falls (35.1%) account for the majority of injury in youth 5–14 years of age with respect to TBI-related ED visits. For persons in age groups 15–24 years and 25–44 years, the proportions of TBI-related ED visits due to assaults, falls, and motor vehicle traffic events are nearly equal within and across both age groups.

| Motor Vehicle Traffic | Falls | Assault | Struck by/Against | All Other Causes | Unknown | |
|---|---|---|---|---|---|---|
| 0–4 | 14,655 | 250,413 | 1,513 | 53,761 | 13,222 | 10,225 |
| 5–14 | 18,110 | 101,790 | 16,612 | 101,112 | 31,355 | 20,763 |
| 15–24 | 76,602 | 77,951 | 81,822 | 71,031 | 34,486 | 22,722 |
| 25–44 | 75,122 | 80,867 | 75,527 | 49,505 | 36,933 | 22,855 |
| 45–64 | 46,923 | 95,824 | 28,206 | 36,925 | 15,843 | 18,804 |
| ≥ 65 | 10,359 | 174,544 | 4,068 | 12,815 | 6,285 | 5,216 |
Source:
- National Hospital Ambulatory Medical Care Survey — United States, 2001–2010 (Emergency Department Visits)
- Page last reviewed: January 22, 2016
- Page last updated: January 22, 2016
- Content source:
- Centers for Disease Control and Prevention,
- National Center for Injury Prevention and Control,
- Division of Unintentional Injury Prevention


 ShareCompartir
