Statistics
Treatment and Certified Conditions in the WTC Health Program
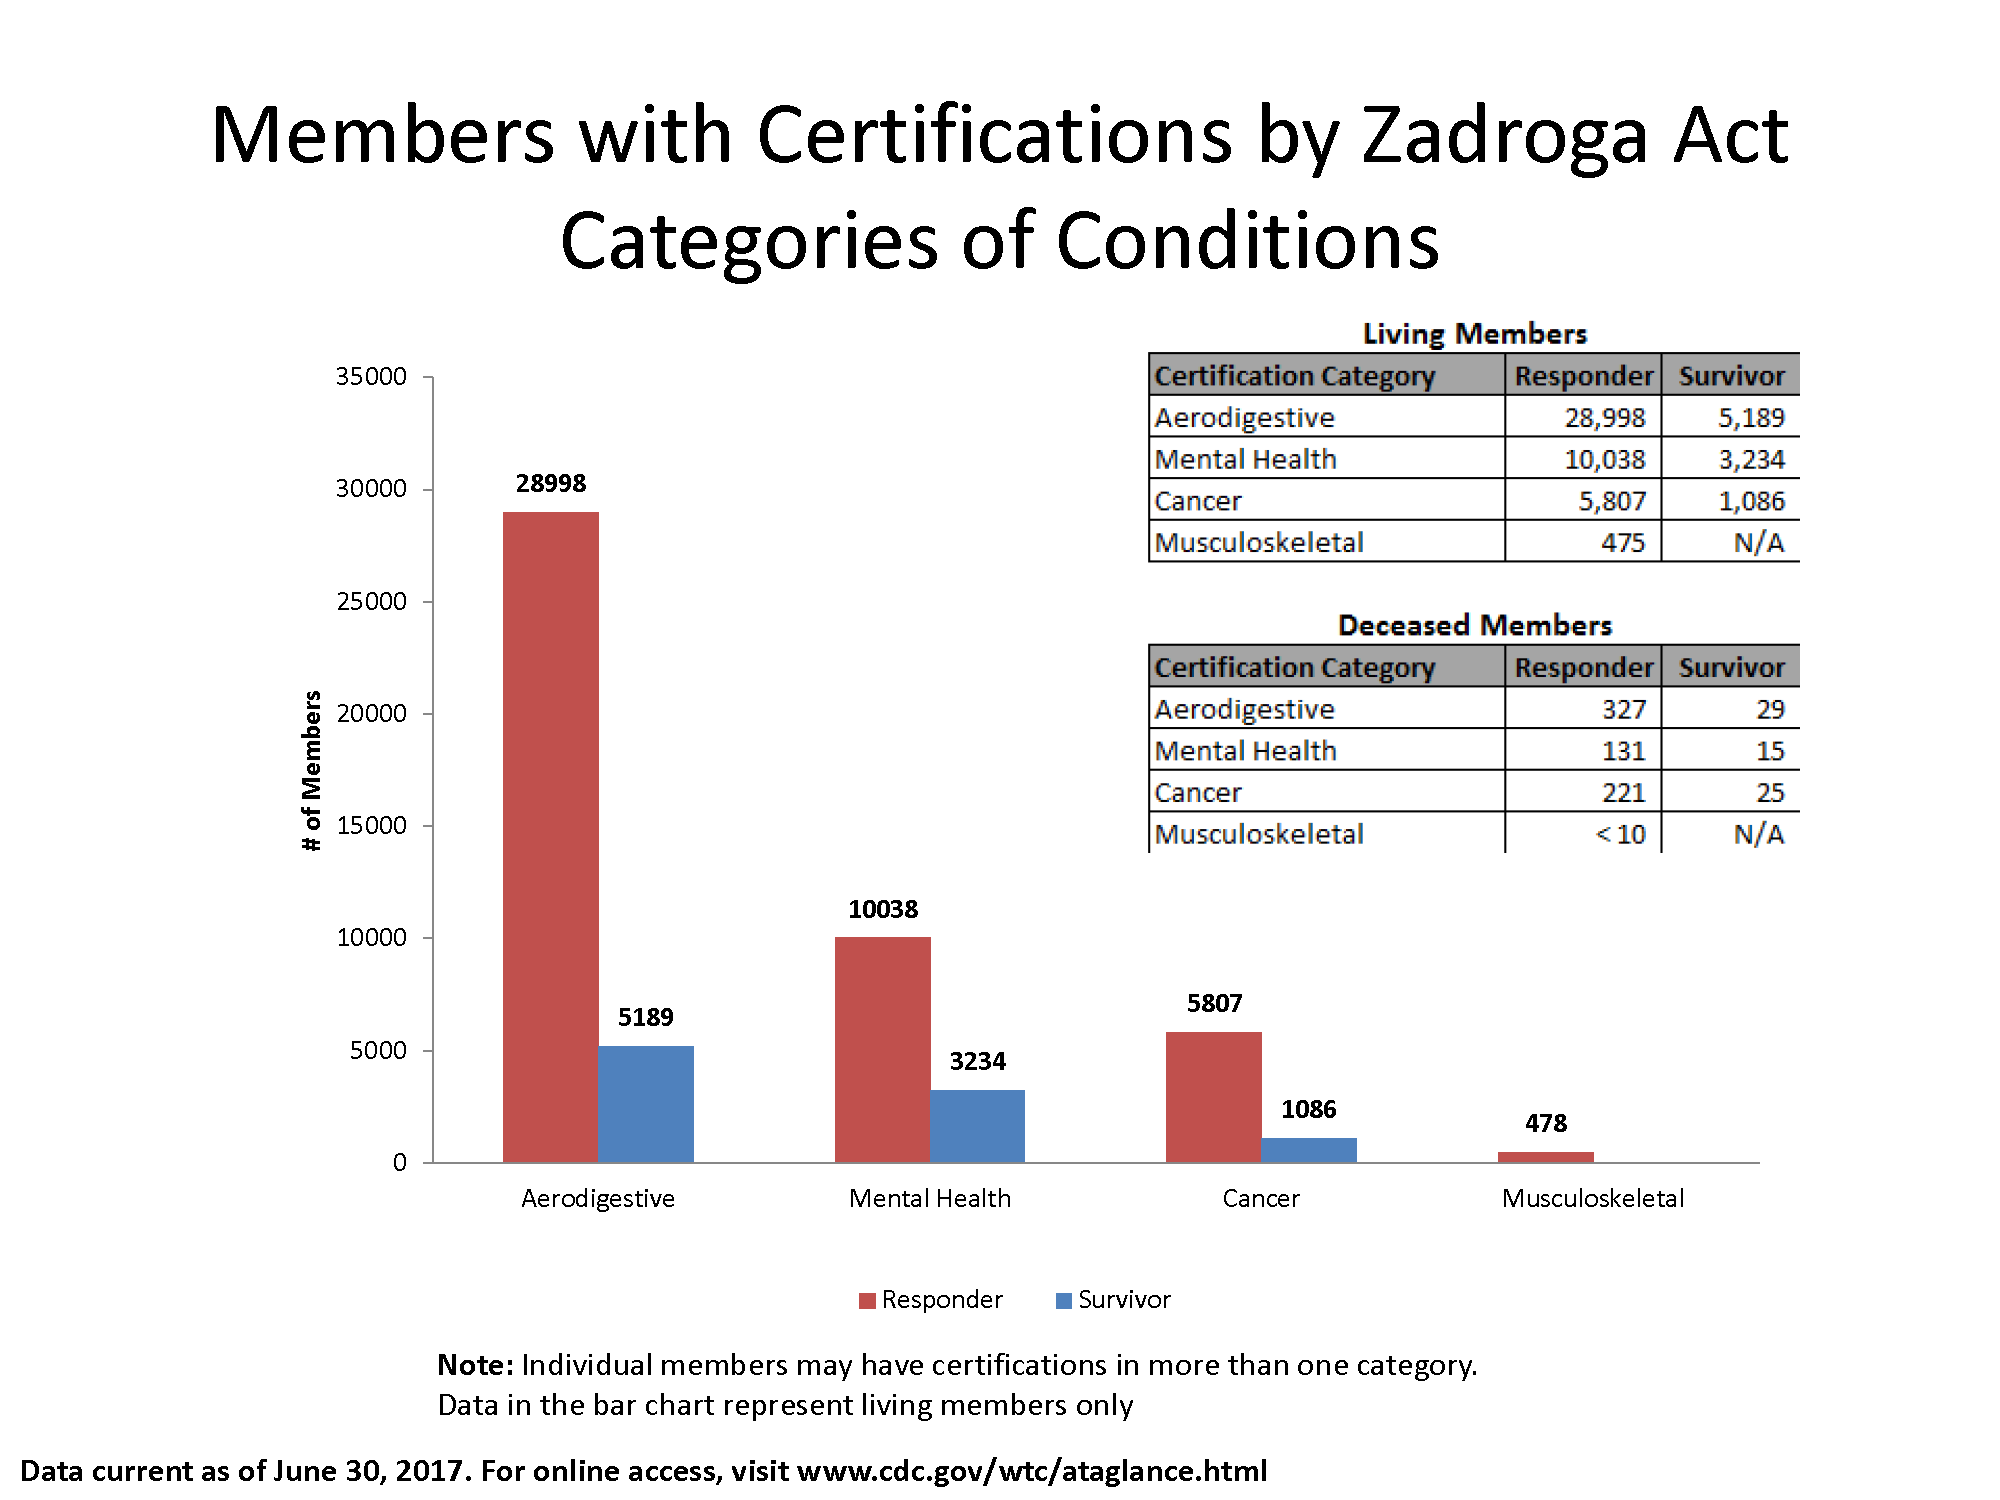
- Members with Certifications by Zadroga Act Categories of Conditions
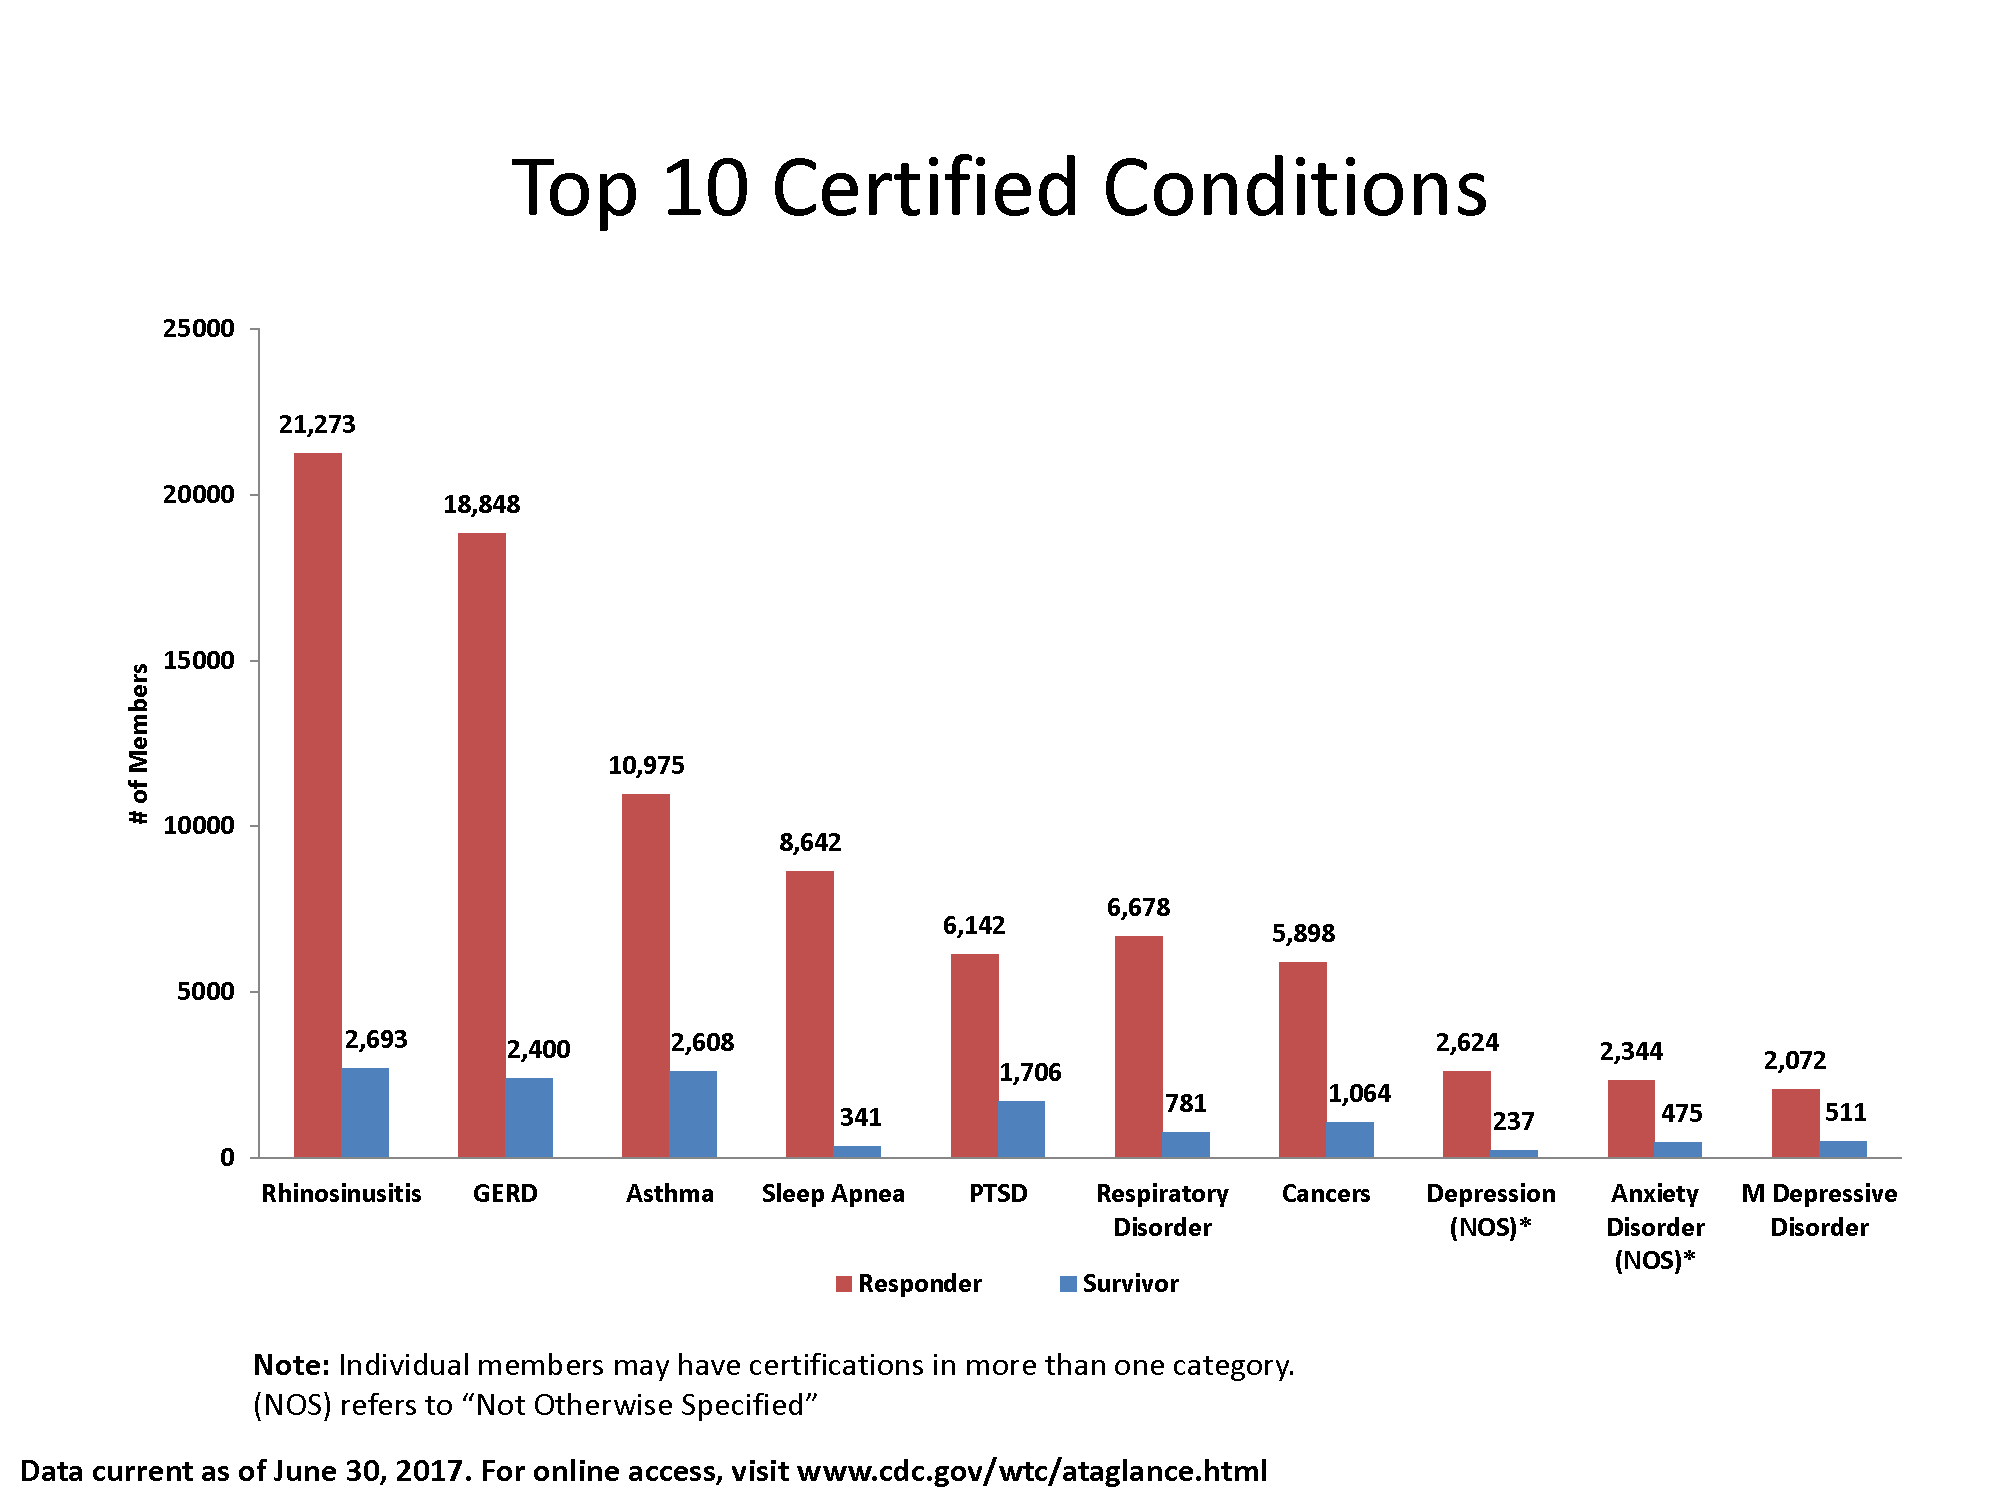
- Top 10 Certified Conditions
- Top 15 Certified Cancers
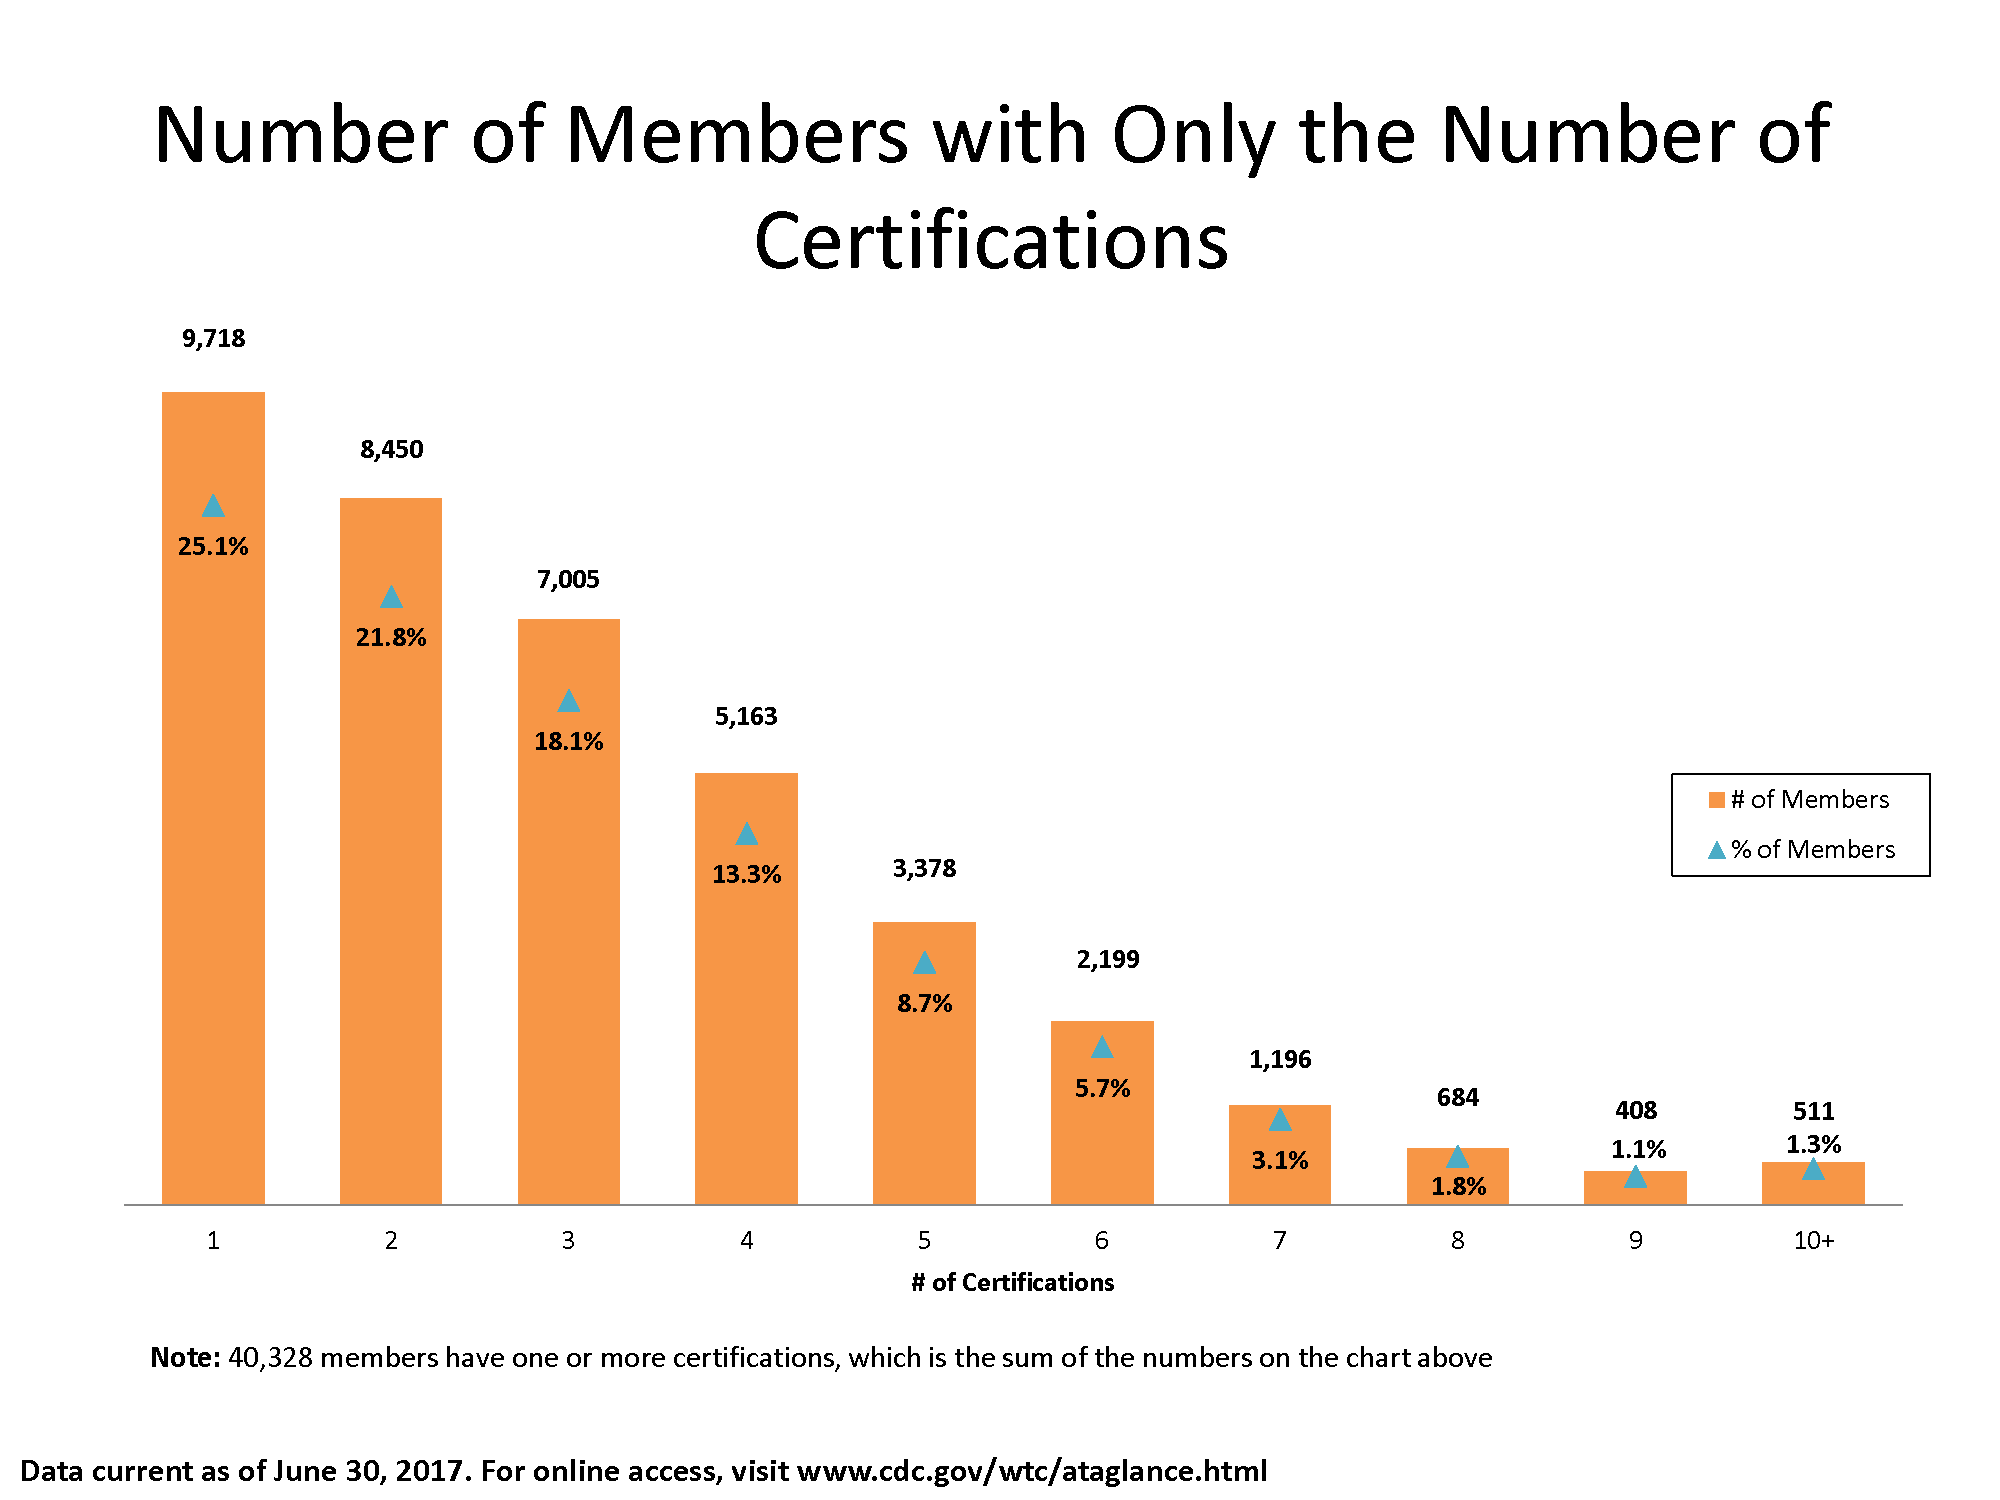
- Number of Members with 1 or Multiple Certifications
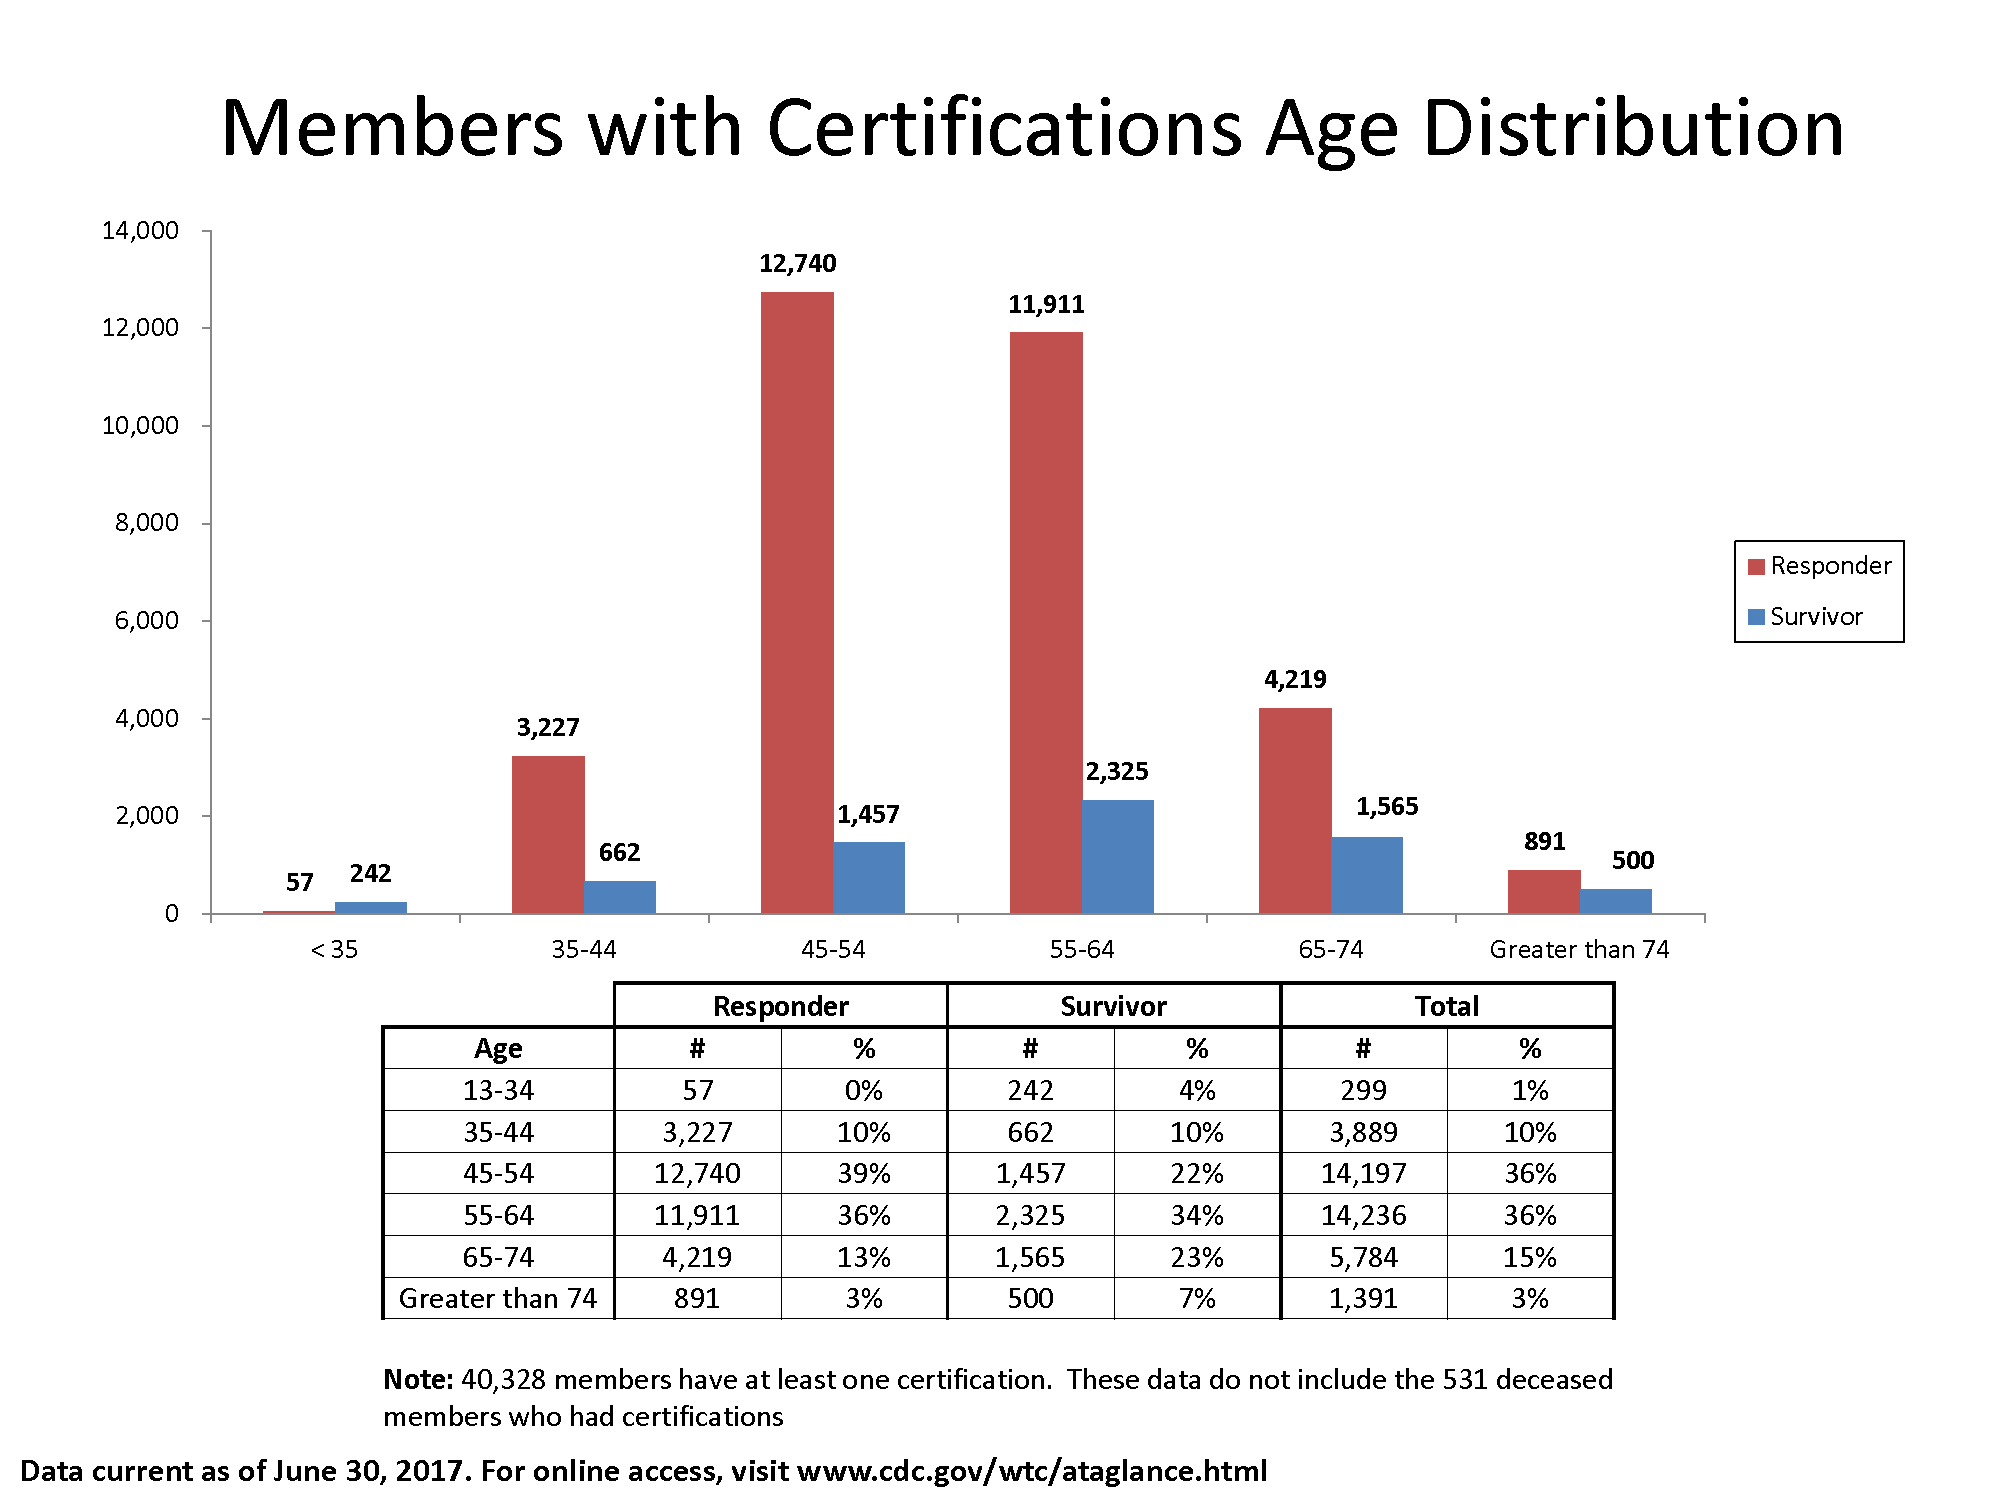
- Members with Certifications Age Distribution
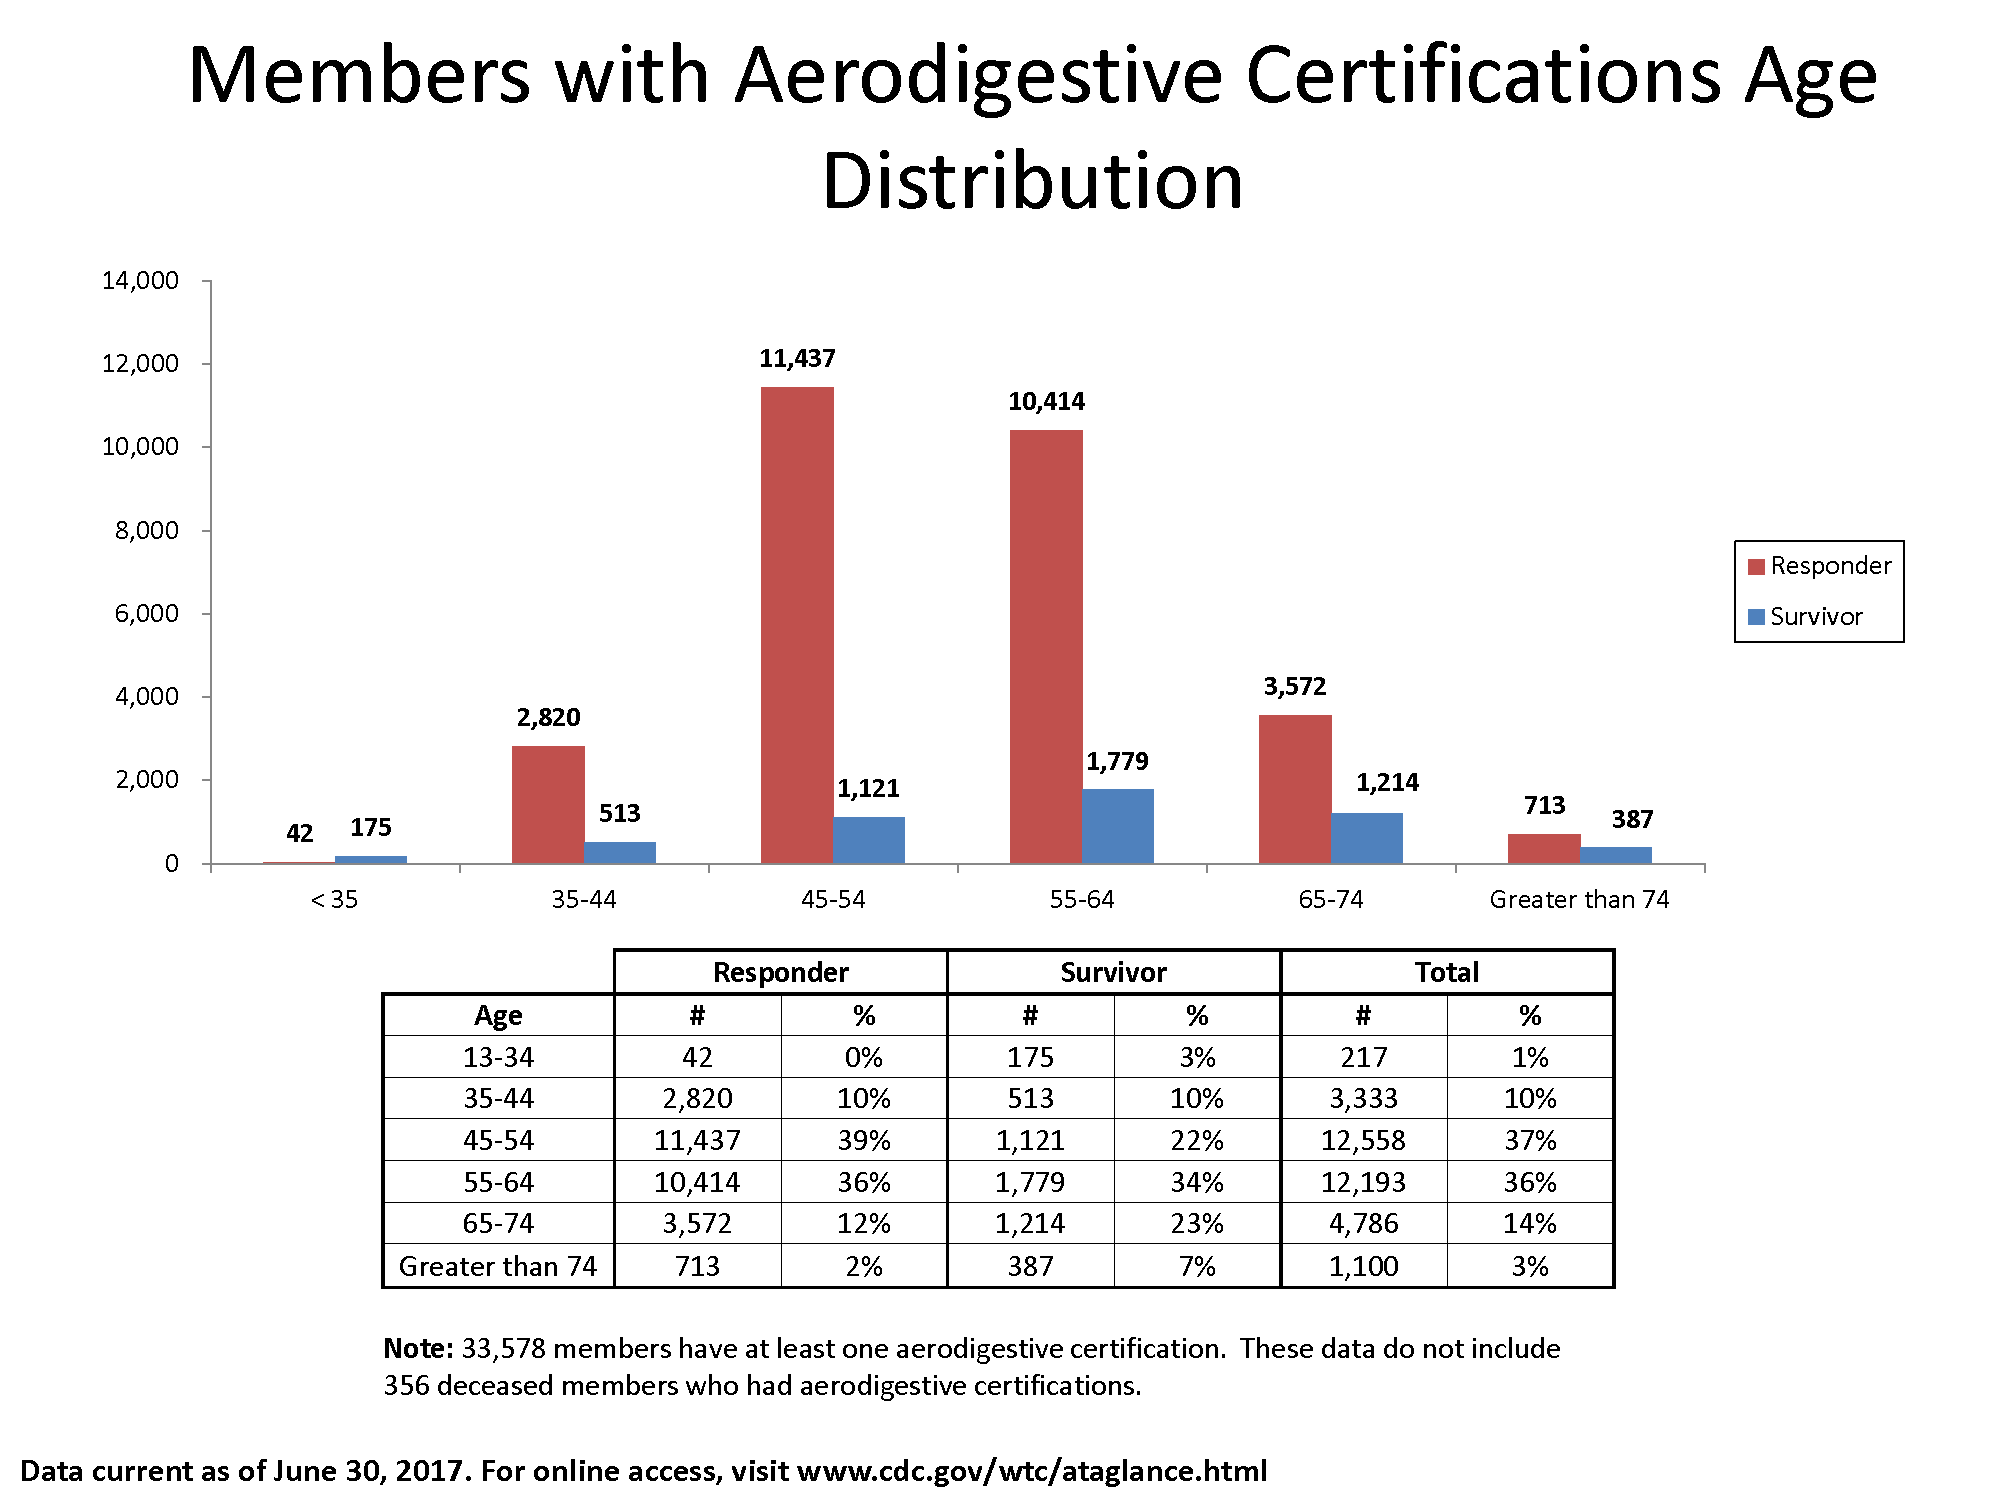
- Members with Aerodigestive Certifications Age Distribution
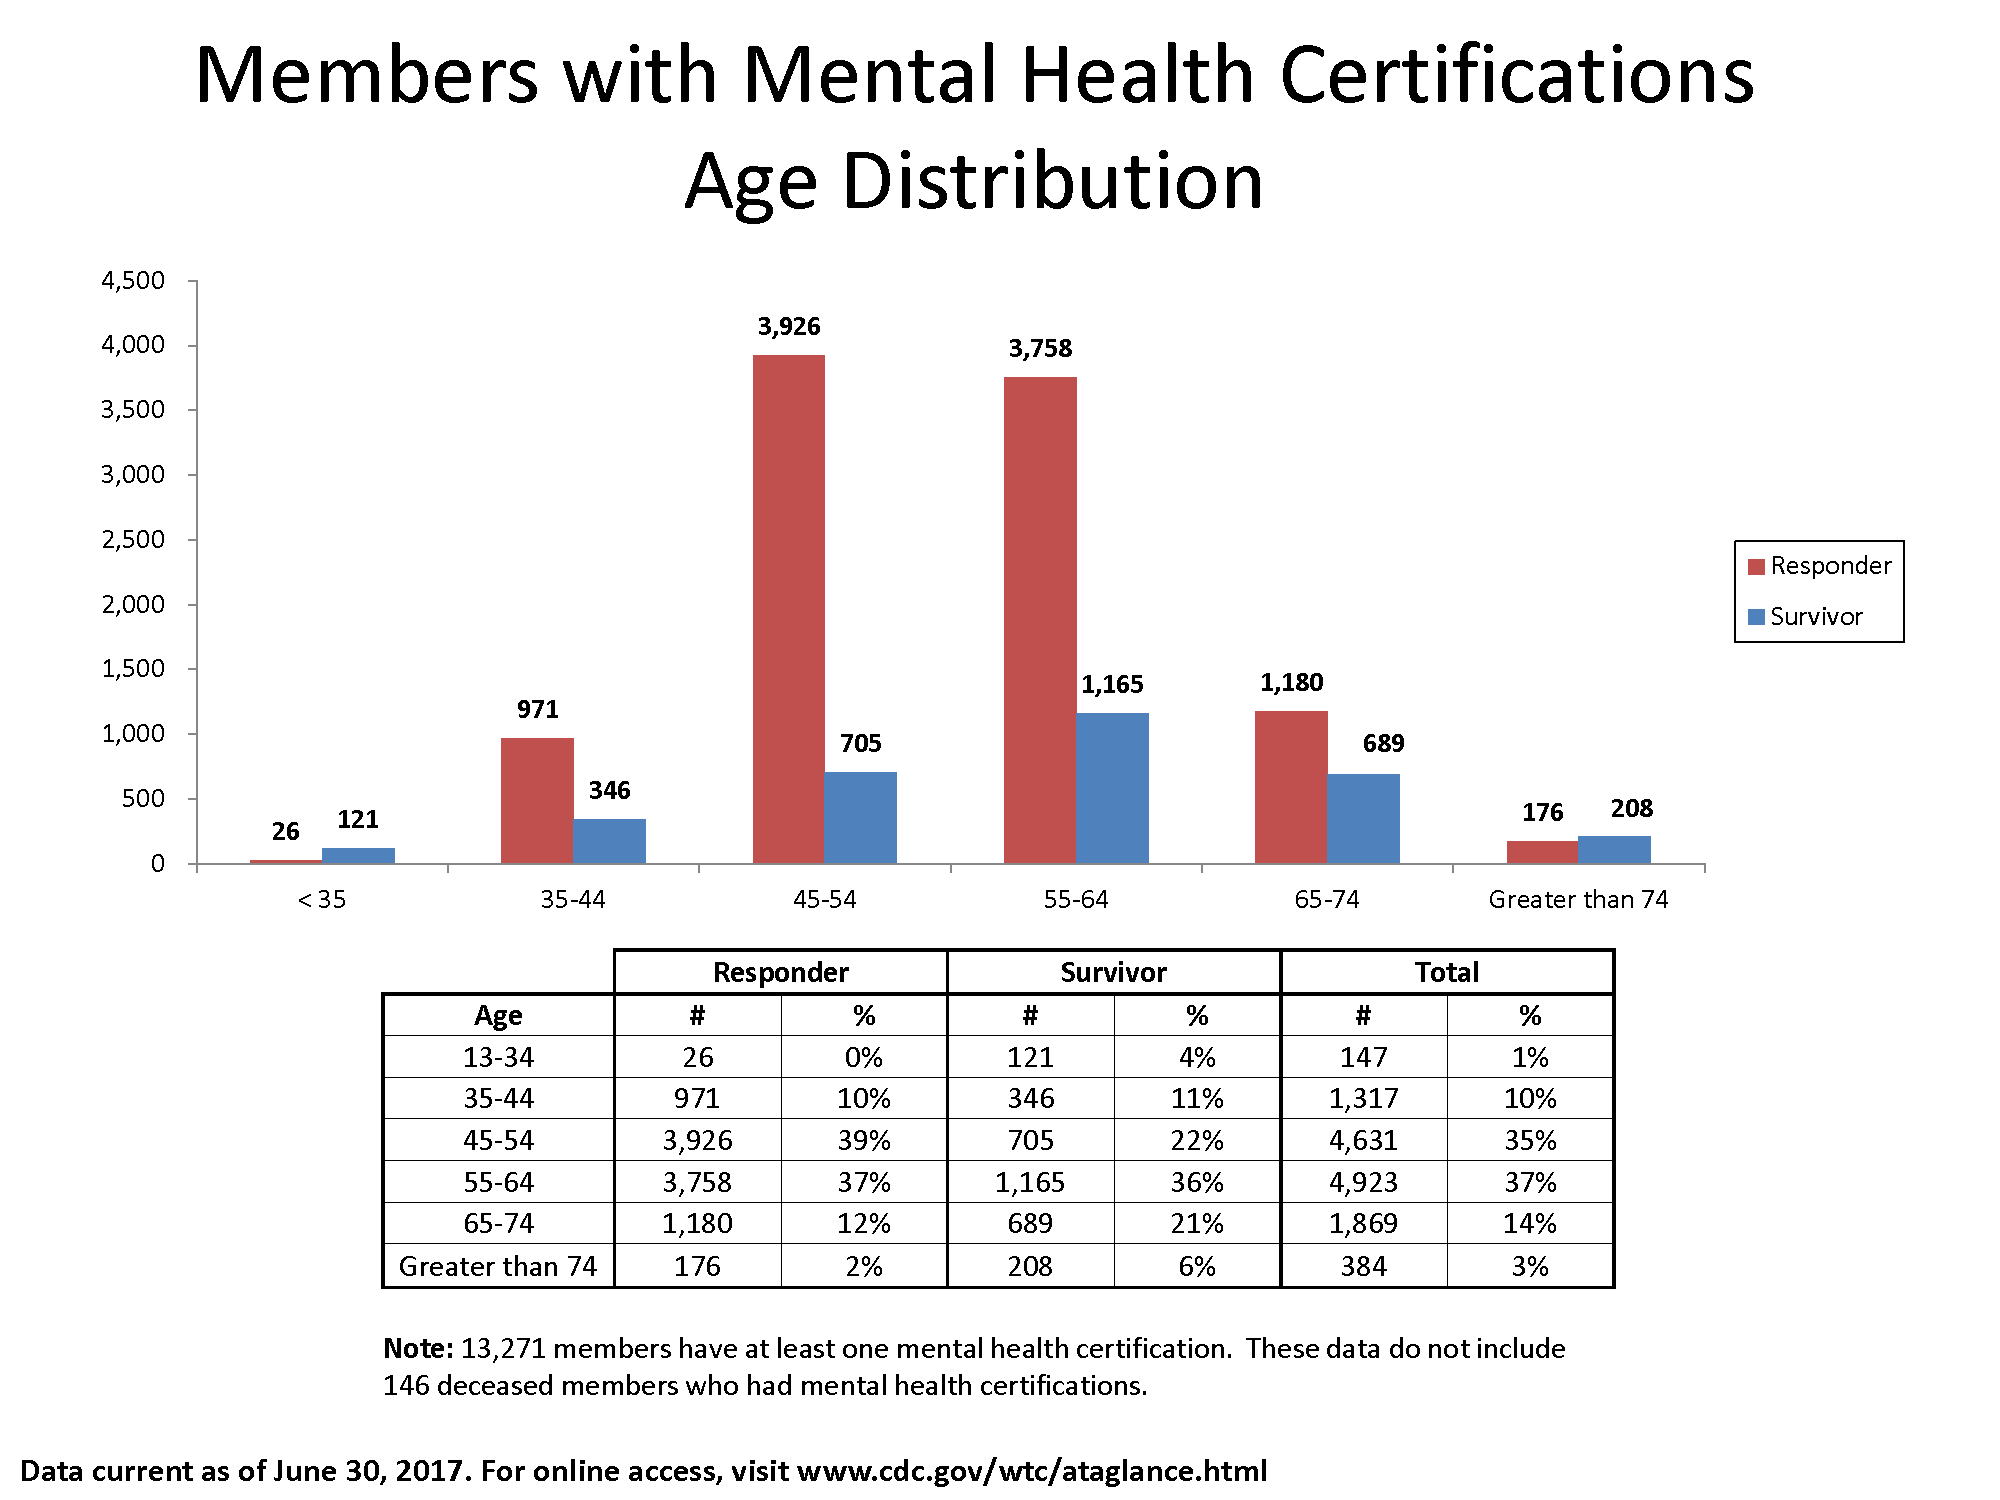
- Members with Mental Health Certifications Age Distribution
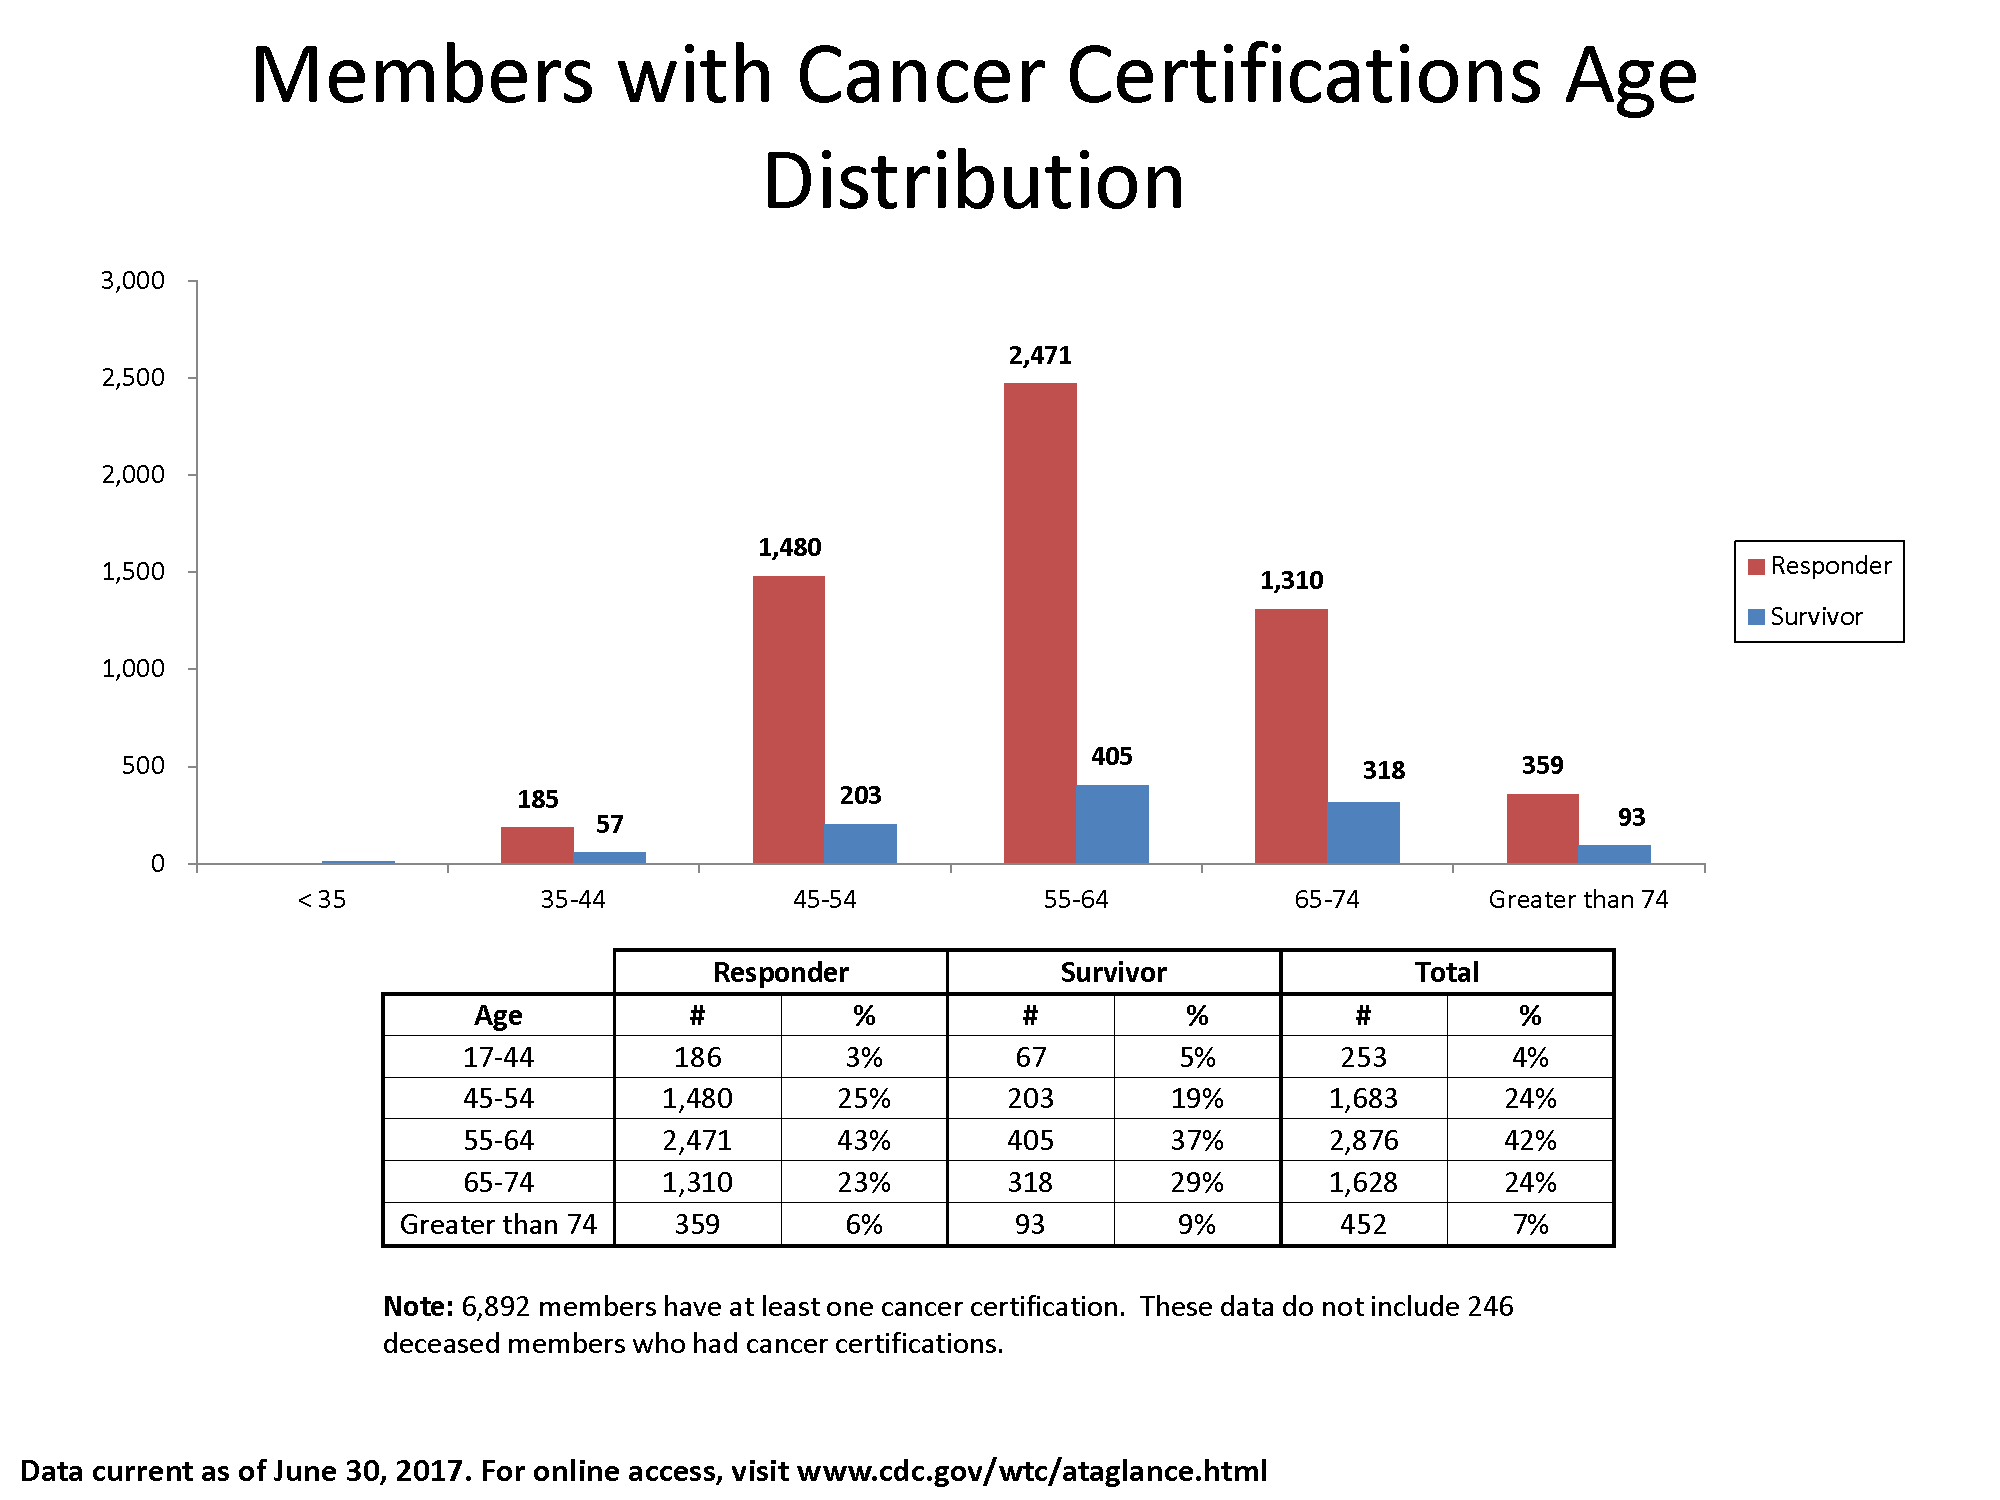
- Members with Cancer Certifications Age Distribution
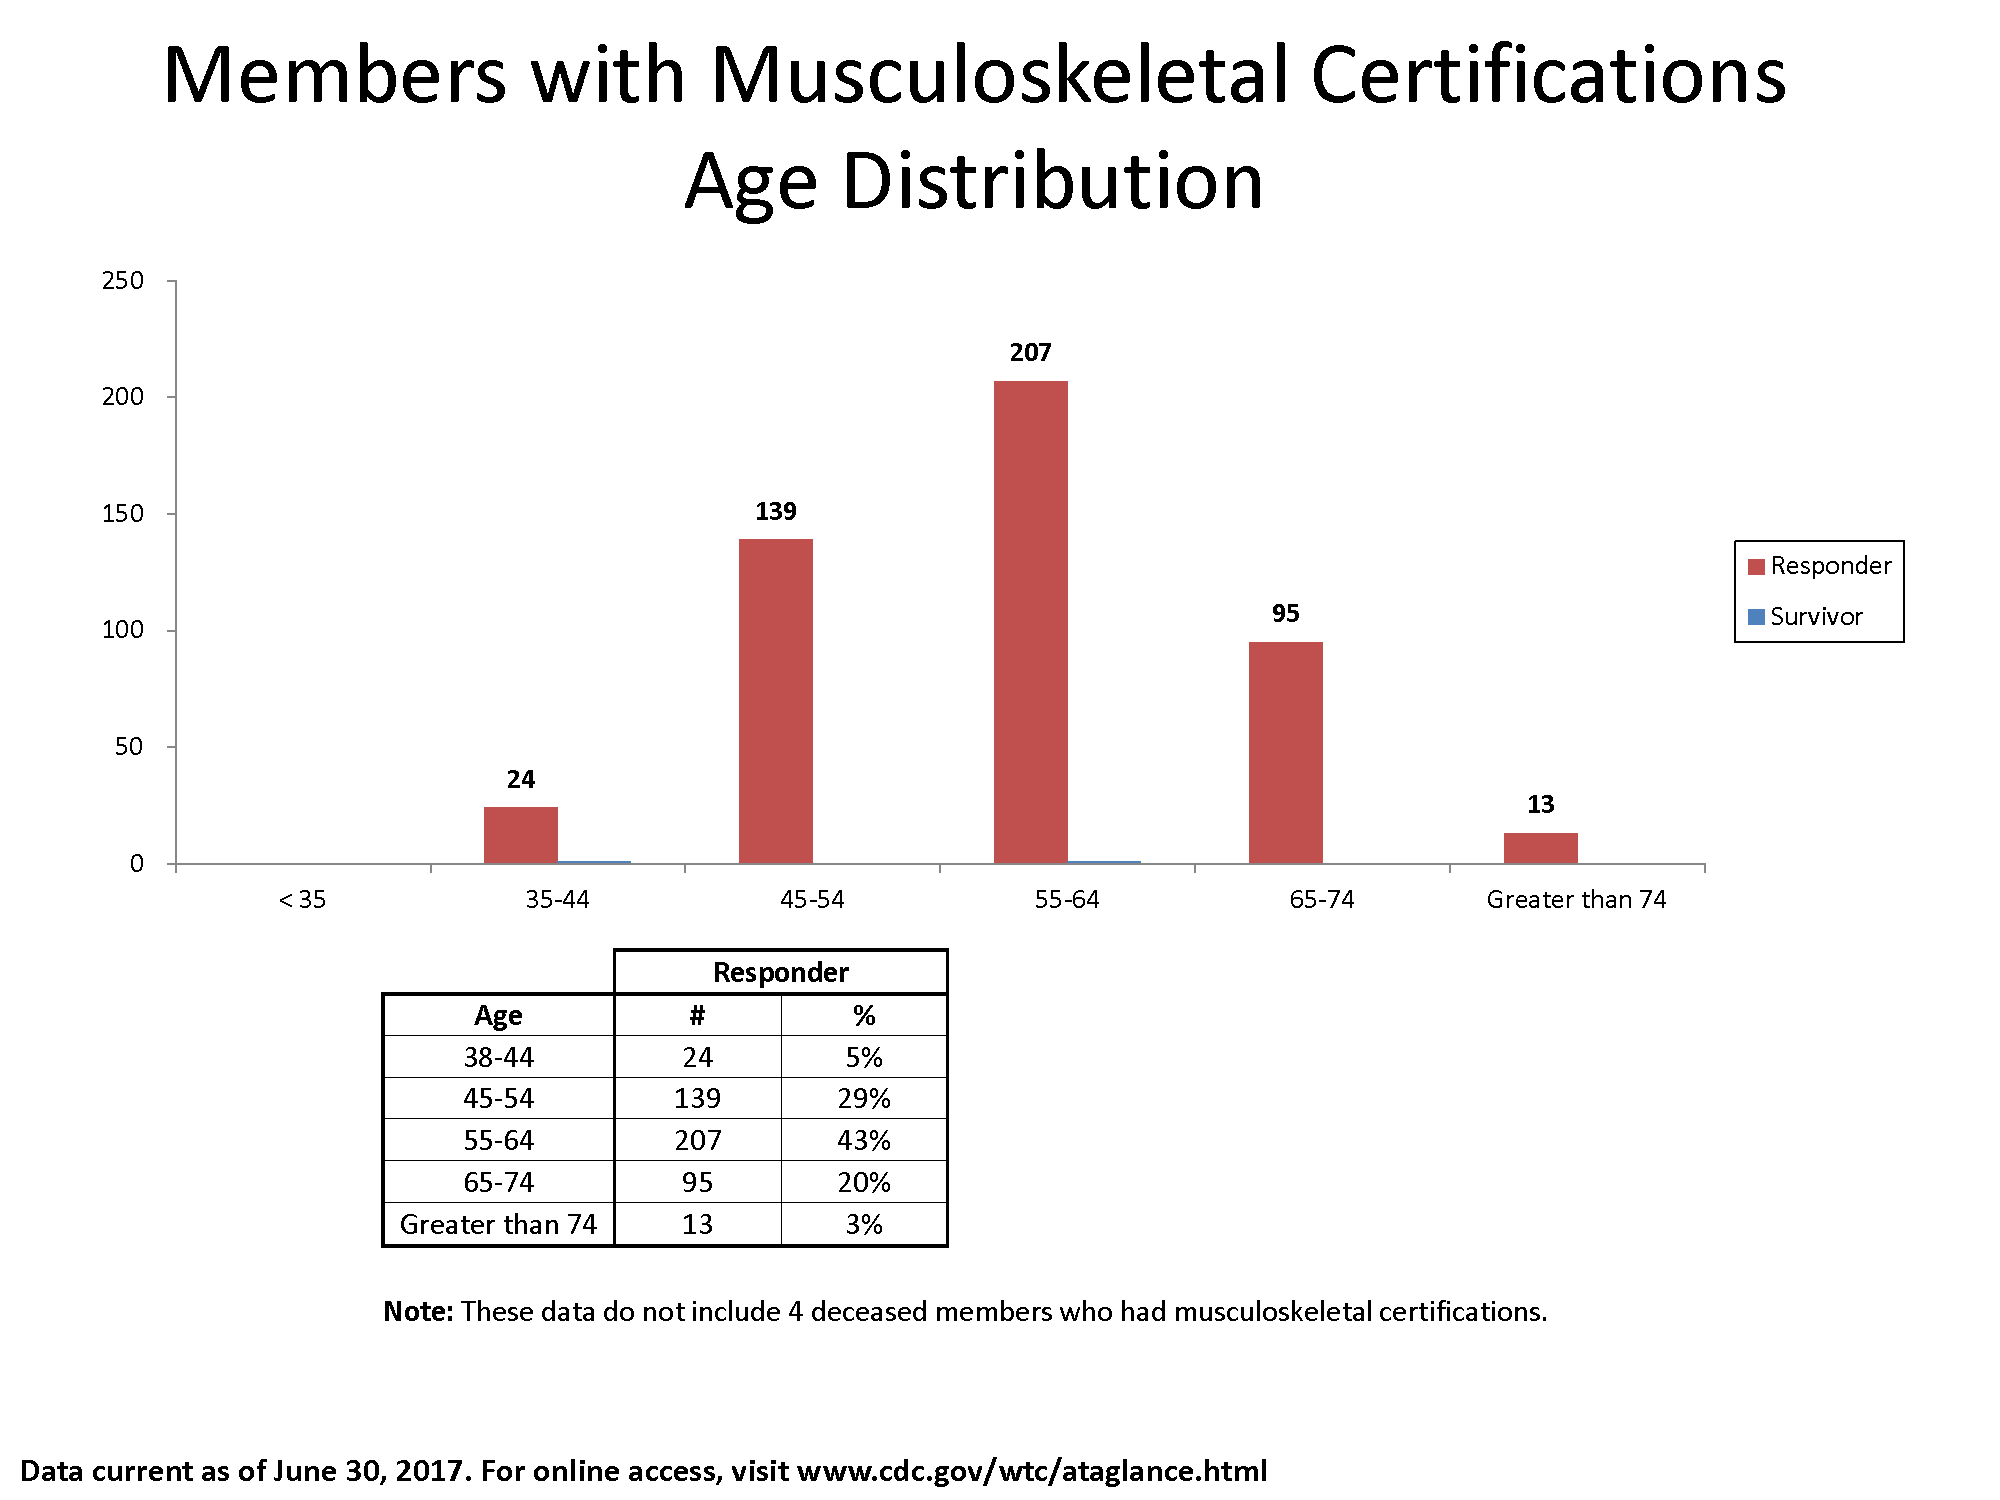
- Members with Musculoskeletal Certifications Age Distribution
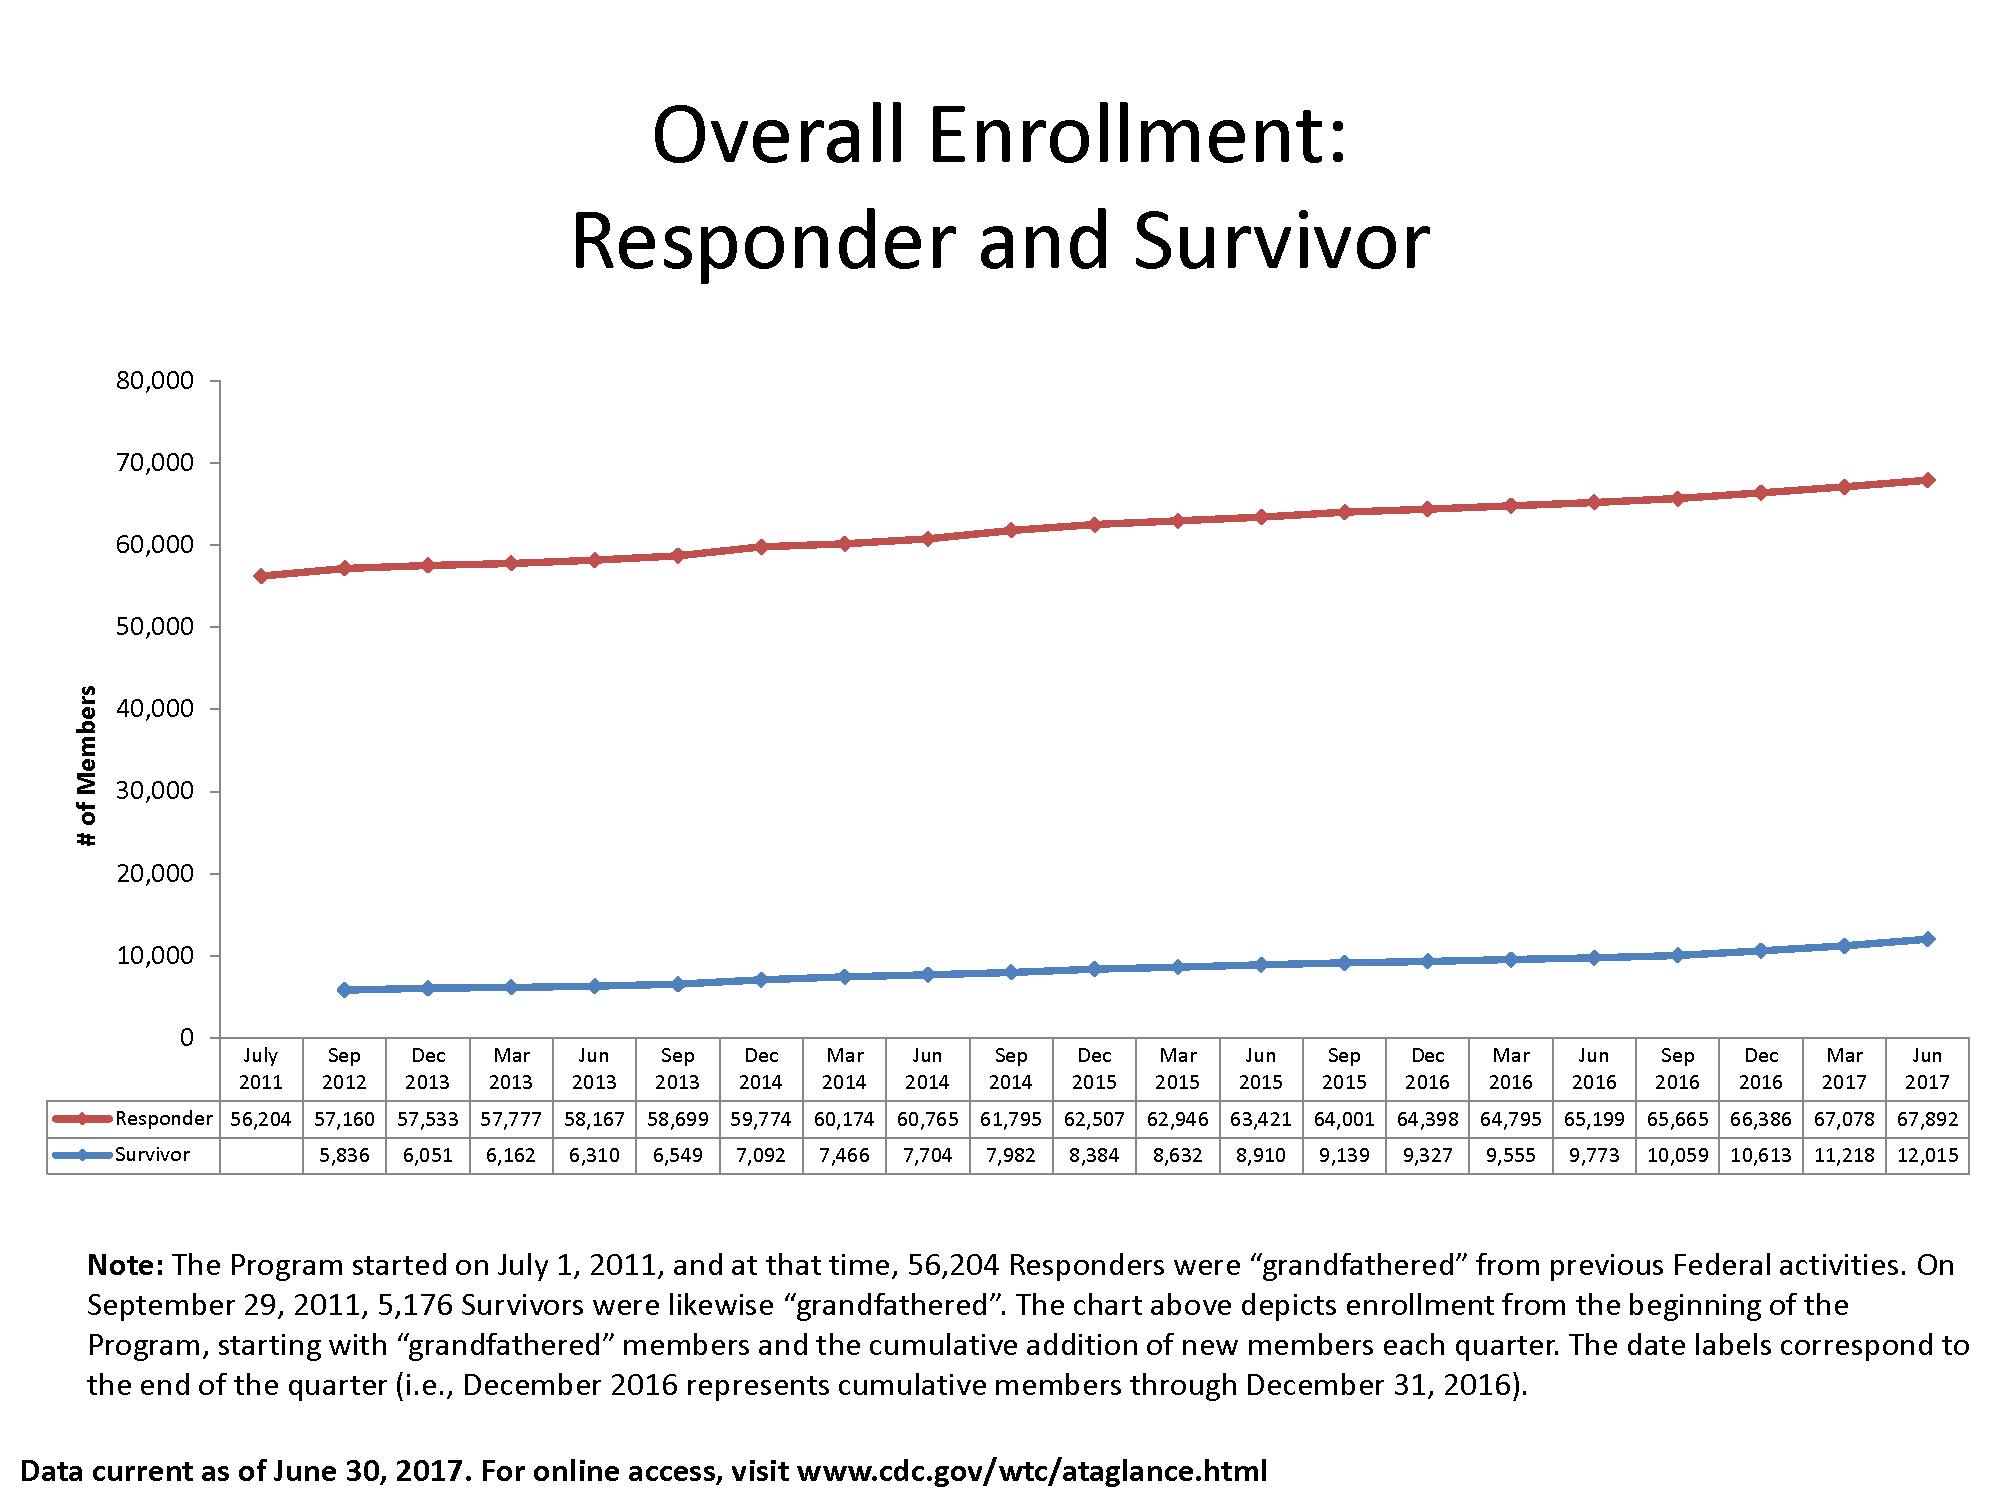
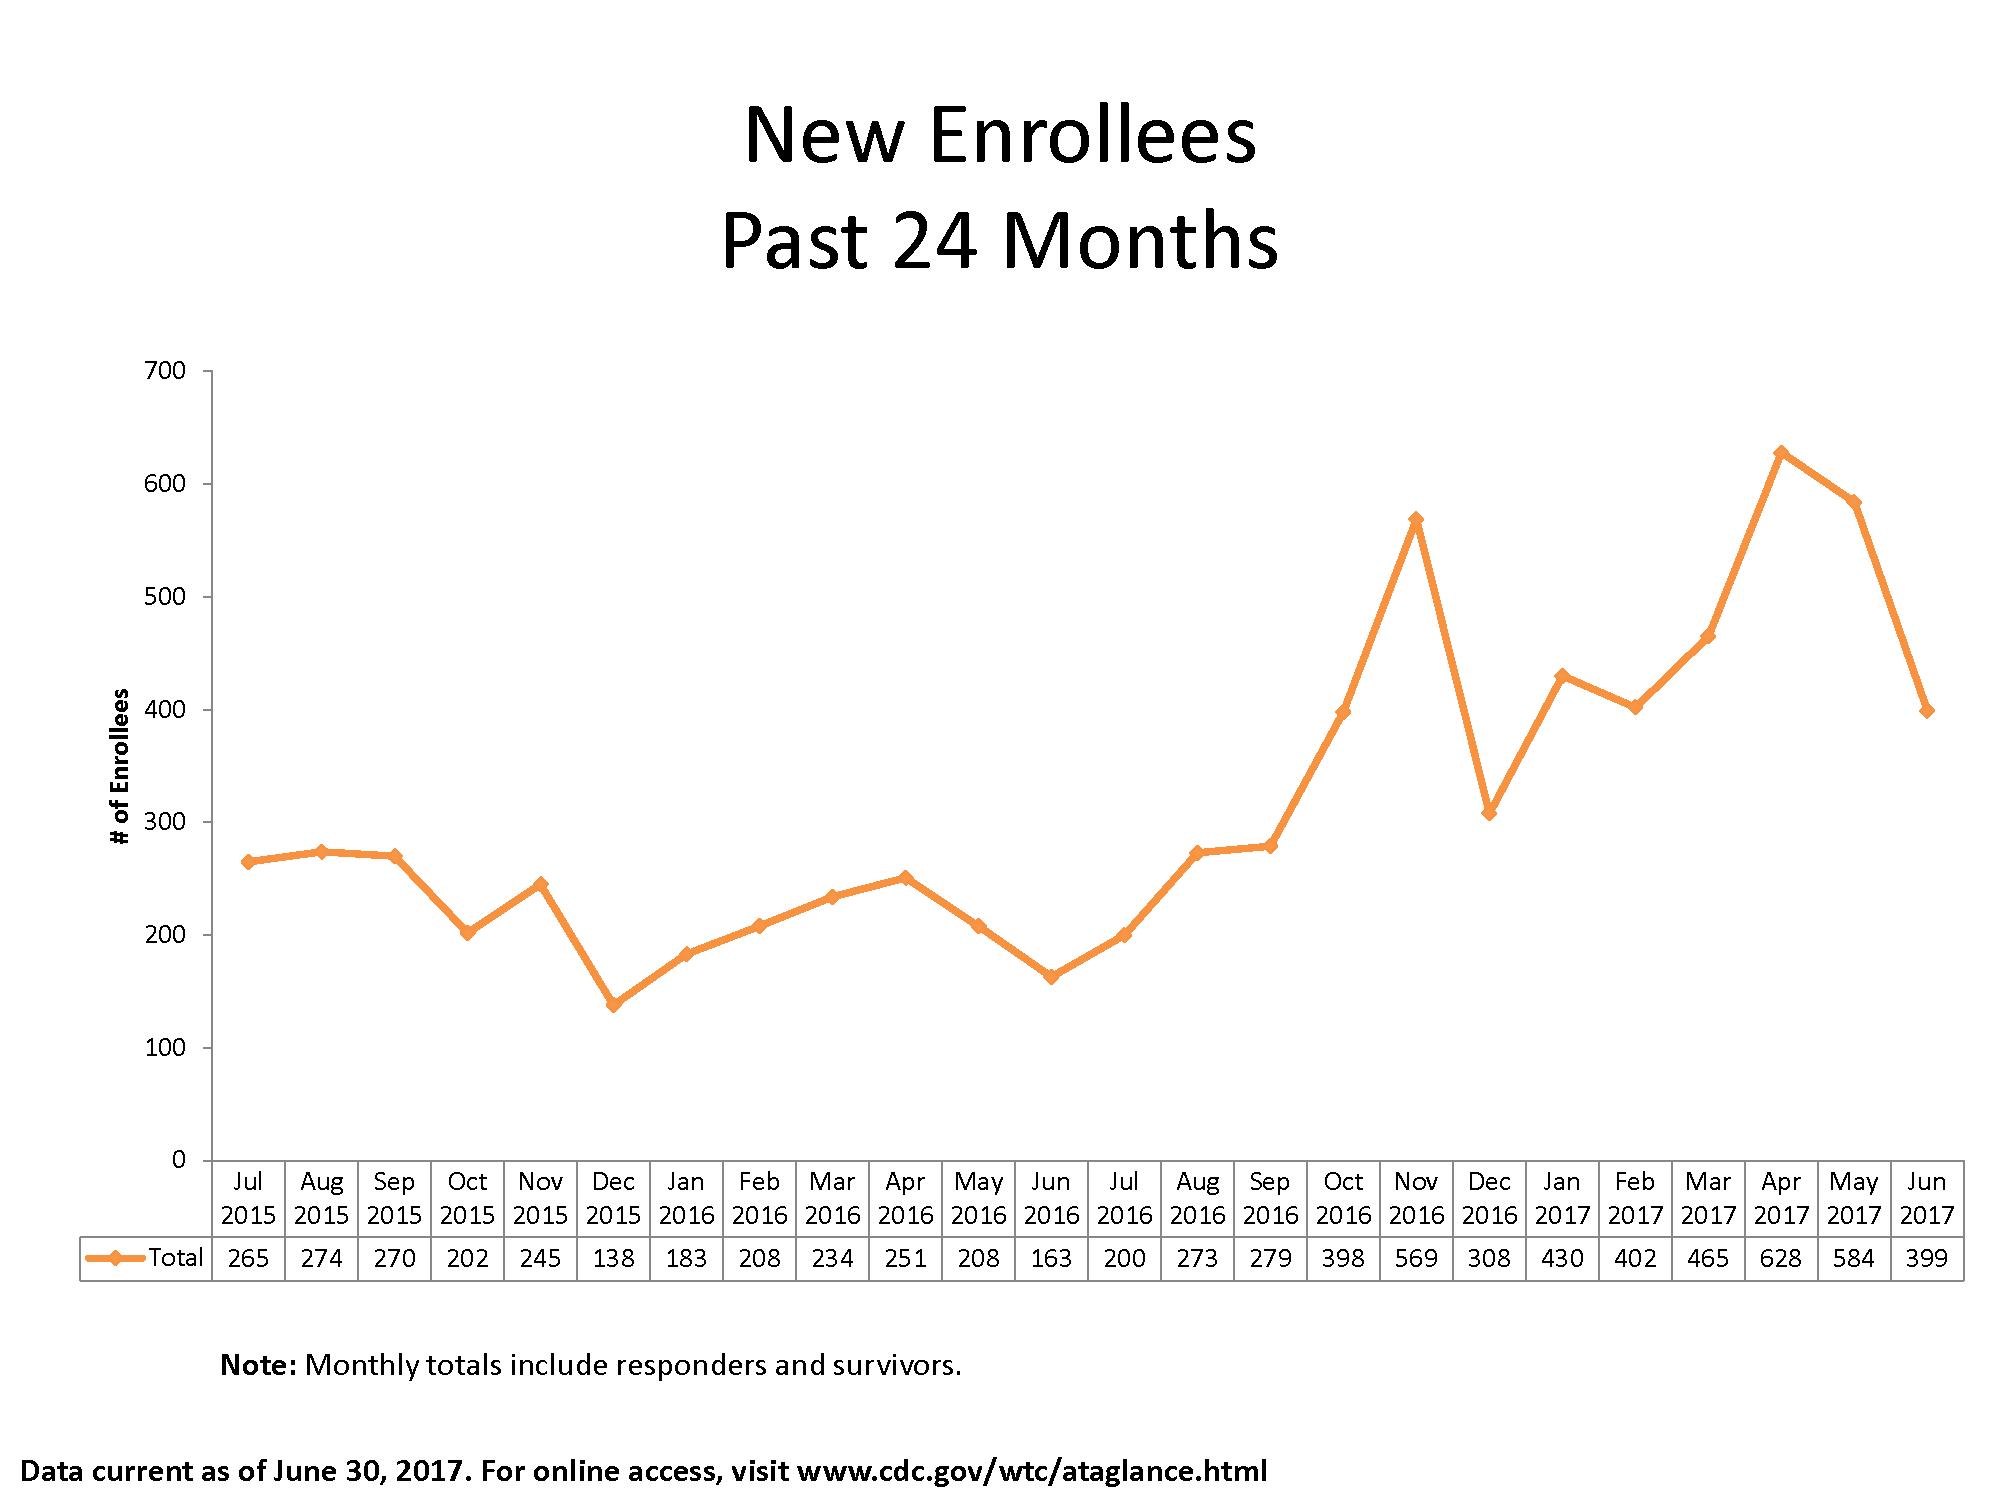
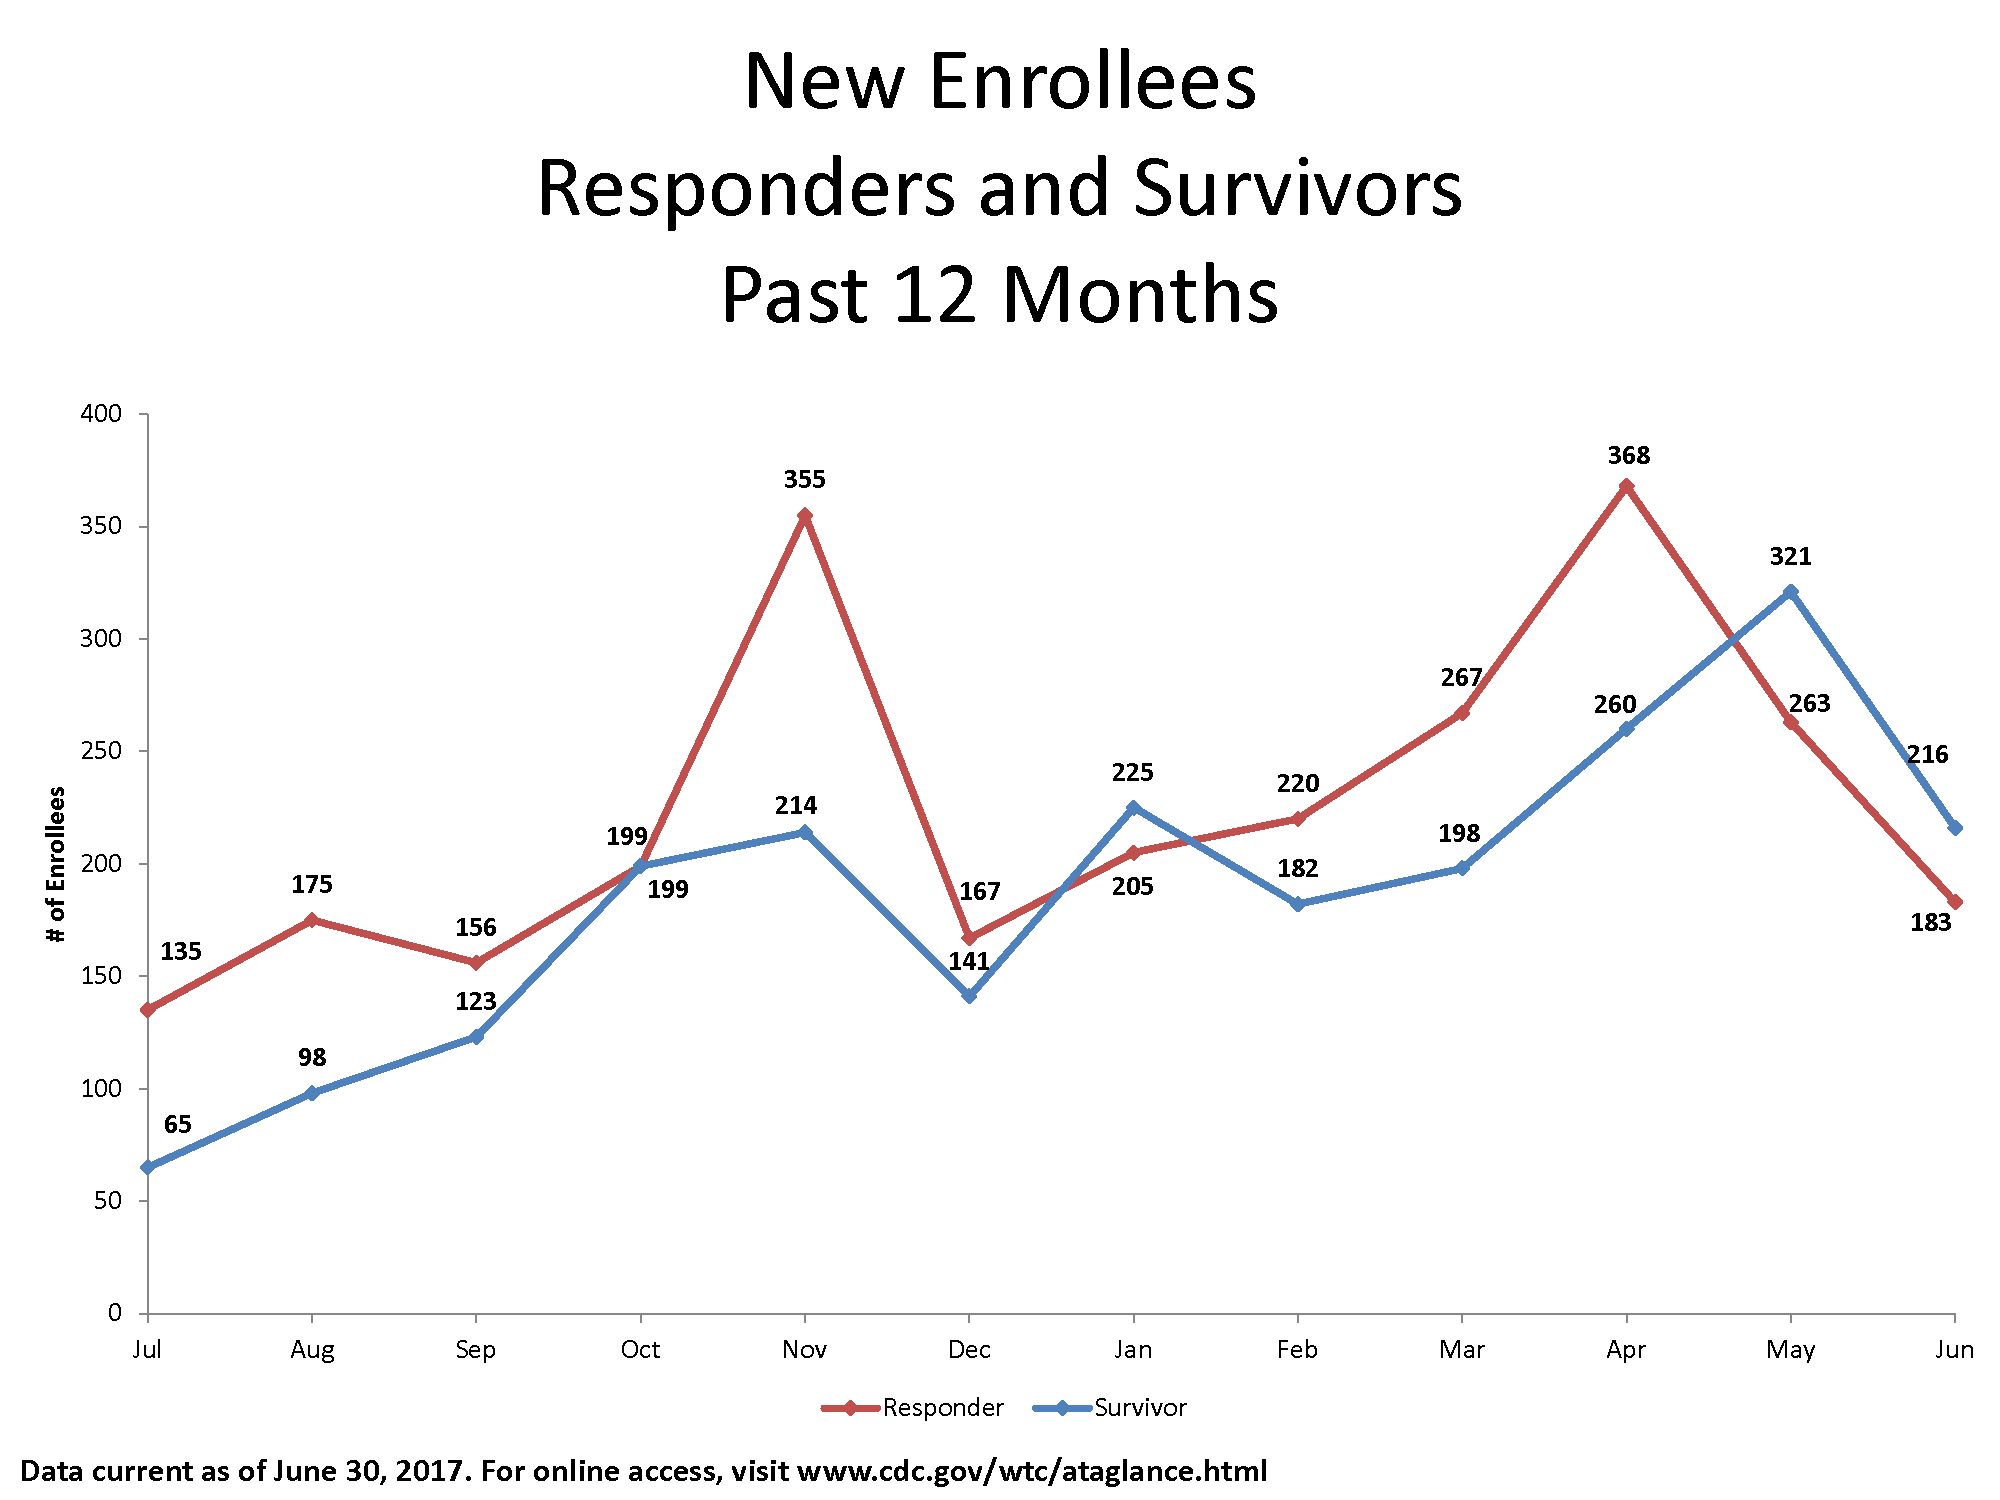
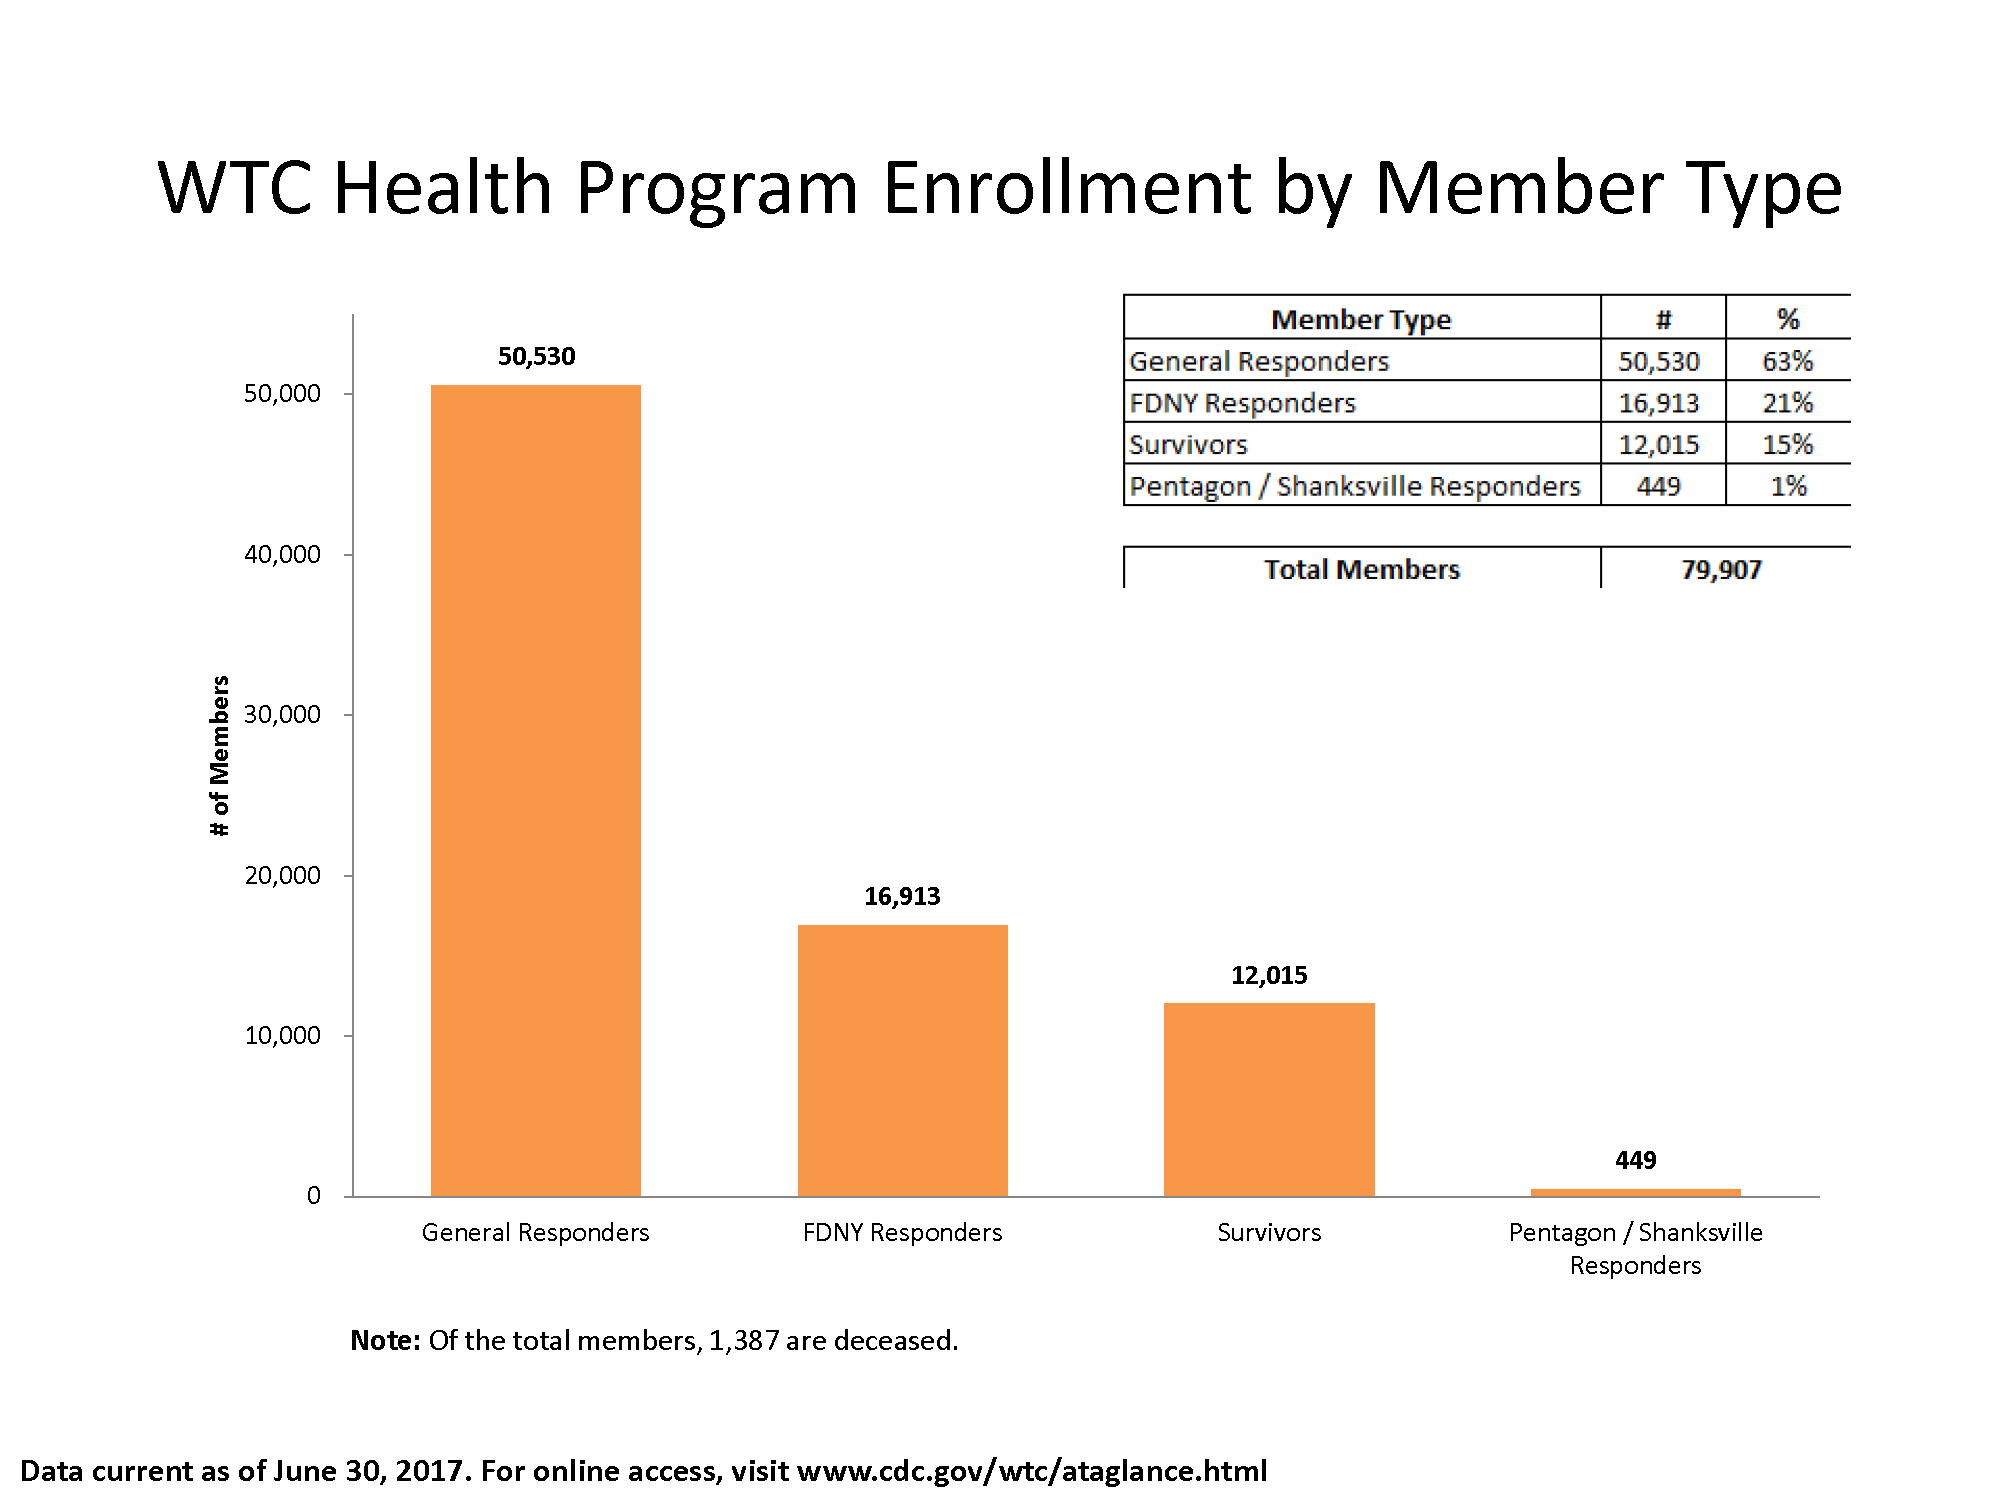
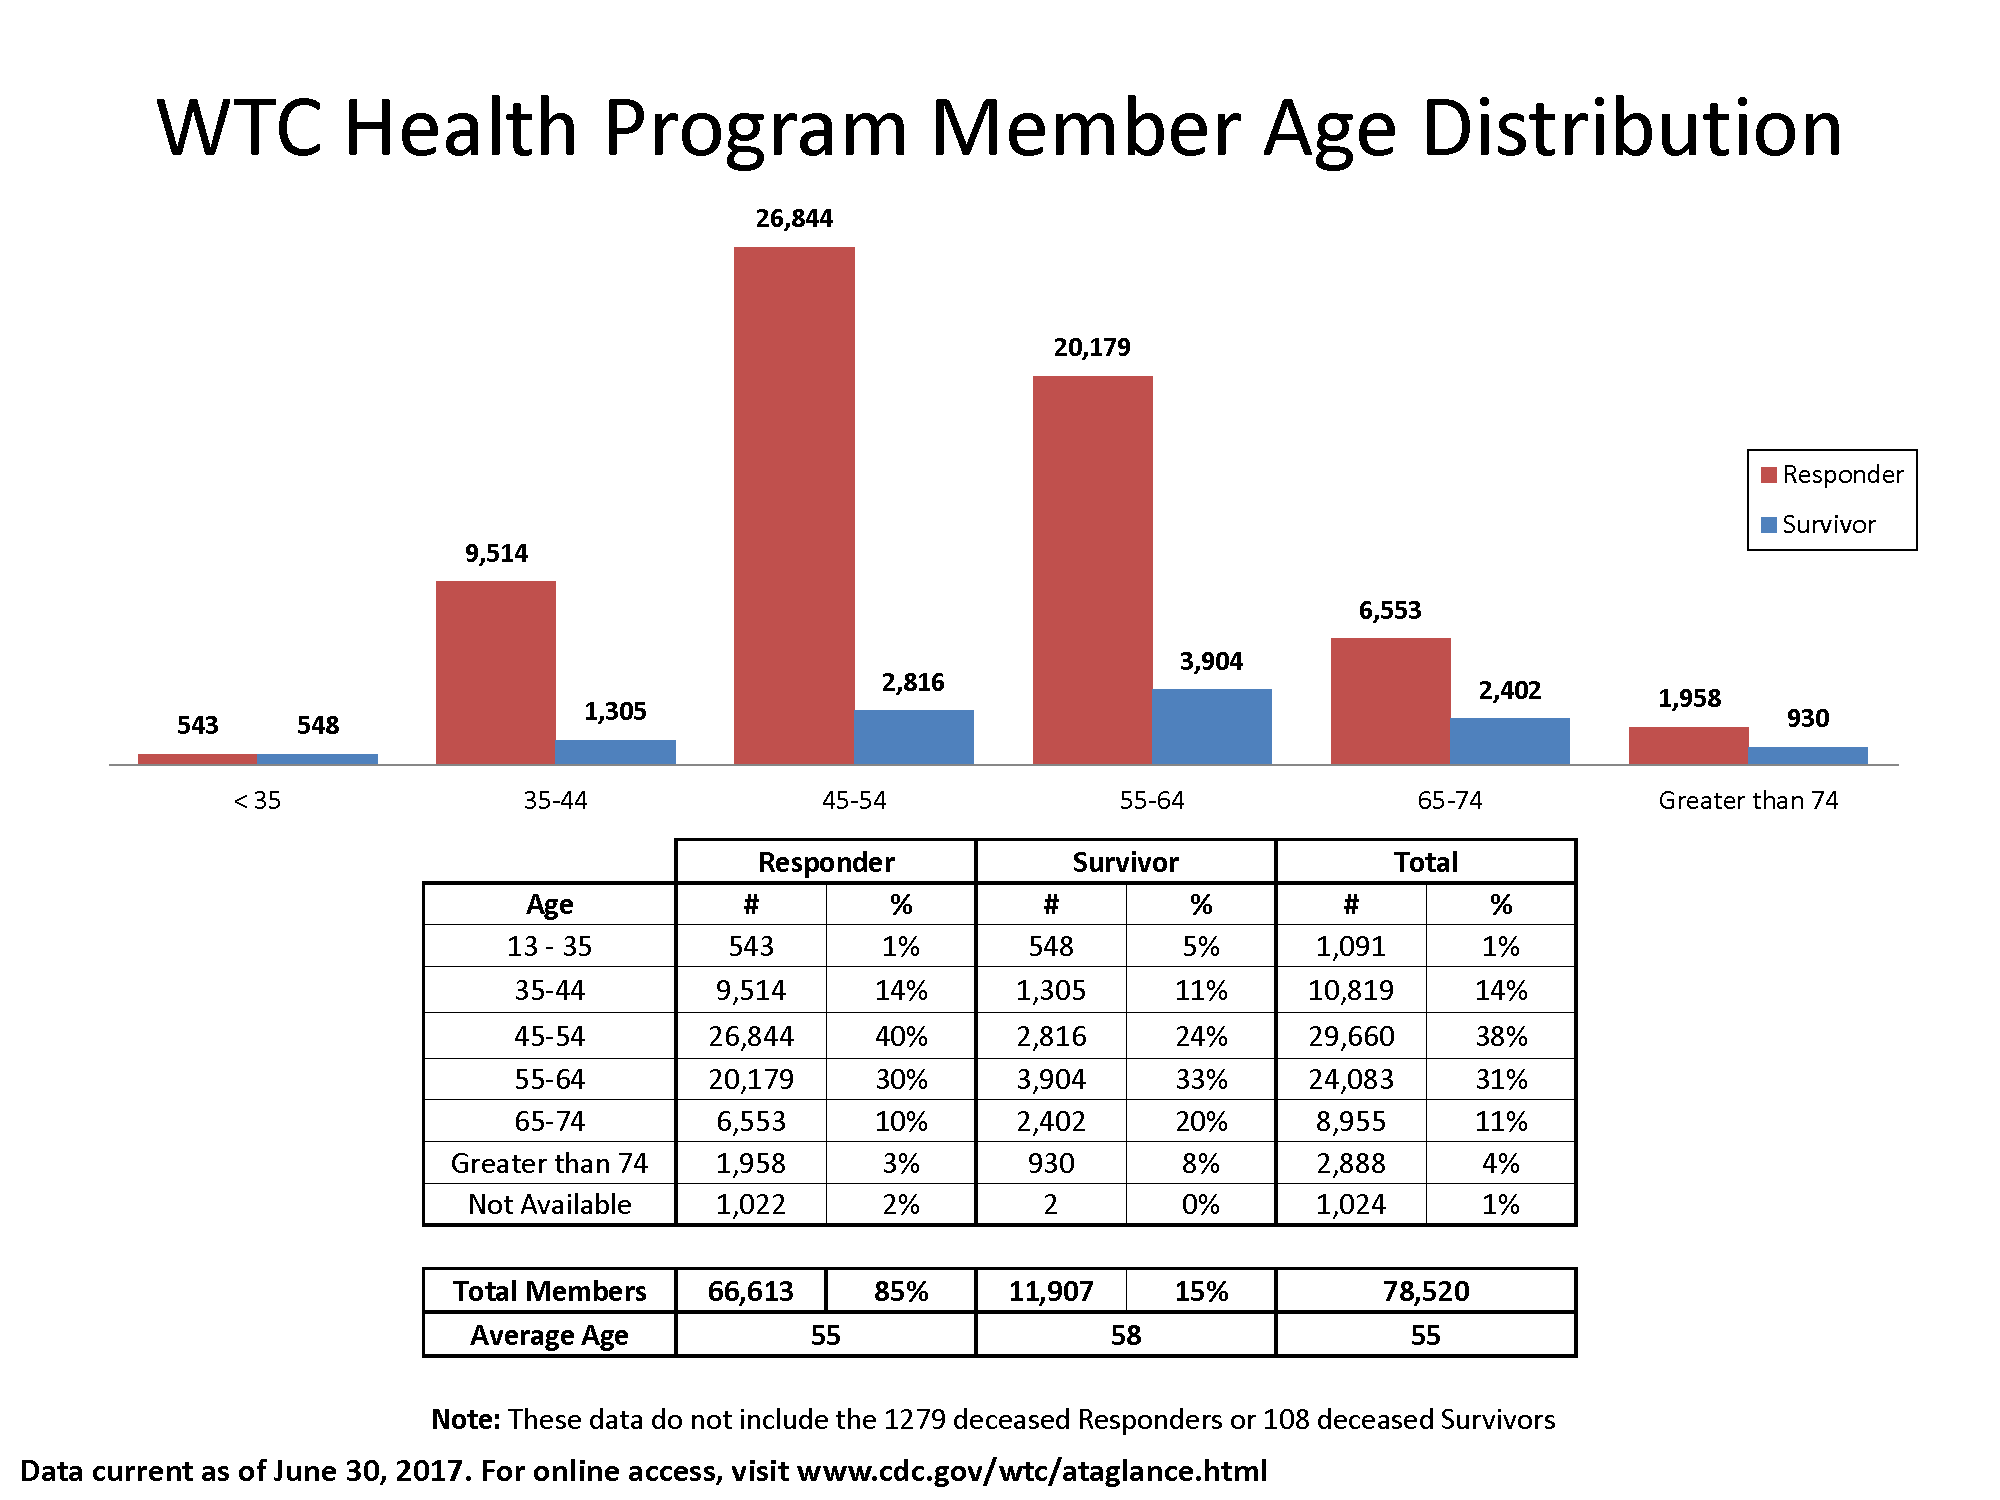
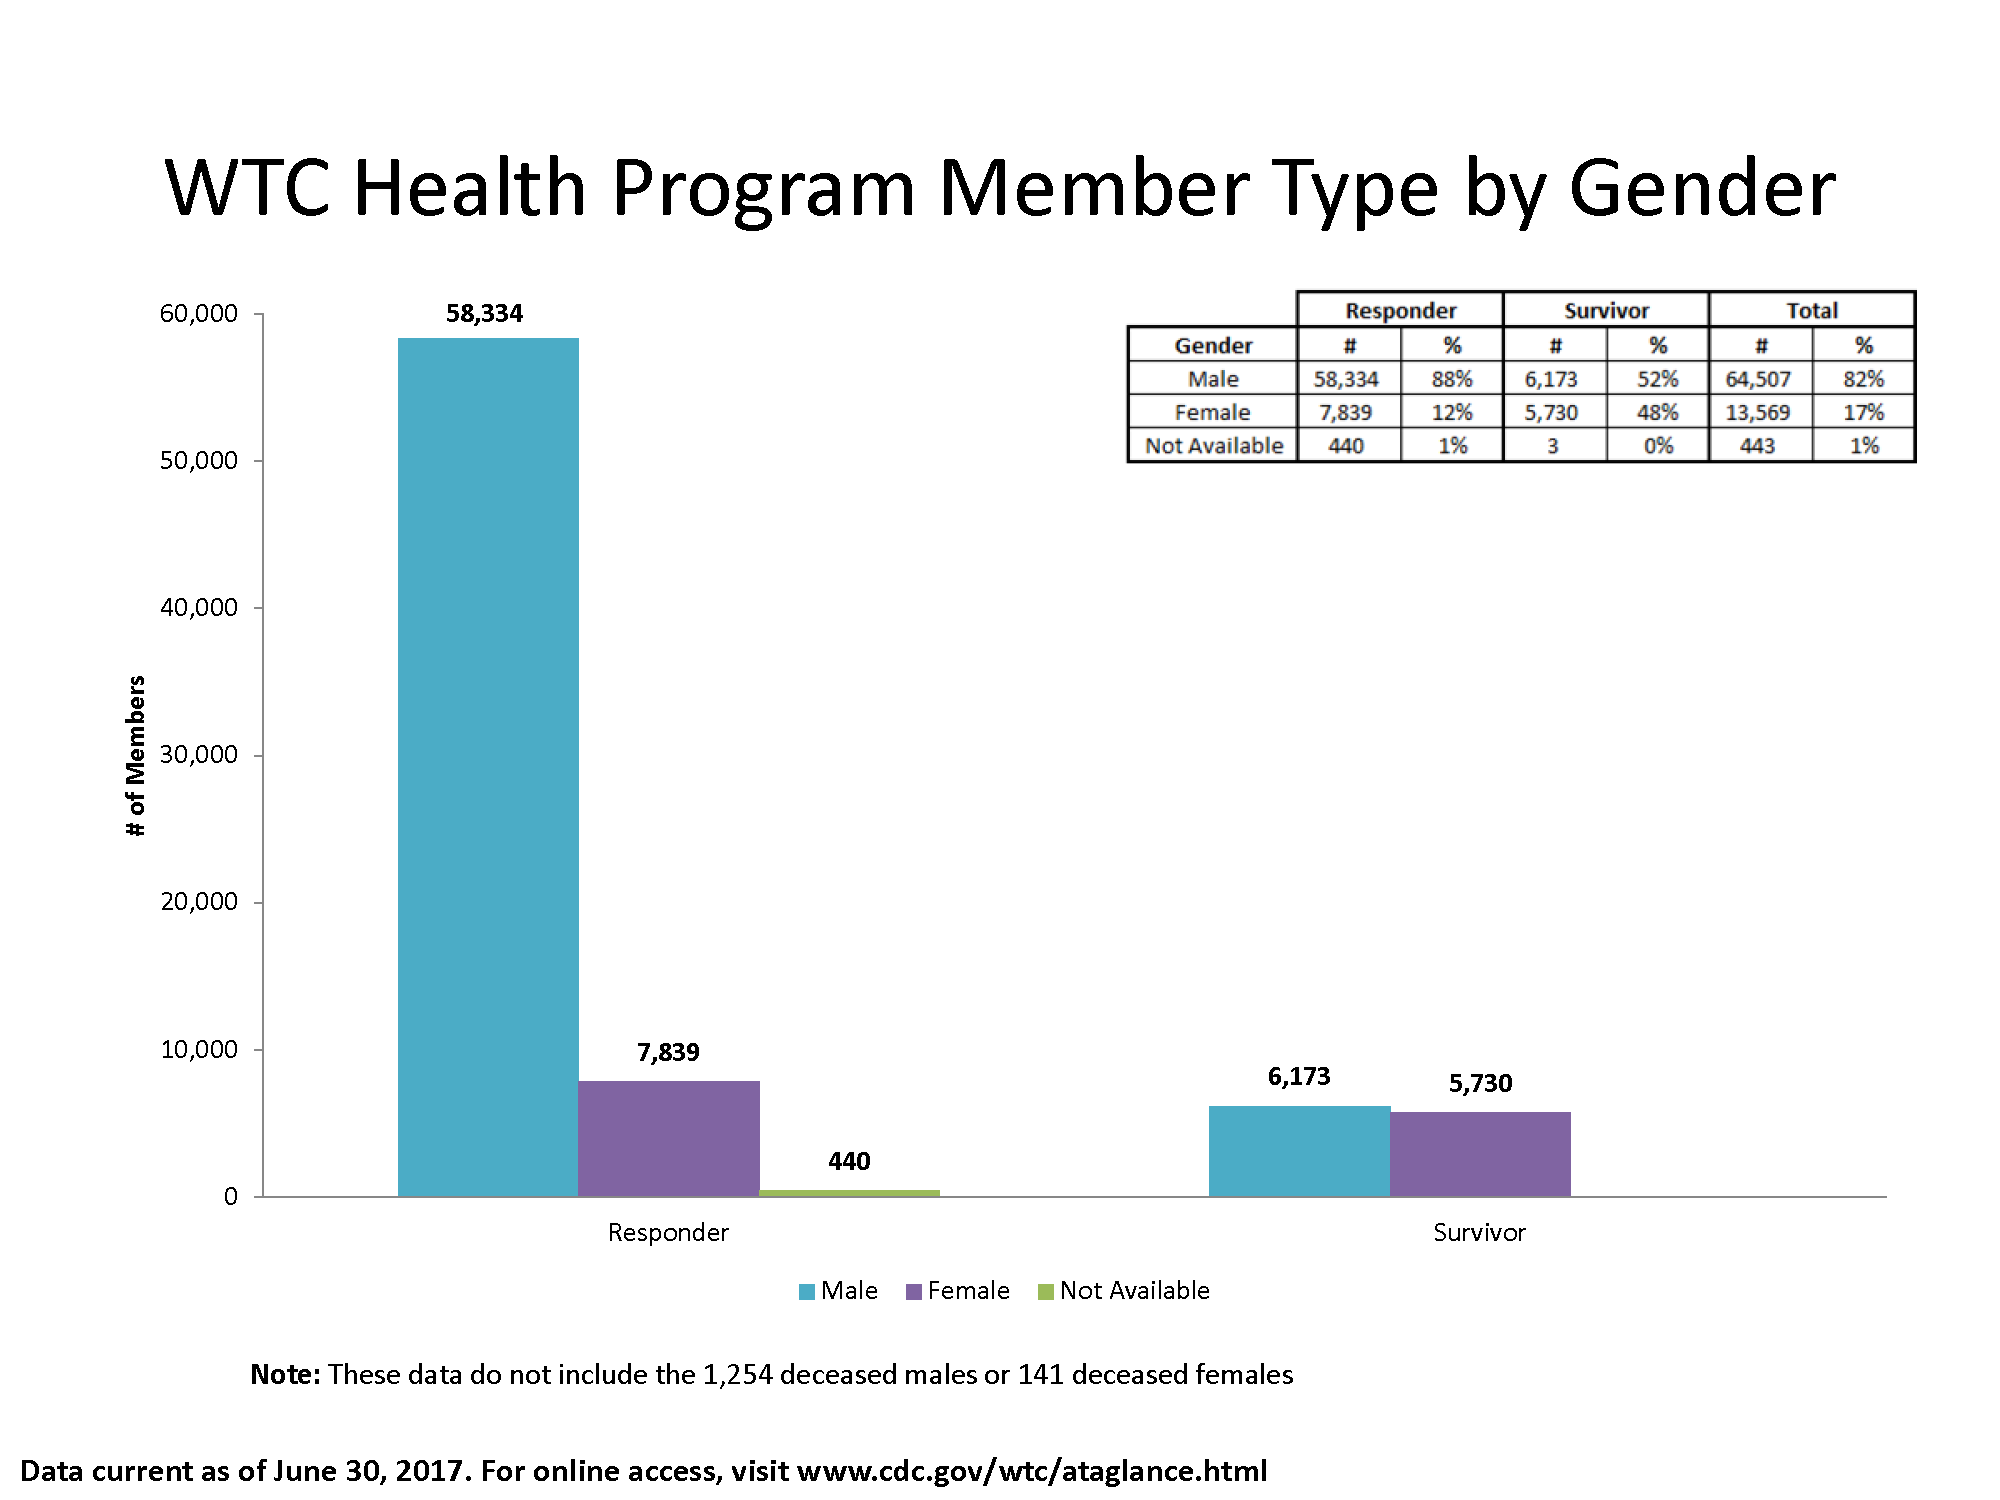
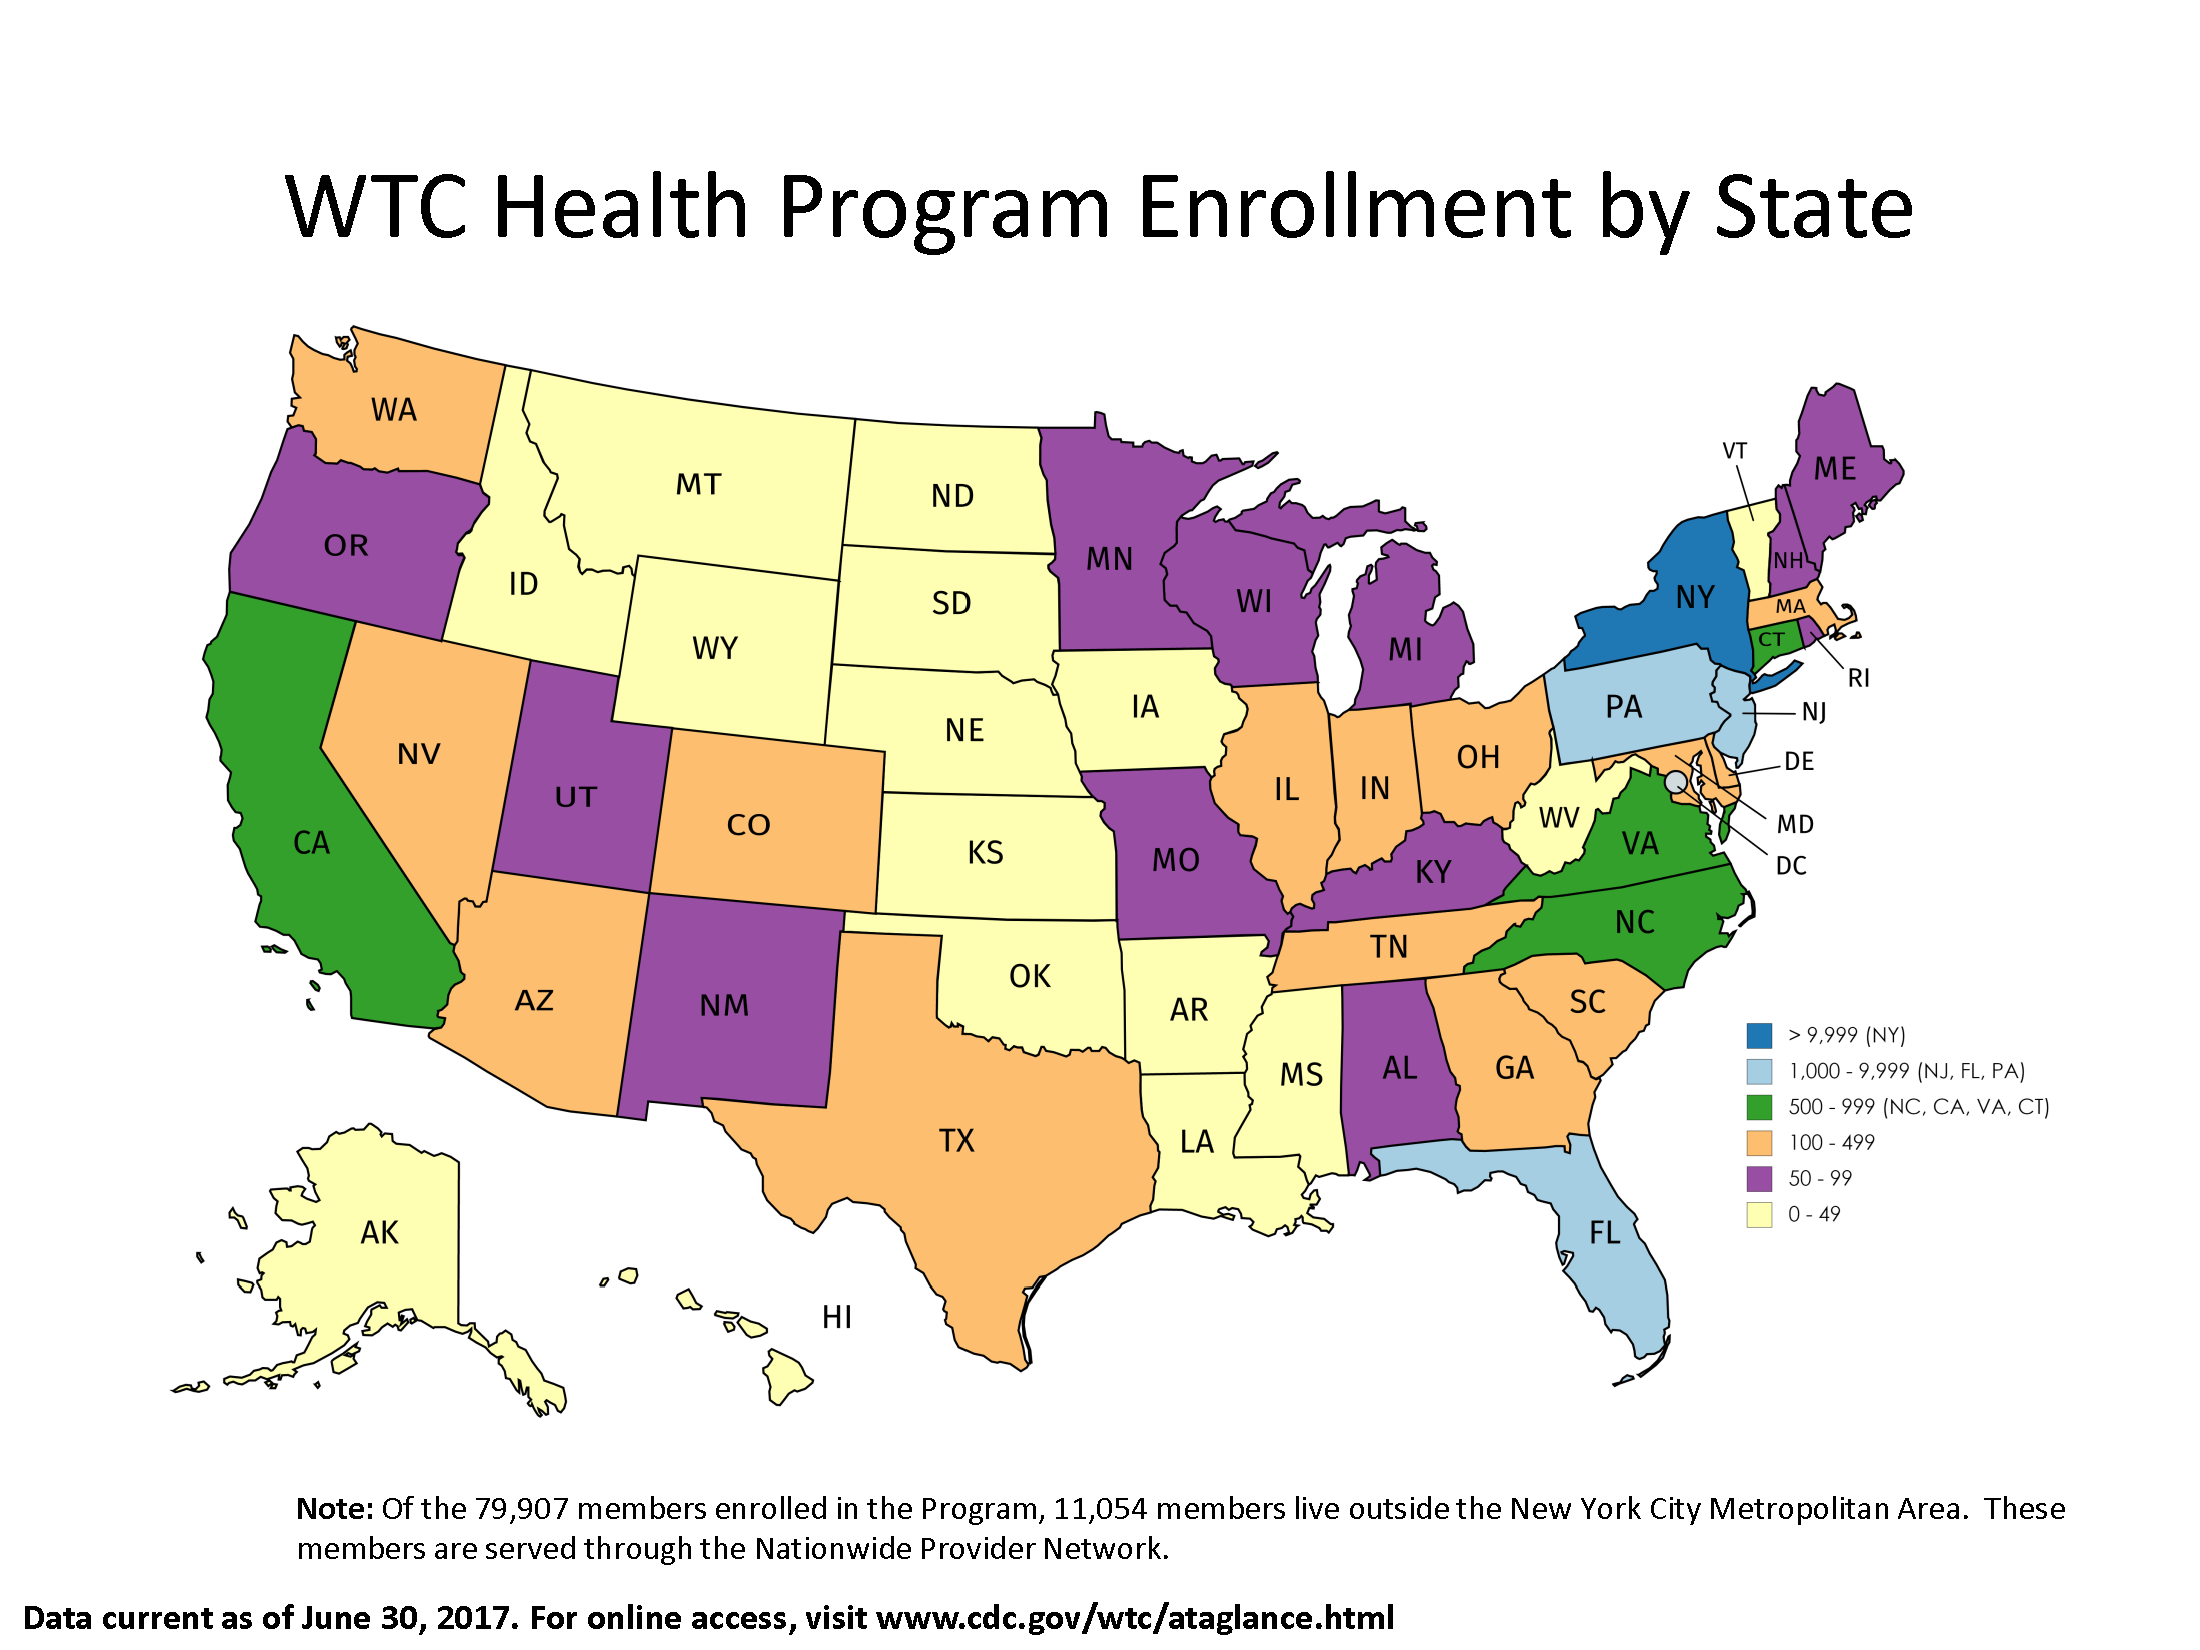
Enrollment in the WTC Health Program
![Line graph of data in table below showing enrollment in the World Trade Center Health Program by Responder and Survivor from July 2011 through June 2017.](images/paagSlides/20170815/OverallEnrollmentRespondersSurvivors.png)
![Line graph of data in table showing newly enrolled members by month from April 2015 through June 2017.](images/paagSlides/20170815/NewEnrolleesPast24Months.png)
![Line graph of newly enrolled members by month from July 2016 through June 2017 as follows:
July 2016: 135 Responders and 65 Survivors
August 2016: 175 Responders and 98 Survivors
September 2016: 156 Responders and 123 Survivors
October 2016: 199 Responders and 199 Survivors
November 2016: 355 Responders and 214 Survivors
December 2016: 167 Responders and 141 Survivors
January 2017: 225 Responders and 204 Survivors
February 2017: 219 Responders and 182 Survivors
March 2017: 267 Responders and 192 Survivors
April 2017: 368 Responders and 260 Survivors
May 2017: 263 Responders and 321 Survivors
June 2017: 183 Responders and 216 Survivors](images/paagSlides/20170815/NewEnrolleesPast12Months.png)
![Bar chart of data in table showing enrollment by member type.](images/paagSlides/20170815/EnrollmentMemberType.png)
![Bar chart of data in table showing the age distribution of members.](images/paagSlides/20170815/MemberAgeDistribution.png)
![Bar chart of data in table showing the gender of members.](images/paagSlides/20170815/MemberTypeGender.png)
![Map of the United States showing enrollment by state.
Between 0 and 49 members live in the following states:
Alaska
Arkansas
District of Columbia
Hawaii
Idaho
Iowa
Kansas
Louisiana
Mississippi
Montana
Nebraska
North Dakota
Oklahoma
South Dakota
Vermont
West Virginia
Wyoming
Between 50 and 99 members live in the following states:
Alabama
Kentucky
Maine
Michigan
Minnesota
Missouri
New Hampshire
New Mexico
Oregon
Rhode Island
Utah
Wisconsin
Between 100 and 499 members live in the following states:
Arizona
Colorado
Delaware
Illinois
Indiana
Georgia
Maryland
Massachusetts
Nevada
Ohio
South Carolina
Tennessee
Texas
Washington
Between 500 and 999 members live in the following states:
California
Connecticut
North Carolina
Virginia
Between 1000 and 5999 members live in the following states:
Florida
New Jersey
Pennsylvania
More than 5999 people live in the following states:
New York](images/paagSlides/20170815/EnrollmentState.png)
Treatment and Certified Conditions in the WTC Health Program
![Bar graph detailing living members with certifications by Zadroga Act Categories of Conditions.
As of June 30, 2017, there were 28,998 Responders and 5,189 Survivors with Aerodigestive Conditions.
There were 10,038 Responders and 3,234 Survivors with Mental Health conditions.
There were 5,807 Responders and 1,086 Survivors with Cancer conditions.
There were 475 Responders with Musculoskeletal conditions.](images/paagSlides/20170815/ZadrogaActCategories.png)
![Bar chart showing the top 10 certified conditions:
21,273 Responders and 2,693 Survivors are certified for rhinosinusitis
18,848 Responders and 2,400 Survivors are certified for GERD
10,975 Responders and 2,608 Survivors are certified for asthma
8,642 Responders and 341 Survivors are certified for sleep apnea
6,142 Responders and 1,706 Survivors are certified for PTSD
6,678 Responders and 781 Survivors are certified for respiratory disorder
5,898 Responders and 1,064 Survivors are certified for cancers
2,624 Responders and 237 Survivors are certified for depression
2,344 Responders and 475 Survivors are certified for WTC-exacerbated COPD
2,072 Responders and 511 Survivors are certified by anxiety disorder](images/paagSlides/20170815/Top10Conditions.png)
![Bar chart showing the top 15 certified cancers:
2,127 Responders and 101 Survivors have non-melanoma skin cancer
1,289 Responders and 156 Survivors have prostate cancer
463 Responders and 26 Survivors have melanoma of skin cancer
312 Responders and 87 Survivors have lymphoma
282 Responders and 104 Survivors have thyroid cancer
156 Responders and 175 Survivors have lung/bronchus cancer
243 Responders and 82 Survivors have breast cancer (female)
247 Responders and 55 Survivors have leukemia
220 Responders and 59 Survivors have colon cancer
208 Responders and 36 Survivors have kidney cancer
208 Responders and 31 Survivors have bladder cancer
94 Responders and 50 Survivors have myeloma
78 Responders and 25 Survivors have oropharynx cancer
60 Responders and <10 Survivors have cancer of the rectum
68 Responders and 11 Survivors have tonsil cancer](../wtc/images/paagSlides/20170815/Top15Cancers.png)
![Bar chart showing the number of members with different numbers of certifications:
9,718 (25.1%) members have 1 certification.
8,450 (21.8%) members have 2 certifications.
7,005 (18.1%) members have 3 certifications.
5,163 (13.3%) members have 4 certifications.
3,378 (8.7%) members have 5 certifications.
2,199 (5.7%) members have 6 certifications.
1,196 (3.1%) members have 7 certifications.
684 (1.8%) members have 8 certifications.
408 (1.1%) members have 9 certifications.
511 (1.3%) members have 10+ certifications.](images/paagSlides/20170815/MembersCertifications.png)
![Bar chart of data in the table showing the number of members with certifications by Responder and Survivor and age bracket.](images/paagSlides/20170815/MemberCertificationAgeDistribution.png)
![Bar chart of data in the table showing the number of members with aerodigestive certifications by Responder and Survivor and age bracket.](images/paagSlides/20170815/MemberAerodigestiveAgeDistribution.png)
![Bar chart of data in the table showing the number of members with mental health certifications by Responder and Survivor and age bracket.](images/paagSlides/20170815/MemberMentalHealthAgeDistribution.png)
![Bar chart of data in the table showing the number of members with cancer certifications by Responder and Survivor and age bracket.](images/paagSlides/20170815/MemberCancerAgeDistribution.png)
![Bar chart of data in the table showing the number of members with musculoskeletal certifications by Responder and Survivor and age bracket.](images/paagSlides/20170815/MemberMusculoskeletalAgeDistribution.png)
Printable Copy
(16 pages, 471 KB)
Previously Reported Information
- Printable Copy
(16 pages, 628 KB) - Data as of December 2016
(16 pages, 544 KB) - Data as of September 2016
(16 pages, 500 KB)
- Data as of June 2016
(11 pages, 714KB) - Data as of February 2015
(4 page, 169KB)
- December 20, 2014
(4 page, 729KB)