Lesson 17: Editing Charts
/en/excelxp/moving-resizing-and-deleting-charts/content/
Introduction
By the end of this lesson, you should be able to:
- Change chart data
- Change the chart title
- Change the data series names or legend names
- Change the chart type
Changing chart data
When you add a chart to your worksheet, Excel creates a link between the chart and your source data. Any changes made to the original source data are automatically reflected in the chart.
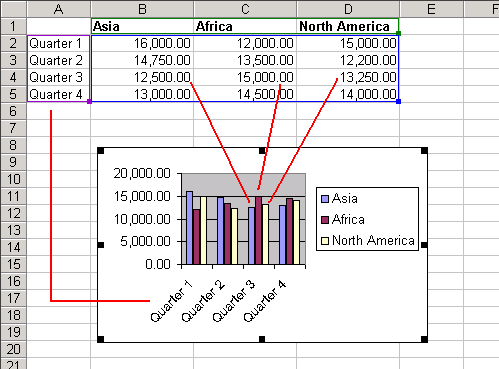
To change chart values directly in worksheet cells:
- Open the worksheet that contains the chart to be changed.
- Click in the cell whose value will change, and type the new value.
- Press Enter to accept the new value.
Changing the chart title
The chart title can be changed at any time to a name that's meaningful to you.
To change the chart title:
- Click the chart title.
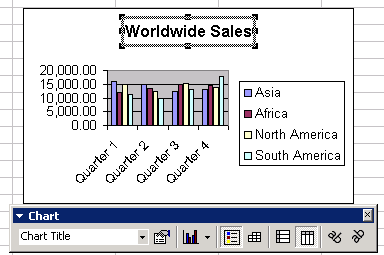
- Click anywhere in the title name and make any changes to the text.
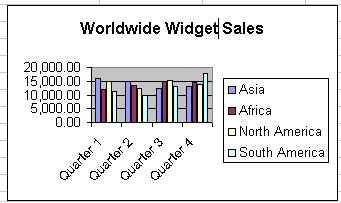
- Click anywhere outside the title to apply your changes.
Changing data series names or legend text
Data series names and legend text are changed similar to how chart values are changed in a worksheet.
To change the data series names or legend text on the worksheet:
- Click the cell that contains the data series name or legend you want to change.
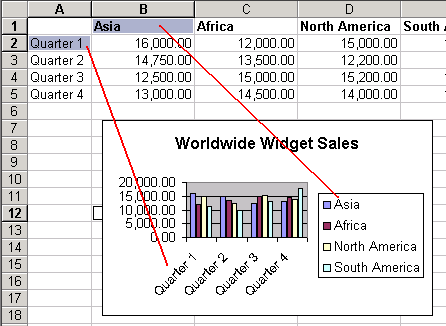
- Type the new name.
- Press Enter to add the new name to the chart.
Changing the chart type
There are 14 types of charts in Excel XP, and within each chart type there can be several variations. The chart type can be changed at any time with just a few clicks.
To select a different chart type:
- Click the chart to select it for editing.
- Click the chart type drop-down list box and select a different chart.
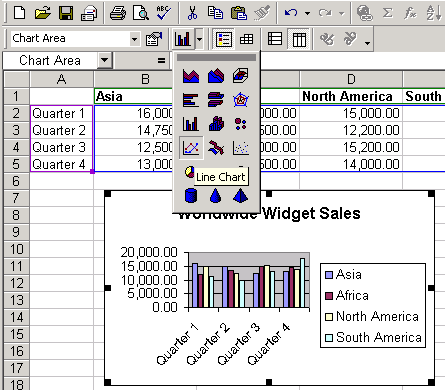
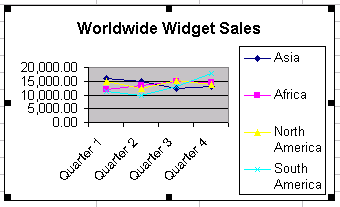
- The new chart replaces the one selected for change.
Challenge!
- Type the following information in the worksheet:
In cell A2, type Bill
In cell A3, type Bob
In cell A4, type Mary
In cell B1, type Phones
In cell B2, type 7630
In cell B3, type 2943
In cell B4, type 2301
In cell C1, type Cables
In cell C2, type 9873
In cell C3, type 3745
In cell C4, type 2019
In cell D1, type Internet
In cell D2, type 8374
In cell D3, type 2049
In cell D4, type 4038
- Create an embedded bar chart that plots Bill, Bob, and Mary on the Y axis. The legend will include phones, cables, and Internet.
- Change any of the numbers in the data source (cells B2, B3, B4, C2, C3, C4, D2, D3, and D4), and notice how the chart changes.
- Change any data series name (Bill, Bob, or Mary) or legend value (phones, cable, or Internet), and notice how the chart changes.
- Change the chart type from a bar chart to a line chart.
/en/excelxp/formatting-a-chart/content/


 Add Data from the menu bar.