1968 Western Australian state election
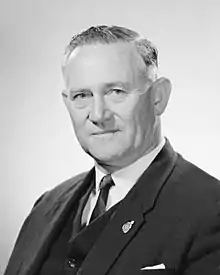
Elections were held in the state of Western Australia on 23 March 1968 to elect all 51 members to the Legislative Assembly and 15 members to the 30-seat Legislative Council. The Liberal-Country coalition government, led by Premier Sir David Brand, won a record fourth term in office against the Labor Party, led by Opposition Leader John Tonkin.
| |||||||||||||||||||||||||||||||
All 51 seats in the Western Australian Legislative Assembly and 15 (of the 30) seats to the Western Australian Legislative Council 26 Assembly seats were needed for a majority | |||||||||||||||||||||||||||||||
|---|---|---|---|---|---|---|---|---|---|---|---|---|---|---|---|---|---|---|---|---|---|---|---|---|---|---|---|---|---|---|---|
| |||||||||||||||||||||||||||||||
| |||||||||||||||||||||||||||||||
Results
Legislative Assembly
|
Western Australian state election, 23 March 1968 | ||||||
|---|---|---|---|---|---|---|
| Enrolled voters | 359,790[1] | |||||
| Votes cast | 331,325 | Turnout | 92.09% | –0.24% | ||
| Informal votes | 10,255 | Informal | 3.10% | –0.01% | ||
| Summary of votes by party | ||||||
| Party | Primary votes | % | Swing | Seats | Change | |
| Labor | 145,605 | 45.35% | +2.71% | 23 | + 2 | |
| Liberal and Country | 141,271 | 44.00% | –4.54% | 19 | – 2 | |
| Country | 16,879 | 5.25% | +0.38% | 9 | + 1 | |
| Democratic Labor | 10,456 | 3.26% | +2.32% | 0 | ± 0 | |
| Democratic | 2,216 | 0.69% | +0.69% | 0 | ± 0 | |
| Communist | 1,694 | 0.53% | +0.44% | 0 | ± 0 | |
| Independent | 2,949 | 0.92% | –1.98% | 0 | ± 0 | |
| Total | 321,070 | 51 | ||||
- 1 449,122 electors were enrolled to vote at the election, but 14 seats (27.45% of the total) were uncontested—five Liberal seats representing 32,810 enrolled voters, five Country seats representing 29,746 enrolled voters, and four Labor seats representing 26,776 enrolled voters.
Legislative Council
|
Western Australian state election, 23 March 1968 | ||||||
|---|---|---|---|---|---|---|
| Enrolled voters | 208,417[1] | |||||
| Votes cast | 192,342 | Turnout | 92.29% | +0.15% | ||
| Informal votes | 8,631 | Informal | 4.49% | +0.22% | ||
| Summary of votes by party | ||||||
| Party | Primary votes | % | Swing | Seats | Change | |
| Labor | 85,674 | 46.64% | 6 | 10 | ||
| Liberal and Country | 67,977 | 37.00% | 4 | 12 | ||
| Country | 21,228 | 11.56% | 5 | 8 | ||
| Democratic Labor | 4,502 | 2.45% | 0 | 0 | ||
| Independent | 4,330 | 2.36% | 0 | 0 | ||
| Total | 183,711 | 15 | 30 | |||
- 1 449,122 electors were enrolled to vote at the election, but 9 seats (60% of the total) were uncontested—three Liberal seats representing 99,137 enrolled voters, three Country seats representing 53,847 enrolled voters, and three Labor seats representing 86,198 enrolled voters.
Post-election pendulum
| LCL/Country seats (28) | |||
| Marginal | |||
| Subiaco | Hugh Guthrie | LCL | 0.4% |
| Kimberley | Alan Ridge | LCL | 2.2% |
| Moore | Edgar Lewis | CP | 2.3% v IND |
| Mirrabooka | Doug Cash | LCL | 2.8% |
| Merredin-Yilgarn | Jack Stewart | LCL | 2.9% |
| Murray | Ewart Runciman | LCL | 3.8% |
| Blackwood | Ron Kitney | CP | 4.6% v LCL |
| Toodyay | James Craig | CP | 4.7% |
| Bunbury | Maurice Williams | LCL | 5.7% |
| Fairly safe | |||
| Roe | Bill Young | CP | 9.7% v LCL |
| Safe | |||
| Cottesloe | Ross Hutchinson | LCL | 10.0% |
| Mount Lawley | Ray O'Connor | LCL | 10.0% |
| Floreat | Andrew Mensaros | LCL | 14.6% |
| Dale | Cyril Rushton | LCL | 15.4% |
| Darling Range | Ken Dunn | LCL | 16.2% |
| Nedlands | Charles Court | LCL | 26.6% |
| South Perth | Bill Grayden | LCL | 28.6% v DLP |
| East Melville | Des O'Neil | LCL | 30.3% v COM |
| Avon | Harry Gayfer | CP | unopp. |
| Greenough | David Brand | LCL | unopp. |
| Katanning | Crawford Nalder | CP | unopp. |
| Mount Marshall | Ray McPharlin | CP | unopp. |
| Murchison-Eyre | Richard Burt | LCL | unopp. |
| Narrogin | William Manning | CP | unopp. |
| Stirling | Clayton Mitchell | CP | unopp. |
| Vasse | Stewart Bovell | LCL | unopp. |
| Wellington | Iven Manning | LCL | unopp. |
| Wembley | Guy Henn | LCL | unopp. |
| Labor seats (23) | |||
| Marginal | |||
| Canning | Tom Bateman | ALP | 0.5% |
| Clontarf | Donald May | ALP | 2.2% |
| Maylands | John Harman | ALP | 3.0% |
| Northam | Ken McIver | ALP | 3.6% |
| Mount Hawthorn | Ron Bertram | ALP | 4.2% |
| Karrinyup | Stan Lapham | ALP | 4.3% |
| Albany | Jack Hall | ALP | 5.4% |
| Fairly safe | |||
| Geraldton | Bill Sewell | ALP | 6.2% |
| Perth | Terry Burke | ALP | 6.2% |
| Collie | Tom Jones | ALP | 6.6% |
| Warren | David Evans | ALP | 8.8% |
| Safe | |||
| Ascot | Merv Toms | ALP | 13.2% |
| Balcatta | Herb Graham | ALP | 13.4% |
| Gascoyne | Daniel Norton | ALP | 14.1% |
| Belmont | Colin Jamieson | ALP | 14.5% |
| Melville | John Tonkin | ALP | 17.5% |
| Cockburn | Don Taylor | ALP | 18.6% |
| Swan | Bill Haigh | ALP | 21.0% |
| Fremantle | Harry Fletcher | ALP | 23.5% v DLP |
| Boulder-Dundas | Arthur Moir | ALP | unopp. |
| Kalgoorlie | Tom Evans | ALP | unopp. |
| Pilbara | Arthur Bickerton | ALP | unopp. |
| Victoria Park | Ron Davies | ALP | unopp. |
See also
References
This article is issued from Wikipedia. The text is licensed under Creative Commons - Attribution - Sharealike. Additional terms may apply for the media files.

