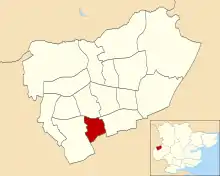
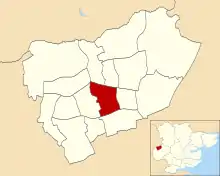
1982 Harlow District Council election
The 1982 Harlow District Council election took place on 6 May 1982 to elect members of Harlow District Council in Essex, England. This was on the same day as other local elections. The Labour Party retained control of the council.
| |||||||||||||||||||||||||||||||||
14 of the 42 seats to Harlow District Council 23 seats needed for a majority | |||||||||||||||||||||||||||||||||
|---|---|---|---|---|---|---|---|---|---|---|---|---|---|---|---|---|---|---|---|---|---|---|---|---|---|---|---|---|---|---|---|---|---|
| |||||||||||||||||||||||||||||||||
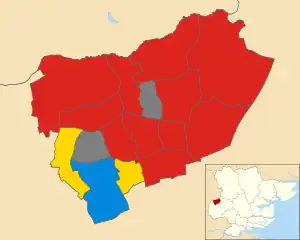 Map showing the results of contested wards in the 1982 Harlow District Council elections. | |||||||||||||||||||||||||||||||||
| |||||||||||||||||||||||||||||||||
Election result
| Party | Seats | Gains | Losses | Net gain/loss | Seats % | Votes % | Votes | +/− | |
|---|---|---|---|---|---|---|---|---|---|
| Labour | 11 | 1 | 1 | 78.6 | 50.3 | 11,274 | |||
| Alliance | 2 | 1 | 0 | 14.3 | 37.0 | 8,299 | |||
| Conservative | 1 | 1 | 2 | 7.1 | 12.5 | 2,800 | |||
| Independent Liberal | 0 | 0 | 0 | 0.0 | 0.2 | 52 | New | ||
All comparisons in vote share are to the corresponding 1978 election.
Ward results
Brays Grove

Location of Brays Grove ward
| Party | Candidate | Votes | % | |
|---|---|---|---|---|
| Labour | D. Howard | 793 | 55.7% | |
| Conservative | H. Willcox | 630 | 44.3% | |
| Turnout | 41.8% | |||
| Labour hold | ||||
Hare Street and Town Centre

Location of Hare Street and Town Centre ward
| Party | Candidate | Votes | % | |
|---|---|---|---|---|
| Labour | J. Cramp | 764 | 56.2% | |
| Alliance | C. Merryweather | 596 | 43.8% | |
| Turnout | 43.9% | |||
| Labour hold | ||||
Katherines With Sumner

Location of Katherines with Sumner ward
| Party | Candidate | Votes | % | |
|---|---|---|---|---|
| Alliance | P. Davis | 943 | 49.7% | |
| Labour | A. Evans | 672 | 35.4% | |
| Conservative | M. Tombs | 284 | 15.0% | |
| Turnout | 44.8% | |||
| Alliance gain from Conservative | ||||
Kingsmoor
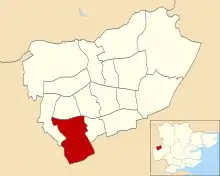
Location of Kingsmoor ward
| Party | Candidate | Votes | % | |
|---|---|---|---|---|
| Conservative | L. Atkins | 840 | 43.0% | |
| Labour | R. Rowland | 709 | 36.3% | |
| Alliance | D. Harris | 404 | 20.7% | |
| Turnout | 41.4% | |||
| Conservative gain from Labour | ||||
Latton Bush

Location of Latton Bush ward
| Party | Candidate | Votes | % | |
|---|---|---|---|---|
| Labour | S. Edwards | 953 | 50.7% | |
| Conservative | K. Clarke | 506 | 26.9% | |
| Alliance | T. McArdle | 421 | 22.4% | |
| Turnout | 43.8% | |||
| Labour hold | ||||
Little Parndon

Location of Little Parndon ward
| Party | Candidate | Votes | % | |
|---|---|---|---|---|
| Labour | M. Carter | 1,025 | 58.9% | |
| Alliance | R. Baskett | 715 | 41.1% | |
| Turnout | 40.5% | |||
| Labour hold | ||||
Mark Hall North

Location of Mark Hall North ward
| Party | Candidate | Votes | % | |
|---|---|---|---|---|
| Labour | E. Morris | 545 | 44.3% | |
| Conservative | N. Armitage | 414 | 33.7% | |
| Alliance | P. Moulds | 271 | 22.0% | |
| Turnout | 51.4% | |||
| Labour hold | ||||
Mark Hall South

Location of Mark Hall South ward
| Party | Candidate | Votes | % | |
|---|---|---|---|---|
| Labour | S. Anderson | 961 | 58.2% | |
| Conservative | G. Dabnor | 403 | 24.4% | |
| Alliance | S. Tucker | 286 | 17.3% | |
| Turnout | 40.7% | |||
| Labour hold | ||||
Netteswell West

Location of Netteswell West ward
| Party | Candidate | Votes | % | |
|---|---|---|---|---|
| Labour | M. Gerrard | 537 | 54.5% | |
| Alliance | R. Freeman | 312 | 31.6% | |
| Conservative | F. Burgoyne | 137 | 13.9% | |
| Turnout | 39.7% | |||
| Labour hold | ||||
Old Harlow

Location of Old Harlow ward
| Party | Candidate | Votes | % | |
|---|---|---|---|---|
| Labour | S. Firth | 1,060 | 49.4% | |
| Conservative | S. Rigden | 561 | 26.2% | |
| Alliance | R. Winkie | 472 | 22.0% | |
| Independent Liberal | S. Ward | 52 | 2.4% | |
| Turnout | 47.1% | |||
| Labour gain from Conservative | ||||
Passmores

Location of Passmores ward
| Party | Candidate | Votes | % | |
|---|---|---|---|---|
| Labour | M. Collyer | 825 | 51.3% | |
| Alliance | D. Filler | 782 | 48.7% | |
| Turnout | 38.1% | |||
| Labour hold | ||||
Potter Street
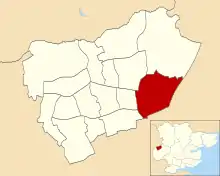
Location of Potter Street ward
| Party | Candidate | Votes | % | |
|---|---|---|---|---|
| Labour | R. Bruce | 900 | 66.0% | |
| Alliance | P. Murray | 464 | 34.0% | |
| Turnout | 41.5% | |||
| Labour hold | ||||
References
- "Council compositions by year". The Elections Centre.
- "Local Election Summaries 1982". The Elections Centre.
- "Harlow District Council Election Results 1976-2012" (PDF). Elections Centre. Retrieved 27 September 2019.
This article is issued from Wikipedia. The text is licensed under Creative Commons - Attribution - Sharealike. Additional terms may apply for the media files.
