1990 Ontario general election
The 1990 Ontario general election was held on September 6, 1990, to elect members of the 35th Legislative Assembly of the province of Ontario, Canada. The governing Ontario Liberal Party led by Premier David Peterson was unexpectedly defeated. Although the Peterson government, and Peterson himself, were very popular,[2] he was accused of opportunism in calling an election just three years into his mandate. In a shocking upset, the New Democratic Party (NDP), led by Bob Rae, won a majority government. This marked the first time the NDP had won government east of Manitoba, and to date the only time the NDP formed the government in Ontario.
| |||||||||||||||||||||||||||||||||||||||||||||
130 seats in the 35th Legislative Assembly of Ontario 66 seats needed for a majority | |||||||||||||||||||||||||||||||||||||||||||||
|---|---|---|---|---|---|---|---|---|---|---|---|---|---|---|---|---|---|---|---|---|---|---|---|---|---|---|---|---|---|---|---|---|---|---|---|---|---|---|---|---|---|---|---|---|---|
| Turnout | 64.45%[1] | ||||||||||||||||||||||||||||||||||||||||||||
| |||||||||||||||||||||||||||||||||||||||||||||
 Popular vote by riding. As this is an FPTP election, seat totals are not determined by popular vote, but instead via results by each riding. Click the map for more details. | |||||||||||||||||||||||||||||||||||||||||||||
| |||||||||||||||||||||||||||||||||||||||||||||
.jpg.webp)
Not even the NDP expected to come close to winning power. Rae had already made plans to retire from politics after the election; however, the NDP managed to take many seats in the Greater Toronto Area (GTA) from the Liberals, and Rae himself represented York South, in Metro Toronto. They also did better than ever before, or in some cases since, in many other cities and rural areas. The NDP finished only five points ahead of the Liberals in the popular vote, but due to the nature of the first-past-the-post electoral system, which ignores the popular vote and awards power based on the number of ridings won, the NDP's gains in the GTA decimated the Liberal caucus. The Liberals lost 59 seats, the second-worst defeat for a governing party in Ontario. At the time, it was the Liberals' worst showing in an Ontario election. Peterson himself was heavily defeated in London Centre by NDP challenger Marion Boyd, losing by 8,200 votes, one of the few times a provincial premier has lost their own seat.
Although Mike Harris' Progressive Conservative Party was unable to overcome voter distrust of the federal Progressive Conservative government of Brian Mulroney, his party managed to make a net gain of four seats. Although Harris was from northern Ontario, the Tories were particularly weak in that region, placing fourth, behind the Liberals, NDP, and the right-wing Confederation of Regions Party (CoR) in six northern Ontario ridings (Algoma, Cochrane South, Nickel Belt, Sudbury, Sudbury East, and Sault Ste. Marie). The CoR also placed ahead of the Progressive Conservatives in the Renfrew North and Cornwall ridings in eastern Ontario. Although they received only 1.9% of the vote provincewide, they managed 7.8% in the 33 ridings in which they actually fielded a candidate.
The Green Party of Ontario placed third, ahead of the NDP, in Parry Sound riding, where former Liberal leadership candidate Richard Thomas was the party's candidate.
Opinion polls
| Polling firm | Last day of survey |
Source | ONDP | OLP | PCO | Other | ME | Sample | |
|---|---|---|---|---|---|---|---|---|---|
| Election 1990 | September 6, 1990 | 37.6 | 32.4 | 23.5 | 6.5 | ||||
| Angus Reid-Southam | August 30, 1990 | [3] | 38 | 34 | 24 | 4 | 3.3 | 804 | |
| Environics | August 21, 1990 | [4] | 34 | 40 | 23 | — | 3.1 | 1,008 | |
| Leader's debate held (August 20, 1990)[5] | |||||||||
| Decima | August 13, 1990 | [6] | 30 | 40 | 28 | — | — | — | |
| Election called (July 30, 1990)[7] | |||||||||
During the 34th Parliament of Ontario
| Polling firm | Last day of survey |
Source | ONDP | OLP | PCO | Other | ME | Sample |
|---|---|---|---|---|---|---|---|---|
| Gallup | July 1990 | [8] | 24 | 43 | 26 | — | — | — |
| Environics | July 8, 1990 | [9] | 26 | 50 | 22 | — | 3.2 | 1,000 |
| Environics | April 1990 | [10] | 28 | 47 | 23 | — | — | — |
| Environics | December 1989 | [11] | 26 | 42 | 30 | — | 3.2 | — |
| Environics | September 1989 | [11] | 26 | 45 | 28 | — | 3.2 | — |
| Environics | July 6, 1989 | [12] | 25 | 45 | 29 | — | 3.2 | 1,012 |
| Environics | December 13, 1988 | [13] | 21 | 43 | 34 | — | — | 1,025 |
| Angus Reid | October 1988 | [14] | 20 | 53 | 25 | — | — | — |
| Environics | May 1988 | [15] | 25 | 45 | 28 | 1 | 3.2 | 1,003 |
| Environics | May 1988 | [16] | 25 | 45 | 28 | 1 | 3.2 | 1,003 |
| Gallup | May 14, 1988 | [17] | 25 | 50 | 24 | — | 5 | 571 |
| Environics | February 1988 | [18] | 24 | 54 | 21 | — | 3.2 | 1,003 |
| Environics | November 22, 1987 | [19] | 24 | 52 | 23 | — | 3.2 | 1,008 |
| Election 1987 | September 10, 1987 | 25.7 | 47.3 | 23.5 | 3.5 |
Results
| Political party | Party leader | MPPs | Votes | |||||||
|---|---|---|---|---|---|---|---|---|---|---|
| Candidates | 1987 | Dissol. | 1990 | ± | # | % | ± (pp) | |||
| New Democratic | Bob Rae | 130 | 19 | 19 | 74 | 55 |
1,509,506 | 37.6% | 11.9 | |
| Liberal | David Peterson | 130 | 95 | 93 | 36 | 59 |
1,302,134 | 32.4% | 14.9 | |
| Progressive Conservative | Mike Harris | 130 | 16 | 17 | 20 | 4 |
944,564 | 23.5% | 1.2 | |
| Family Coalition | Donald Pennell | 68 | – | – | – | – | 110,831 | 2.8% | 1.5 | |
| Confederation of Regions | Dean Wasson | 33 | – | – | – | – | 75,873 | 1.9% | New | |
| Green | Katherine Mathewson | 40 | – | – | – | – | 30,097 | 0.8% | 0.7 | |
| Libertarian | James Stock | 45 | – | – | – | – | 24,613 | 0.6% | 0.2 | |
| Freedom | Robert Metz | 10 | – | – | – | – | 6,015 | 0.1% | ||
| Communist | Elizabeth Rowley | 4 | – | – | – | – | 1,139 | – | 0.1 | |
| Independent | 15 | – | – | – | – | 13,307 | 0.3% | |||
| Vacant | 1 | |||||||||
| Total | 615 | 130 | 130 | 130 | 4,018,079 | 100.00% | ||||
| Blank and invalid ballots | 52,575 | |||||||||
| Total ballots cast | 4,070,654 | |||||||||
| Registered voters / turnout | 6,315,949 | 64.5% | 1.8 | |||||||
Synopsis of results
| Riding | Winning party | Turnout [a 1][a 2] |
Votes[a 3] | ||||||||||||
|---|---|---|---|---|---|---|---|---|---|---|---|---|---|---|---|
| 1987 → 1990 | Votes | Share | Margin # |
Margin % |
NDP | Lib | PC | FCP | CoR | Ind | Other | Total | |||
| Algoma | NDP | 8,221 | 58.65% | 4,648 | 33.16% | 65.62% | 8,221 | 3,573 | 433 | – | 1,790 | – | – | 14,017 | |
| Algoma—Manitoulin | Lib | 5,961 | 38.86% | 207 | 1.35% | 61.25% | 5,754 | 5,961 | 2,163 | – | 1,114 | 347 | – | 15,339 | |
| Beaches—Woodbine | NDP | 14,381 | 58.35% | 8,052 | 32.67% | 65.95% | 14,381 | 6,329 | 3,535 | – | – | 400 | – | 24,645 | |
| Brampton North | Lib | 12,918 | 32.31% | 98 | 0.29% | 58.35% | 11,588 | 11,686 | 7,619 | 1,466 | – | 434 | 669 | 33,462 | |
| Brampton South | Lib | 12,918 | 32.31% | 424 | 1.06% | 59.36% | 12,494 | 12,918 | 11,395 | 2,511 | – | – | 667 | 39,985 | |
| Brant—Haldimand | Lib | 10,751 | 37.35% | 1,469 | 5.10% | 61.18% | 9,282 | 10,751 | 6,228 | 1,520 | – | – | 1,004 | 28,785 | |
| Brantford | → | NDP | 17,736 | 48.63% | 4,092 | 11.22% | 66.71% | 17,736 | 13,644 | 3,087 | 1,413 | – | – | 594 | 36,474 |
| Bruce | Lib | 11,476 | 37.71% | 3,511 | 11.54% | 68.92% | 7,965 | 11,476 | 7,349 | 3,639 | – | – | – | 30,429 | |
| Burlington South | PC | 17,084 | 52.536% | 8,899 | 27.36% | 69.48% | 8,185 | 5,544 | 17,084 | 1,707 | – | – | – | 32,520 | |
| Cambridge | NDP | 21,806 | 60.28% | 14,249 | 39.39% | 64.84% | 21,806 | 7,557 | 4,449 | 2,364 | – | – | – | 36,176 | |
| Carleton | PC | 17,860 | 46.91% | 7,717 | 20.27% | 65.15% | 10,071 | 10,143 | 17,860 | – | – | – | – | 38,074 | |
| Carleton East | Lib | 19,059 | 53.88% | 9,083 | 25.68% | 63.52% | 9,976 | 19,059 | 5,117 | 1,224 | – | – | – | 35,376 | |
| Chatham—Kent | → | NDP | 13,930 | 44.74% | 3,967 | 12.74% | 63.01% | 13,930 | 9,963 | 5,619 | 1,626 | – | – | – | 31,138 |
| Cochrane North | → | NDP | 6,618 | 40.47% | 143 | 0.87% | 62.16% | 6,618 | 6,475 | 3,261 | – | – | – | – | 16,354 |
| Cochrane South | → | NDP | 11,460 | 47.61% | 2,099 | 8.72% | 62.95% | 11,460 | 9,361 | 1,019 | – | 2,229 | – | – | 24,069 |
| Cornwall | Lib | 12,725 | 46.53% | 5,681 | 20.77% | 63.79% | 7,044 | 12,725 | 3,169 | – | 4,409 | – | – | 27,347 | |
| Don Mills | → | NDP | 9,740 | 34.20% | 954 | 3.35% | 64.23% | 9,740 | 8,786 | 7,631 | – | – | 562 | 1,784 | 28,483 |
| Dovercourt | → | NDP | 10,604 | 54.25% | 3,989 | 20.41% | 66.27% | 10,604 | 6,615 | 1,239 | – | – | – | 1,090 | 19,548 |
| Downsview | → | NDP | 13,440 | 56.58% | 5,221 | 21.98% | 66.08% | 13,440 | 8,219 | 1,477 | – | – | – | 619 | 23,755 |
| Dufferin—Peel | → | PC | 10,899 | 34.66% | 572 | 1.82% | 66.56% | 8,627 | 10,327 | 10,899 | – | – | – | 1,594 | 31,447 |
| Durham Centre | → | NDP | 12,594 | 35.88% | 2,348 | 6.69% | 61.23% | 12,594 | 10,246 | 9,126 | 1,186 | 1,087 | – | 857 | 35,096 |
| Durham East | → | NDP | 10,960 | 32.74% | 53 | 0.16% | 63.43% | 10,960 | 7,836 | 10,907 | 2,487 | 1,286 | – | – | 33,476 |
| Durham West | → | NDP | 16,366 | 37.47% | 1,982 | 4.54% | 62.36% | 16,366 | 14,384 | 11,167 | 1,761 | – | – | – | 43,678 |
| Durham—York | → | NDP | 12,297 | 33.89% | 1,230 | 3.39% | 61.90% | 12,297 | 11,067 | 10,904 | 2,016 | – | – | – | 36,284 |
| Eglinton | Lib | 12,032 | 35.97% | 173 | 0.52% | 69.98% | 7,772 | 12,032 | 11,859 | – | – | – | 1,788 | 33,451 | |
| Elgin | → | NDP | 14,189 | 41.67% | 4,466 | 13.12% | 66.51% | 14,189 | 9,723 | 9,031 | – | – | – | 1,104 | 34,047 |
| Essex South | Lib | 10,575 | 36.02% | 212 | 0.72% | 59.40% | 10,363 | 10,575 | 6,335 | 2,085 | – | – | – | 29,358 | |
| Essex—Kent | → | NDP | 15,858 | 52.66% | 5,890 | 19.56% | 67.52% | 15,858 | 9,968 | 2,739 | 1,551 | – | – | – | 30,116 |
| Etobicoke West | → | PC | 13,713 | 40.56% | 3,631 | 10.74% | 69.86% | 7,992 | 10,082 | 13,713 | 1,045 | – | 304 | 674 | 33,810 |
| Etobicoke—Humber | Lib | 13,582 | 38.61% | 3,533 | 10.04% | 70.29% | 10,049 | 13,582 | 9,289 | 1,292 | – | – | 966 | 35,178 | |
| Etobicoke—Lakeshore | NDP | 18,118 | 57.23% | 11,112 | 35.10% | 66.15% | 18,118 | 7,006 | 4,854 | 1,053 | – | – | 629 | 31,660 | |
| Etobicoke—Rexdale | NDP | 17,620 | 67.07% | 13,035 | 49.62% | 61.42% | 17,620 | 4,585 | 3,243 | – | – | – | 822 | 26,270 | |
| Fort William | Lib | 11,798 | 44.44% | 1,345 | 5.07% | 62.74% | 10,453 | 11,798 | 4,300 | – | – | – | – | 26,551 | |
| Fort York | → | NDP | 11,023 | 46.30% | 1,367 | 5.74% | 63.48% | 11,023 | 9,656 | 2,258 | – | – | 330 | 539 | 23,806 |
| Frontenac—Addington | → | NDP | 9,696 | 33.24% | 1,470 | 5.04% | 65.15% | 9,696 | 8,226 | 8,211 | 2,020 | – | 1,021 | – | 29,174 |
| Grey—Owen Sound | → | PC | 13,742 | 36.11% | 2,462 | 6.47% | 65.20% | 11,280 | 10,257 | 13,742 | 2,157 | – | – | 620 | 38,056 |
| Guelph | → | NDP | 15,051 | 37.91% | 3,107 | 7.83% | 69.48% | 15,051 | 11,944 | 10,184 | 1,602 | – | – | 920 | 39,701 |
| Halton Centre | Lib | 13,494 | 35.03% | 1,215 | 3.15% | 63.12% | 10,163 | 13,494 | 12,279 | 1,232 | – | – | 1,355 | 38,523 | |
| Halton North | → | NDP | 8,510 | 30.94% | 548 | 1.99% | 64.50% | 8,510 | 7,962 | 7,499 | 2,489 | – | – | 1,043 | 27,503 |
| Hamilton Centre | → | NDP | 14,029 | 55.32% | 6,215 | 24.51% | 59.78% | 14,029 | 7,814 | 2,116 | 365 | – | – | 1,034 | 25,358 |
| Hamilton East | NDP | 20,289 | 71.60% | 14,764 | 52.10% | 61.70% | 20,289 | 5,525 | 1,676 | 846 | – | – | – | 28,336 | |
| Hamilton Mountain | NDP | 22,488 | 59.76% | 14,779 | 39.28% | 66.55% | 22,488 | 7,432 | 7,709 | – | – | – | – | 37,629 | |
| Hamilton West | NDP | 18,550 | 56.59% | 11,314 | 34.52% | 67.90% | 18,550 | 7,236 | 4,361 | 2,324 | – | – | 306 | 32,777 | |
| Hastings—Peterborough | → | NDP | 11,283 | 39.89% | 896 | 3.17% | 68.76% | 11,283 | 4,285 | 10,387 | 1,199 | 1,128 | – | – | 28,282 |
| High Park—Swansea | → | NDP | 11,432 | 45.12% | 3,273 | 12.92% | 64.83% | 11,432 | 8,159 | 4,674 | 409 | – | – | 663 | 25,337 |
| Huron | → | NDP | 10,020 | 34.47% | 954 | 3.28% | 71.47% | 10,020 | 6,653 | 9,066 | 2,931 | – | – | 400 | 29,070 |
| Kenora | Lib | 8,152 | 40.55% | 331 | 1.65% | 61.67% | 7,821 | 8,152 | 1,776 | – | – | 2,357 | – | 20,106 | |
| Kingston and the Islands | → | NDP | 10,184 | 37.99% | 2,092 | 7.80% | 56.10% | 10,184 | 8,092 | 7,079 | 1,452 | – | – | – | 26,807 |
| Kitchener | → | NDP | 15,750 | 46.82% | 6,019 | 17.89% | 62.90% | 15,750 | 9,731 | 6,157 | 2,002 | – | – | – | 33,640 |
| Kitchener—Wilmot | → | NDP | 16,056 | 43.94% | 5,187 | 14.20% | 60.09% | 16,056 | 10,869 | 7,342 | 2,270 | – | – | – | 36,537 |
| Lake Nipigon | NDP | 8,335 | 65.19% | 5,252 | 41.08% | 59.98% | 8,335 | 3,083 | 735 | 632 | – | – | – | 12,785 | |
| Lambton | → | NDP | 8,691 | 31.40% | 1,026 | 3.71% | 68.17% | 8,691 | 7,291 | 7,665 | 3,557 | – | – | 842 | 27,675 |
| Lanark—Renfrew | PC | 11,063 | 32.48% | 1,398 | 4.10% | 60.37% | 8,541 | 9,665 | 11,063 | 1,853 | 2,938 | – | – | 34,060 | |
| Lawrence | Lib | 11,786 | 44.70% | 1,607 | 6.10% | 65.68% | 10,179 | 11,786 | 3,557 | – | – | – | 842 | 26,364 | |
| Leeds—Grenville | PC | % | 7,674 | 22.35% | 66.18% | – | – | 34,330 | |||||||
| Lincoln | → | NDP | 16,846 | 49.07% | 1,062 | 3.11% | 68.07% | 8,312 | 9,172 | 16,846 | – | – | – | – | 34,141 |
| London Centre | → | NDP | 17,837 | 51.31% | 8,166 | 23.49% | 66.05% | 17,837 | 9,671 | 5,348 | 982 | – | 345 | 582 | 34,765 |
| London North | → | PC | 18,079 | 41.30% | 4,074 | 9.31% | 67.80% | 14,005 | 9,990 | 18,079 | 1,095 | – | – | 601 | 43,770 |
| London South | → | NDP | 17,438 | 42.41% | 5,651 | 13.74% | 65.61% | 17,438 | 11,787 | 9,828 | 1,427 | – | – | 635 | 41,115 |
| Markham | PC | 25,595 | 49.97% | 10,467 | 20.43% | 64.39% | 8,459 | 15,128 | 25,595 | 1,086 | – | 311 | 642 | 51,221 | |
| Middlesex | → | NDP | 12,522 | 32.62% | 520 | 1.35% | 68.80% | 12,522 | 12.002 | 8,957 | 4,007 | – | – | 894 | 38,382 |
| Mississauga East | Lib | 12,448 | 39.29% | 3.271 | 10.32% | 61.61% | 9,177 | 12,448 | 8,285 | – | – | 1,363 | 411 | 31,684 | |
| Mississauga North | Lib | 12,658 | 37.85% | 1,442 | 4.31% | 57.77% | 11,216 | 12,658 | 7,990 | – | – | 632 | 946 | 33,442 | |
| Mississauga South | PC | 17,126 | 52.45% | 9,547 | 29.24% | 65.68% | 7,579 | 6,624 | 17,126 | – | – | – | 1,323 | 32,652 | |
| Mississauga West | Lib | 20,038 | 42.11% | 6,100 | 12.82% | 59.59% | 13,938 | 20,038 | 11,945 | – | – | 771 | 892 | 47,584 | |
| Muskoka—Georgian Bay | → | NDP | 13,422 | 40.63% | 2,918 | 8.83% | 67.65% | 13,422 | 9,105 | 10,504 | – | – | – | – | 33,031 |
| Nepean | Lib | 13,723 | 42.45% | 3,853 | 11.92% | 62.91% | 7,453 | 13,723 | 9,870 | – | – | – | 1,282 | 32,328 | |
| Niagara Falls | → | NDP | 13,884 | 46.37% | 5,905 | 19.72% | 63.38% | 13,884 | 7,979 | 3,896 | 674 | 3,141 | – | 365 | 29,939 |
| Niagara South | → | NDP | 11,161 | 46.56% | 3,929 | 16.39% | 65.10% | 11,161 | 7,232 | 4,032 | – | 1,547 | – | – | 23,972 |
| Nickel Belt | NDP | 9,925 | 58.54% | 6,658 | 39.27% | 69.07% | 9,925 | 3,267 | 967 | – | 2,796 | – | – | 16,955 | |
| Nipissing | PC | 15,469 | 45.85% | 4,724 | 14.00% | 70.16% | 7,039 | 10,745 | 15,469 | 488 | – | – | – | 33,741 | |
| Norfolk | → | NDP | 14,850 | 41.03% | 3,879 | 10.72% | 67.95% | 14,850 | 10,971 | 10,374 | – | – | – | – | 36,195 |
| Northumberland | Lib | 11,984 | 33.53% | 1,094 | 3.06% | 66.93% | 9,581 | 11,984 | 10,890 | 1,213 | 1,677 | – | 395 | 35,740 | |
| Oakville South | → | PC | 10,949 | 34.98% | 108 | 0.35% | 66.73% | 6,423 | 10,841 | 10,949 | 996 | 1,057 | – | 1,038 | 31,304 |
| Oakwood | → | NDP | 10,423 | 48.74% | 2,280 | 10.66% | 67.69% | 10,423 | 8,143 | 1,671 | – | – | – | 1,147 | 21,384 |
| Oriole | Lib | 10,655 | 41.86% | 2,214 | 8.70% | 66.13% | 8,441 | 10,655 | 5,435 | – | – | – | 923 | 25,454 | |
| Oshawa | NDP | 16,601 | 61.09% | 11,485 | 42.27% | 51.99% | 16,601 | 5,116 | 3,871 | – | 1,585 | – | – | 27,173 | |
| Ottawa Centre | → | NDP | 14,522 | 47.70% | 2,866 | 9.41% | 67.17% | 14,522 | 11,656 | 2,723 | 809 | – | 160 | 576 | 30,446 |
| Ottawa East | Lib | 16,363 | 62.41% | 10,260 | 39.13% | 55.23% | 6,103 | 16,363 | 2,203 | 826 | – | – | 723 | 26,218 | |
| Ottawa South | Lib | 13,845 | 45.87% | 6,019 | 19.94% | 68.56% | 7,826 | 13,845 | 7,399 | 503 | – | – | 612 | 30,185 | |
| Ottawa West | Lib | 13,908 | 41.61% | 4,840 | 14.48% | 65.68% | 8,391 | 13,908 | 9,068 | – | 1,044 | – | 1,011 | 33,422 | |
| Ottawa—Rideau | Lib | 13,454 | 45.31% | 4,609 | 15.52% | 59.96% | 8,845 | 13,454 | 5,234 | 1,049 | – | 861 | 252 | 29,695 | |
| Oxford | → | NDP | 12,684 | 34.75% | 2,824 | 7.74% | 67.65% | 12,684 | 9,802 | 9,860 | 3,182 | – | – | 976 | 36,504 |
| Parkdale | Lib | 8,080 | 46.39% | 523 | 3.00% | 61.22% | 7,557 | 8,080 | 941 | – | – | 273 | 566 | 17,417 | |
| Parry Sound | PC | 10,078 | 43.78% | 4,953 | 21.52% | 65.09% | 2,993 | 5,125 | 10,078 | 763 | – | – | 4,061 | 23,020 | |
| Perth | → | NDP | 11,712 | 36.83% | 2,991 | 9.41% | 66.24% | 11,712 | 8,721 | 8,600 | 2,769 | – | – | – | 31,802 |
| Peterborough | → | NDP | 13,813 | 32.98% | 185 | 0.44% | 66.65% | 13,813 | 13,628 | 8,884 | 3,652 | 1,586 | – | 325 | 41,888 |
| Port Arthur | → | NDP | 11,919 | 42.88% | 1,034 | 3.72% | 62.22% | 11,919 | 10,885 | 3,854 | 1,140 | – | – | – | 27,798 |
| Prescott and Russell | Lib | 25,879 | 64.97% | 16,510 | 41.45% | 59.27% | 9,369 | 25,879 | 2,848 | 1,119 | – | – | 618 | 39,833 | |
| Prince Edward—Lennox—South—Hastings | → | NDP | 9,204 | 33.17% | 905 | 3.26% | 61.45% | 9,204 | 8,188 | 8,299 | – | 2,061 | – | – | 27,752 |
| Quinte | Lib | 11,114 | 37.43% | 4,104 | 13.82% | 59.41% | 7,010 | 11,114 | 5,825 | 2,331 | 3,411 | – | – | 29,691 | |
| Rainy River | NDP | 7,838 | 61.47% | 3,960 | 31.06% | 66.34% | 7,838 | 3,878 | 1,035 | – | – | – | – | 12,751 | |
| Renfrew North | Lib | 13,082 | 43.32% | 7,166 | 23.73% | 65.62% | 5,916 | 13,082 | 4,586 | 1,104 | 5,510 | – | – | 30,198 | |
| Riverdale | NDP | 14,086 | 61.97% | 8,514 | 37.46% | 62.45% | 14,086 | 5,572 | 1,578 | – | – | – | 1,493 | 22,729 | |
| St. Andrew—St. Patrick | → | NDP | 10,321 | 34.45% | 1,080 | 3.61% | 66.89% | 10,321 | 8,938 | 9,241 | – | – | – | 1,456 | 29,956 |
| St. Catharines | Lib | 11,565 | 38.76% | 936 | 3.14% | 66.77% | 10,629 | 11,565 | 3,926 | 1,331 | 2,384 | – | – | 29,835 | |
| St. Catharines—Brock | → | NDP | 9,538 | 34.71% | 1,159 | 4.22% | 65.85% | 9,538 | 8,379 | 6,969 | 873 | 1,449 | – | 270 | 27,478 |
| St. George—St. David | Lib | 10,718 | 36.08% | 72 | 0.24% | 64.63% | 10,646 | 10,718 | 6,955 | 932 | – | – | 455 | 29,706 | |
| Sarnia | → | NDP | 10,860 | 36.71% | 2,320 | 7.84% | 64.84% | 10,860 | 8,540 | 6,269 | 2,691 | 652 | – | 574 | 29,586 |
| Sault Ste. Marie | NDP | 14,036 | 36.26% | 697 | 1.80% | 68.26% | 14,036 | 13,339 | 3,347 | – | 7,991 | – | – | 38,713 | |
| Scarborough Centre | → | NDP | 12,324 | 45.21% | 3,068 | 11.25% | 64.45% | 12,324 | 9,256 | 5,682 | – | – | – | – | 27,262 |
| Scarborough East | → | NDP | 11,700 | 35.55% | 1,774 | 5.39% | 63.47% | 11,700 | 9,926 | 9,890 | – | – | 368 | 1,031 | 32,915 |
| Scarborough North | Lib | 13,393 | 44.56% | 3,916 | 13.03% | 57.86% | 9,477 | 13,393 | 5,367 | 1,199 | – | – | 620 | 30,056 | |
| Scarborough West | NDP | 14,340 | 51.16% | 7,819 | 27.90% | 65.21% | 14,340 | 6,521 | 5,769 | 996 | – | – | 401 | 28,027 | |
| Scarborough—Agincourt | Lib | 13,347 | 44.32% | 4,707 | 15.63% | 63.54% | 6,763 | 13,347 | 8,640 | – | – | – | 1,368 | 30,118 | |
| Scarborough—Ellesmere | → | NDP | 14,036 | 48.20% | 4,649 | 15.86% | 66.79% | 14,036 | 9,417 | 4,855 | – | – | – | 811 | 29,119 |
| Simcoe Centre | → | NDP | 15,711 | 37.79% | 2,842 | 6.84% | 62.46% | 15,711 | 12,869 | 10,013 | – | 2,979 | – | – | 41,572 |
| Simcoe East | PC | 14,828 | 39.65% | 740 | 1.98% | 67.46% | 14,088 | 7,219 | 14,828 | – | – | – | 1,263 | 37,398 | |
| Simcoe West | PC | 11,710 | 36.49% | 1,840 | 5.73% | 63.84% | 9,870 | 7,765 | 11,710 | 2,744 | – | – | – | 32,089 | |
| Stormont—Dundas and Glengarry & East Grenville | PC | 11,887 | 40.87% | 3,501 | 12.04% | 65.77% | 5,357 | 8,386 | 11,887 | – | 3,452 | – | – | 29,082 | |
| Sudbury | → | NDP | 13,407 | 41.21% | 3,397 | 10.44% | 66.57% | 13,407 | 10,010 | 3,318 | – | 5,795 | – | – | 32,530 |
| Sudbury East | NDP | 17,536 | 58.00% | 10,052 | 33.25% | 70.87% | 17,536 | 7,484 | 1,458 | – | 3,754 | – | – | 30,232 | |
| Timiskaming | Lib | 8,364 | 42.29% | 2,173 | 10.99% | 67.57% | 6,191 | 8,364 | 2,261 | – | 2,250 | – | 713 | 19,779 | |
| Victoria—Haliburton | → | NDP | 15,467 | 44.33% | 6,520 | 18.69% | 69.10% | 15,467 | 7,668 | 8,947 | 1,419 | – | 971 | 417 | 34,889 |
| Waterloo North | → | PC | 14,552 | 37.43% | 3,254 | 8.37% | 62.03% | 11,298 | 9,441 | 14,552 | 2,946 | – | – | 646 | 38,883 |
| Welland—Thorold | NDP | 20,488 | 63.62% | 12,931 | 40.16% | 69.80% | 20,488 | 7,557 | 2,893 | – | 878 | – | 386 | 32,202 | |
| Wellington | PC | 12,141 | 39.62% | 1,304 | 4.26% | 66.44% | 10,837 | 7,668 | 12,141 | – | – | – | – | 30,646 | |
| Wentworth East | → | NDP | 15,224 | 44.63% | 3,147 | 9.23% | 66.82% | 15,224 | 12,077 | 5,609 | – | – | 533 | 668 | 34,111 |
| Wentworth North | → | NDP | 11,472 | 34.05% | 88 | 0.26% | 69.63% | 11,472 | 11,384 | 8,740 | 1,236 | 860 | – | – | 33,692 |
| Willowdale | → | PC | 11,957 | 35.20% | 834 | 2.46% | 63.33% | 9,125 | 11,123 | 11,957 | 1,074 | – | – | 688 | 33,967 |
| Wilson Heights | Lib | 12,272 | 44.26% | 2,654 | 9.57% | 62.99% | 9,618 | 12,272 | 4,913 | – | – | – | 922 | 27,725 | |
| Windsor—Riverside | NDP | 21,144 | 71.03% | 14,504 | 48.72% | 62.16% | 21,144 | 6,640 | 1,096 | 889 | – | – | – | 29,769 | |
| Windsor—Sandwich | → | NDP | 15,952 | 54.45% | 4,145 | 14.15% | 58.96% | 15,952 | 11,807 | 1,186 | – | – | 353 | – | 29,298 |
| Windsor—Walkerville | → | NDP | 15,899 | 55.19% | 4,318 | 14.99% | 59.74% | 15,899 | 11,581 | 1,327 | – | – | – | – | 28,807 |
| York Centre | Lib | 28,056 | 45.57% | 9,206 | 14.95% | 61.85% | 18,850 | 28,056 | 14,656 | – | – | – | – | 61,562 | |
| York East | → | NDP | 10,689 | 35.81% | 789 | 2.64% | 68.03% | 10,689 | 9,900 | 8,021 | – | – | 380 | 858 | 29,848 |
| York Mills | → | PC | 13,037 | 44.64% | 2,647 | 9.06% | 68.30% | 4,830 | 10,390 | 13,037 | – | – | – | 950 | 29,207 |
| York—Mackenzie | Lib | 11,452 | 34.25% | 148 | 0.44% | 63.14% | 10,681 | 11,452 | 11,304 | – | – | – | – | 33,437 | |
| York South | NDP | 16,642 | 66.70% | 12,108 | 48.53% | 66.80% | 16,642 | 4,534 | 2,561 | – | – | – | 1,212 | 24,949 | |
| Yorkview | → | NDP | 9,945 | 49.58% | 1,619 | 8.07% | 61.11% | 9,945 | 8,326 | 1,254 | – | – | 231 | 303 | 20,059 |
- = open seat
- = turnout is above provincial average
- = incumbent re-elected
- = incumbency arose from byelection gain
- including spoilt ballots
- Provincewide turnout was 64.45%
- minor political parties receiving less than 1% of the popular vote are aggregated under "Other"; independent candidates are aggregated separately
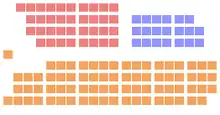
MPPs elected
Two-tone colour boxes indicate ridings that turned over from the 1987 election, eg,
|
|
Summary analysis
| Party in 1st place | Party in 2nd place | Total | |||
|---|---|---|---|---|---|
| NDP | Liberal | PC | |||
| New Democratic | 64 | 10 | 74 | ||
| Liberal | 29 | 7 | 36 | ||
| Progressive Conservative | 8 | 12 | 20 | ||
| Total | 37 | 76 | 17 | 130 | |
| Parties | Seats | |
|---|---|---|
| █ New Democratic | █ Liberal | 93 |
| █ New Democratic | █ Progressive Conservative | 18 |
| █ Progressive Conservative | █ Liberal | 19 |
| Total | 130 | |
| Parties | 1st | 2nd | 3rd | 4th | 5th | Total |
|---|---|---|---|---|---|---|
| █ New Democratic | 74 | 37 | 18 | 1 | 130 | |
| █ Liberal | 36 | 76 | 18 | 130 | ||
| █ Progressive Conservative | 20 | 17 | 84 | 9 | 130 | |
| █ Confederation of Regions | 8 | 17 | 7 | 32 | ||
| █ Green | 1 | 15 | 21 | 37 | ||
| █ Independent | 1 | 4 | 10 | 15 | ||
| █ Family Coalition | 57 | 9 | 66 | |||
| █ Libertarian | 13 | 19 | 32 | |||
| █ Freedom | 1 | 7 | 8 | |||
| █ Communist | 1 | 1 |
Seats changing hands
Of the 130 seats, 20 were open because of MPPs who chose not to stand for reelection, and voters in 63 seats changed allegiance from the previous election in 1987.
| Party | 1987 | Gain from (loss to) | 1990 | ||||||
|---|---|---|---|---|---|---|---|---|---|
| NDP | Lib | PC | |||||||
| New Democratic | 19 | 51 | 4 | 74 | |||||
| Liberal | 95 | (51) | (8) | 36 | |||||
| Progressive Conservative | 16 | (4) | 8 | 20 | |||||
| Total | 130 | – | (55) | 59 | – | 4 | (8) | 130 | |
The following seats changed allegiance from 1987:
| Source | Party | ||||||
|---|---|---|---|---|---|---|---|
| NDP | Lib | PC | Total | ||||
| Seats retained | Incumbents returned | 14 | 35 | 9 | 58 | ||
| Open seats held | 5 | 1 | 3 | 9 | |||
| Seats changing hands | Incumbents defeated | 45 | 6 | 51 | |||
| Open seats gained | 10 | 1 | 11 | ||||
| Byelection gains held | 1 | 1 | |||||
| Total | 74 | 36 | 20 | 130 | |||
Significant results among independent and minor party candidates
Those candidates not belonging to a major party, receiving more than 1,000 votes in the election, are listed below:
| Riding | Party | Candidates | Votes | Placed |
|---|---|---|---|---|
| Dufferin—Peel | █ Libertarian | Bob Shapton | 1,594 | 4th |
| Frontenac—Addington | █ Independent | Ross Baker | 1,021 | 5th |
| Kenora | █ Independent | Henry Wetelainen | 2,357 | 3rd |
| Mississauga East | █ Independent | Peter Sesek | 1,363 | 4th |
| Mississauga South | █ Green | Scott McWhinnie | 1,323 | 4th |
| Oakville South | █ Green | Josef Petriska | 1,038 | 5th |
| Ottawa West | █ Green | Ian Whyte | 1,011 | 5th |
| Parry Sound | █ Green | Richard Thomas | 4,061 | 3rd |
| St. Andrew—St. Patrick | █ Green | James Harris | 1,112 | 4th |
| Scarborough—Agincourt | █ Libertarian | William Galster | 1,368 | 4th |
| Simcoe East | █ Libertarian | John McLean | 1,263 | 4th |
Post-election changes
Party affiliation switches
Tony Rizzo (NDP) became an independent MPP on October 10, 1990, after questions were raised about labour practices in his bricklaying firms. He would later rejoin the NDP caucus.
Dennis Drainville (NDP) became an independent MPP on April 28, 1993, as a protest against the Rae government's plans to introduce casinos to the province. He later resigned his seat in the legislature, resulting in a by-election.
Will Ferguson (NDP) became an independent MPP on April 30, 1993, following accusations relating to the Grandview scandal. He later rejoined the NDP caucus on June 21, 1994, having been cleared of all charges.
John Sola (L) became an independent MPP on May 11, 1993, after making comments about Canadian Serbs that most regarded as racist.
Peter North (NDP) became an independent MPP on October 27, 1993, claiming he had lost confidence in the Rae government. He tried to join the Progressive Conservatives, but was rebuffed.
Byelections
Due to resignations, five by-elections were held between the 1990 and 1995 elections.
| Electoral district | Candidates | Incumbent | ||||||||
|---|---|---|---|---|---|---|---|---|---|---|
| Liberal | PC | NDP | Other | |||||||
| Brant—Haldimand March 5, 1992 |
Ronald Eddy 9,565 |
David Timms 4,758 |
Christopher Stanek 2,895 |
Donald Pennell (FCP) 2,056 Ella Haley (G) 759 Janice Wilson (Ind) 250 |
Robert Nixon resigned July 31, 1991 | |||||
| Don Mills April 1, 1993 |
Murad Velshi 5,583 |
David Johnson 9,143 |
Chandran Mylvaganam 1,513 |
Diane Johnston (Ind Renewal) 498 Denise Mountenay (FCP) 383 Bernadette Michael (Ind) 206 David Pengelly (F) 161 Sat Khalsa (G) 141 |
Margery Ward died January 22, 1993 | |||||
| St. George—St. David April 1, 1993 |
Tim Murphy 8,750 |
Nancy Jackman 6,518 |
George Lamony 1,451 |
Louis Di Rocco (FCP) 347 Phil Sarazen (G) 209 Judith Snow (Ind Renewal) 119 Ed Fortune (Ind) 107 Robert Smith (Ind) 72 John Steele (Comm League) 57 |
Ian Scott resigned September 8, 1992 | |||||
| Essex South December 2, 1993 |
Bruce Crozier 12,736 |
Joan Flood 3,295 |
David Maris 1,100 |
Joyce Ann Cherry (FCP) 1,060 Michael Green (G) 132 John Turmel (Ind) 84 |
Remo Mancini resigned May 10, 1993 | |||||
| Victoria—Haliburton March 17, 1994 |
Sharon McCrae 9,571 |
Chris Hodgson 11,941 |
Art Field 1,378 |
Ron Hawkrigg (Lbt) 252 Bradley Bradamore (Ind) 217 John Turmel (Ind) 123 |
Dennis Drainville resigned September 27, 1993 | |||||
Vacancies
In addition, four seats were vacant in the final months of the legislature, as the sitting members resigned and by-elections were not held to replace them before the 1995 election:
- Bruce — Murray Elston (L) resigned October 31, 1994
- Kitchener — Will Ferguson (NDP) resigned October 8, 1994
- Markham — Don Cousens (PC) resigned September 30, 1994
- St. Andrew—St. Patrick — Zanana Akande (NDP) resigned August 31, 1994
See also
References
- "1990 General Election". elections.on.ca. Elections Ontario. Retrieved May 27, 2023.
- Mackie, Richard (July 14, 1990). "Buoyant Liberals gather in Toronto for election talks". The Globe and Mail. p. A5.
- "Ontario NDP ahead of governing Liberals, poll finds". The Gazette. September 1, 1990. p. A1.
- "Ontario Liberal support plunges 10 points, poll shows". The Gazette. August 28, 1990. p. B1.
- Trickey, Mike (August 18, 1990). "TV debate likely to turn election heat up in Ontario". The Vancouver Sun. p. B3.
- "Leaders hone rhetoric to razor's edge for TV debate; Even smallest gaffes could be politically costly". The Ottawa Citizen. August 20, 1990. p. A4.
- Hall, Chris (September 1, 1990). "Ontario votes Sept. 6". The Ottawa Citizen. p. 1.
- "No summer of love for Ontario's NDP". The Globe and Mail. July 26, 1991. p. A12.
- Mackie, Richard (July 14, 1990). "Buoyant Liberals gather in Toronto for election talks: Meetings, polls fuel speculation about Ontario vote in September". The Globe and Mail. p. A5.
- Wood, Nancy (June 29, 1990). "Ontario party leaders gearing up as signs point to summer election". The Toronto Star. p. A17.
- Mackie, Richard (January 27, 1990). "Peterson becoming like Wile E. Coyote". The Globe and Mail. p. D1.
- "Ontario Grits grinning over lead". The Edmonton Journal. July 12, 1989. p. A3.
- Gooderman, Mary (January 18, 1989). "Ontario Liberals, New Democrats lose ground in post-election poll". The Globe and Mail. p. A3.
- Trickey, Mike (December 17, 1988). "Grit support dips, PCs pick up slack in new opinion poll". The Ottawa Citizen. p. B4.
- Fox, Brian (June 17, 1988). "Some of premier's lustre gone". The Windsor Star. p. A6.
- Fox, Brian (June 17, 1988). "Some of premier's lustre gone". The Windsor Star. p. A6.
- Walker, William (June 4, 1988). "Peterson rated more popular than policies". The Windsor Star. p. A8.
- French, Orland (March 4, 1999). "For whom the poll tolls". The Globe and Mail. p. A3.
- Sheppard, Robert (December 3, 1987). "Peterson's Liberals gaining popularity, latest figures show". The Globe and Mail. p. A19.
| General elections | |
|---|---|
| By-elections | |
| Municipal elections | |
| Referendums | |