1990 Shetland Islands Council election
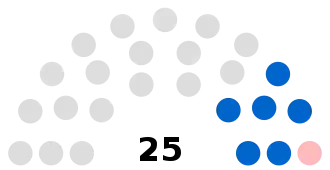
An election to the Shetland Islands Council was held on 3 May 1990 as part of regional elections. Independents maintained control of the 25 seat council. The Shetland Movement gained two seats, bringing their total to seven. The Scottish National Party and Liberal Democrats also ran candidates for the first time.
| |||||||||||||||||||||||||||||||||||||||||||||||||||||||||||||||||||||||||||
All 25 seats to Shetland Islands Council 13 seats needed for a majority | |||||||||||||||||||||||||||||||||||||||||||||||||||||||||||||||||||||||||||
|---|---|---|---|---|---|---|---|---|---|---|---|---|---|---|---|---|---|---|---|---|---|---|---|---|---|---|---|---|---|---|---|---|---|---|---|---|---|---|---|---|---|---|---|---|---|---|---|---|---|---|---|---|---|---|---|---|---|---|---|---|---|---|---|---|---|---|---|---|---|---|---|---|---|---|---|
| |||||||||||||||||||||||||||||||||||||||||||||||||||||||||||||||||||||||||||
 The result of the election | |||||||||||||||||||||||||||||||||||||||||||||||||||||||||||||||||||||||||||
| |||||||||||||||||||||||||||||||||||||||||||||||||||||||||||||||||||||||||||

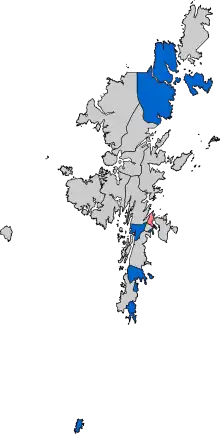
Results by electoral district.
Aggregate results
| Party | Seats | Gains | Losses | Net gain/loss | Seats % | Votes % | Votes | +/− | |
|---|---|---|---|---|---|---|---|---|---|
| Independent | 16 | 0 | 0 | - | 72 | 56.9% | 1,962 | ||
| Shetland Movement | 7 | 2 | 0 | 24 | 31.4% | 1,083 | |||
| Independent Labour | 1 | 1 | 0 | 4 | 0 | 0 | - | ||
| Labour | 1 | 0 | 4 | 1 | 7.1% | 246 | |||
| Liberal Democrats | 0 | 0 | 0 | 0 | 2.7% | 94 | |||
| SNP | 0 | 0 | 0 | 0 | 1.9% | 65 | |||
Ward Results
| Party | Candidate | Votes | % | |
|---|---|---|---|---|
| Independent | Florence Grains (incumbent) | unopposed | unopposed | |
| Majority | unopposed | unopposed | ||
| Independent hold | ||||
| Party | Candidate | Votes | % | |
|---|---|---|---|---|
| Independent | James Irvine (incumbent) | unopposed | unopposed | |
| Majority | unopposed | unopposed | ||
| Independent hold | ||||
| Party | Candidate | Votes | % | |
|---|---|---|---|---|
| Independent | George Pottinger | 213 | 55.2% | |
| Shetland Movement | William Cumming (incumbent) | 173 | 44.8% | |
| Majority | 40 | 10.4% | ||
| Independent gain from Shetland Movement | ||||
| Party | Candidate | Votes | % | |
|---|---|---|---|---|
| Independent | Andrea Manson (incumbent) | unopposed | unopposed | |
| Majority | unopposed | unopposed | ||
| Independent hold | ||||
| Party | Candidate | Votes | % | |
|---|---|---|---|---|
| Independent | Mary Colligan | unopposed | unopposed | |
| Majority | unopposed | unopposed | ||
| Independent hold | ||||
| Party | Candidate | Votes | % | |
|---|---|---|---|---|
| Independent | William Tait (incumbent) | unopposed | unopposed | |
| Majority | unopposed | unopposed | ||
| Independent hold | ||||
| Party | Candidate | Votes | % | |
|---|---|---|---|---|
| Shetland Movement | Magnus Flaws (incumbent) | 225 | 79.8% | |
| Independent | John Johnston | 57 | 20.2% | |
| Majority | 168 | 59.6% | ||
| Shetland Movement gain from Independent | ||||
| Party | Candidate | Votes | % | |
|---|---|---|---|---|
| Independent | Joan McLeod (incumbent) | unopposed | unopposed | |
| Majority | unopposed | unopposed | ||
| Independent hold | ||||
| Party | Candidate | Votes | % | |
|---|---|---|---|---|
| Independent | Cecil Eunson (Incumbent) | 241 | 79.8% | |
| Labour | Robert Adair | 61 | 20.2% | |
| Majority | 180 | 59.6% | ||
| Independent hold | ||||
| Party | Candidate | Votes | % | |
|---|---|---|---|---|
| Labour | Bill Smith (Incumbent) | 185 | 66.3% | |
| Liberal Democrats | Kenneth Crossan | 94 | 36.7% | |
| Majority | 91 | 29.6% | ||
| Labour hold | ||||
| Party | Candidate | Votes | % | |
|---|---|---|---|---|
| Independent | Robert Johnson | 122 | 36.9% | |
| Shetland Movement | William Playfair | 108 | 32.6% | |
| Independent | Ian Byrne | 101 | 30.5% | |
| Majority | 14 | 4.3% | ||
| Independent gain from Shetland Movement | ||||
| Party | Candidate | Votes | % | |
|---|---|---|---|---|
| Shetland Movement | Edward Thomason (incumbent) | unopposed | unopposed | |
| Majority | unopposed | unopposed | ||
| Shetland Movement hold | ||||
| Party | Candidate | Votes | % | |
|---|---|---|---|---|
| Independent Labour | Leonard Groat | unopposed | unopposed | |
| Majority | unopposed | unopposed | ||
| Independent Labour gain from Labour | ||||
| Party | Candidate | Votes | % | |
|---|---|---|---|---|
| Shetland Movement | John Graham (Incumbent) | 308 | 87.5% | |
| Independent | Ian Selbie | 44 | 12.5% | |
| Majority | 264 | 75.0% | ||
| Shetland Movement hold | ||||
| Party | Candidate | Votes | % | |
|---|---|---|---|---|
| Independent | Lewis Shand Smith | 179 | 43.6% | |
| Independent | Michael Johnston (Incumbent) | 174 | 42.3% | |
| Independent | William Henderson | 58 | 14.1% | |
| Majority | 5 | 1.3% | ||
| Independent hold | ||||
| Party | Candidate | Votes | % | |
|---|---|---|---|---|
| Independent | Greta McElvogue | unopposed | unopposed | |
| Majority | unopposed | unopposed | ||
| Independent hold | ||||
| Party | Candidate | Votes | % | |
|---|---|---|---|---|
| Independent | James Manson | 144 | 50.3% | |
| Independent | Bill Manson | 142 | 49.7% | |
| Majority | 2 | 0.6% | ||
| Independent gain from Labour | ||||
| Party | Candidate | Votes | % | |
|---|---|---|---|---|
| Independent | James Gear | unopposed | unopposed | |
| Majority | unopposed | unopposed | ||
| Independent hold | ||||
| Party | Candidate | Votes | % | |
|---|---|---|---|---|
| Shetland Movement | James Smith (Incumbent) | unopposed | unopposed | |
| Majority | unopposed | unopposed | ||
| Shetland Movement gain from Independent | ||||
| Party | Candidate | Votes | % | |
|---|---|---|---|---|
| Shetland Movement | William Anderson (Incumbent) | 183 | 65.8% | |
| Anti-Poll Tax | Ian Scott | 95 | 34.2% | |
| Majority | 88 | 31.6% | ||
| Shetland Movement gain from Independent | ||||
| Party | Candidate | Votes | % | |
|---|---|---|---|---|
| Independent | Joan Easten | 200 | 64.9% | |
| Independent | Elizabeth Nicolson (Incumbent) | 108 | 35.1% | |
| Majority | 92 | 29.8% | ||
| Independent hold | ||||
| Party | Candidate | Votes | % | |
|---|---|---|---|---|
| Independent | Henry Stewart (incumbent) | unopposed | unopposed | |
| Majority | unopposed | unopposed | ||
| Independent hold | ||||
| Party | Candidate | Votes | % | |
|---|---|---|---|---|
| Independent | Alex Arthur (incumbent) | unopposed | unopposed | |
| Majority | unopposed | unopposed | ||
| Independent hold | ||||
| Party | Candidate | Votes | % | |
|---|---|---|---|---|
| Shetland Movement | Andrew Williamson | 86 | 36.6% | |
| Independent | Philip Turner | 73 | 31.1% | |
| SNP | Derrick Tulloch | 65 | 27.7% | |
| Independent | Derek Rushton | 7 | 3.0% | |
| Independent | Philip Anderson | 4 | 1.7% | |
| Majority | 13 | 5.5% | ||
| Shetland Movement gain from Independent | ||||
| Party | Candidate | Votes | % | |
|---|---|---|---|---|
| Shetland Movement | Robert Gray | unopposed | unopposed | |
| Majority | unopposed | unopposed | ||
| Shetland Movement gain from Independent | ||||
By-elections since 1990
| Party | Candidate | Votes | % | |
|---|---|---|---|---|
| Independent | Bill Manson | 207 | 62.2% | |
| Independent | Thomas Balfour | 115 | 34.5% | |
| Independent | James Paterson | 11 | 3.3% | |
| Majority | 92 | 27.7% | ||
| Independent hold | ||||
| Party | Candidate | Votes | % | |
|---|---|---|---|---|
| Independent | Peter Guy | 208 | 70.0% | |
| Independent | Alan Ogden | 89 | 30.0% | |
| Majority | 119 | 40.0% | ||
| Independent gain from Shetland Movement | ||||
| Party | Candidate | Votes | % | |
|---|---|---|---|---|
| Independent | Hazel Simpson | unopposed | unopposed | |
| Majority | unopposed | unopposed | ||
| Independent hold | ||||
| Party | Candidate | Votes | % | |
|---|---|---|---|---|
| Independent | Jonathan Wills | 388 | 73.8% | |
| Independent | A.M. Leslie | 77 | 14.6% | |
| Independent | J.W. Johnson | 61 | 11.6% | |
| Majority | 311 | 59.2% | ||
| Independent hold | ||||
Notes
- Candidate was elected unopposed
References
- Bochel, JM; Denver, DT. "Scottish Regional Elections, 1990" (PDF). The Elections Centre. Retrieved 21 April 2020.
This article is issued from Wikipedia. The text is licensed under Creative Commons - Attribution - Sharealike. Additional terms may apply for the media files.