2003 Burnley Borough Council election
Elections to Burnley Borough Council in Lancashire, England were held on 1 May 2003. One third of the council was up for election with a by-election in the Whittlefield with Ightenhill ward. The British National Party won the popular vote and gained the most seats, although the Labour party retained overall control of the council.
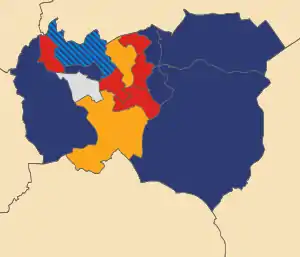
2003 local election results in Burnley
After the election, the composition of the council was
- Labour 24
- British National Party 8
- Liberal Democrat 7
- Conservative 3
- Others 3
Election result
| Party | Seats | Gains | Losses | Net gain/loss | Seats % | Votes % | Votes | +/− | |
|---|---|---|---|---|---|---|---|---|---|
| BNP | 7 | 6 | 1 | 5 | 43.7 | 30.5 | 8,543 | +18.7 | |
| Labour | 5 | 0 | 3 | -3 | 31.2 | 29.9 | 8,387 | -18.8 | |
| Liberal Democrats | 2 | 0 | 1 | -1 | 12.5 | 17.2 | 4,824 | +0.2 | |
| Independent | 1 | 1 | 1 | 0 | 6.3 | 12.2 | 3,431 | -0.7 | |
| Conservative | 1 | 0 | 1 | -1 | 6.3 | 9.7 | 2,730 | +1.1 | |
| Socialist Alliance | 0 | 0 | 0 | 0 | 0 | 0.5 | 134 | -0.3 | |
Ward results
| Party | Candidate | Votes | % | ±% | |
|---|---|---|---|---|---|
| Labour | Caroline Kavanagh | 708 | 47.0 | -21.2 | |
| BNP | Mark Halstead | 505 | 33.6 | +20.3 | |
| Conservative | Paul Coates | 196 | 13.0 | +13.0 | |
| Socialist Alliance | Avril Hesson | 96 | 6.4 | +6.4 | |
| Majority | 203 | 13.5 | |||
| Turnout | 1505 | ||||
| Labour hold | Swing | ||||
| Party | Candidate | Votes | % | ±% | |
|---|---|---|---|---|---|
| BNP | Patricia Thomson | 877 | 44.1 | +44.1 | |
| Liberal Democrats | Peter McCann | 862 | 43.3 | -25.8 | |
| Labour | Angela Healey | 250 | 12.6 | -18.3 | |
| Majority | 15 | 0.8 | |||
| Turnout | 1989 | ||||
| BNP gain from Liberal Democrats | Swing | ||||
| Party | Candidate | Votes | % | ±% | |
|---|---|---|---|---|---|
| BNP | Maureen Stowe | 715 | 37.0 | +20.1 | |
| Labour | David Halsall | 712 | 36.9 | -35.3 | |
| Conservative | Anita Walker | 259 | 13.4 | +13.4 | |
| Independent | Cliff Tahir | 245 | 12.7 | +1.8 | |
| Majority | 3 | 0.1 | |||
| Turnout | 1931 | ||||
| BNP gain from Labour | Swing | ||||
| Party | Candidate | Votes | % | ±% | |
|---|---|---|---|---|---|
| BNP | Brian Turner | 795 | 32.8 | +20.0 | |
| Conservative | Tony Walker | 551 | 22.8 | -13.6 | |
| Labour | Philip Walsh | 483 | 19.9 | -9.6 | |
| Independent | Kevin Robinson | 465 | 19.2 | +7.4 | |
| Liberal Democrats | Catherine Bennett | 128 | 5.3 | +5.3 | |
| Majority | 244 | 10.1 | |||
| Turnout | 2422 | ||||
| BNP gain from Independent | Swing | ||||
| Party | Candidate | Votes | % | ±% | |
|---|---|---|---|---|---|
| Liberal Democrats | Philip Horrocks | 803 | 51.6 | -11.8 | |
| BNP | Mark Pennington | 532 | 34.2 | +22.9 | |
| Labour | Antony Martin | 222 | 14.2 | -4.0 | |
| Majority | 271 | 17.4 | |||
| Turnout | 1557 | ||||
| Liberal Democrats hold | Swing | ||||
| Party | Candidate | Votes | % | ±% | |
|---|---|---|---|---|---|
| Liberal Democrats | Manzoor Hussain | 1,286 | 54.1 | +11.9 | |
| Independent | Imtiaz Hussain | 736 | 31.0 | +16.4 | |
| Labour | Anthony Harrison | 353 | 14.9 | -28.3 | |
| Majority | 550 | 23.1 | |||
| Turnout | 2374 | ||||
| Liberal Democrats hold | Swing | ||||
| Party | Candidate | Votes | % | ±% | |
|---|---|---|---|---|---|
| BNP | Carol Hughes | 687 | 38.6 | +23.6 | |
| Labour | Patrick Tierney | 611 | 34.3 | -12.2 | |
| Liberal Democrats | Mary Jane McCann | 274 | 15.4 | +15.4 | |
| Conservative | Jeffrey Pickup | 209 | 11.7 | +2.0 | |
| Majority | 76 | 4.3 | |||
| Turnout | 1781 | ||||
| BNP hold | Swing | ||||
| Party | Candidate | Votes | % | ±% | |
|---|---|---|---|---|---|
| Labour | Linda Gauton | 777 | 43.8 | -9.3 | |
| BNP | Andrew Kenyon | 712 | 40.2 | +25.7 | |
| Conservative | Laura Dowding | 284 | 16.0 | +8.7 | |
| Majority | 65 | 3.7 | |||
| Turnout | 1773 | ||||
| Labour hold | Swing | ||||
| Party | Candidate | Votes | % | ±% | |
|---|---|---|---|---|---|
| BNP | Len Starr | 661 | 39.0 | +25.1 | |
| Labour | Andrew Tatchell | 584 | 34.4 | -28.6 | |
| Independent | Patricia Stinton | 319 | 18.8 | +7.2 | |
| Conservative | Alan Marsden | 132 | 7.8 | +7.8 | |
| Majority | 77 | 4.5 | |||
| Turnout | 1696 | ||||
| BNP gain from Labour | Swing | ||||
| Party | Candidate | Votes | % | ±% | |
|---|---|---|---|---|---|
| BNP | Luke Smith | 668 | 34.0 | +18.1 | |
| Labour | Brian Cooper | 623 | 31.7 | -17.6 | |
| Liberal Democrats | Martin Smith | 365 | 18.5 | +2.4 | |
| Independent | Anthony Doyle | 311 | 15.8 | -2.9 | |
| Majority | 45 | 2.3 | |||
| Turnout | 1967 | ||||
| BNP gain from Labour | Swing | ||||
| Party | Candidate | Votes | % | ±% | |
|---|---|---|---|---|---|
| Labour | Mohammad Najib | 764 | 41.2 | -25.3 | |
| BNP | Rauth McGuinness | 612 | 33.0 | +17.0 | |
| Liberal Democrats | Denise Embra | 319 | 17.2 | -0.3 | |
| Independent | Ian Nelson | 160 | 8.6 | +8.6 | |
| Majority | 152 | 8.2 | |||
| Turnout | 1855 | ||||
| Labour hold | Swing | ||||
| Party | Candidate | Votes | % | ±% | |
|---|---|---|---|---|---|
| Independent | Sam Holgate | 618 | 43.7 | +2.0 | |
| Labour | Michael Nelson | 487 | 34.4 | -9.5 | |
| Liberal Democrats | Paul Smith | 192 | 13.6 | +13.6 | |
| Conservative | Barry Robinson | 118 | 8.3 | +8.3 | |
| Majority | 131 | 9.3 | |||
| Turnout | 1415 | ||||
| Independent gain from BNP | Swing | ||||
| Party | Candidate | Votes | % | ±% | |
|---|---|---|---|---|---|
| Labour | Janice Swainston | 679 | 36.6 | -17.9 | |
| BNP | James Cowell | 634 | 34.2 | +20.4 | |
| Liberal Democrats | Christopher Robinson | 285 | 15.4 | +15.4 | |
| Conservative | David Tierney | 255 | 13.7 | +2.5 | |
| Majority | 45 | 2.4 | |||
| Turnout | 1853 | ||||
| Labour hold | Swing | ||||
| Party | Candidate | Votes | % | ±% | |
|---|---|---|---|---|---|
| Labour | Elizabeth Monk | 598 | 41.6 | -23.2 | |
| BNP | Simon Haworth | 491 | 34.2 | +19.5 | |
| Liberal Democrats | William Bennett | 310 | 21.6 | +7.3 | |
| Socialist Alliance | Stephen Worden | 38 | 2.6 | -3.6 | |
| Majority | 107 | 7.4 | |||
| Turnout | 1437 | ||||
| Labour hold | Swing | ||||
| Party | Candidate | Votes | % | ±% | |
|---|---|---|---|---|---|
| Conservative | Ida Carmichael | 726 | 21.8 | ||
| BNP | Barry Birks | 654 | 19.7 | ||
| Independent | Jean Steward | 577 | 17.3 | ||
| Labour | Ian Townsend | 536 | 16.1 | ||
| Conservative | Alan Stewart | 436 | 18.1 | ||
| Labour | Hilary Ward | 398 | 12.0 | ||
| Majority | |||||
| Turnout | 3327 | ||||
| Conservative hold | Swing | ||||
| BNP gain from Conservative | Swing | ||||
References
- BBC News 2002 Burnley Election Results Accessed 2010
- Local Council Election Results Archive 2003 Accessed 2010
This article is issued from Wikipedia. The text is licensed under Creative Commons - Attribution - Sharealike. Additional terms may apply for the media files.