2019 Stevenage Borough Council election
Elections to Stevenage Borough Council took place on 2 May 2019. This was on the same day as other local elections across the United Kingdom. One third of the council was up for election; the seats were last contested in 2015. The Labour Party retained control of the council, which it has held continuously since 1973.
| |||||||||||||||||||||||||
13 of the 39 seats to Stevenage Borough Council 20 seats needed for a majority | |||||||||||||||||||||||||
|---|---|---|---|---|---|---|---|---|---|---|---|---|---|---|---|---|---|---|---|---|---|---|---|---|---|
| |||||||||||||||||||||||||
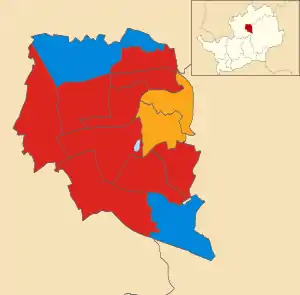 Map showing the results of contested wards in the 2019 Stevenage Borough Council elections. Labour in red, Conservatives in blue and Liberal Democrats in yellow. | |||||||||||||||||||||||||
| |||||||||||||||||||||||||
Results summary
| 2019 Stevenage Borough Council election | ||||||||||
|---|---|---|---|---|---|---|---|---|---|---|
| Party | This election | Full council | This election | |||||||
| Seats | Net | Seats % | Other | Total | Total % | Votes | Votes % | +/− | ||
| Labour | 9 | 69.2 | 18 | 27 | 69.2 | 7,860 | 38.1 | -6.1 | ||
| Conservative | 2 | 15.4 | 5 | 7 | 17.9 | 6,538 | 31.7 | -6.1 | ||
| Liberal Democrats | 2 | 15.4 | 3 | 5 | 12.8 | 4,634 | 22.4 | +7.5 | ||
| Green | 0 | 0.0 | 0 | 0 | 0.0 | 1,610 | 7.8 | +4.7 | ||
Ward results
Bandley Hill

Location of Bandley Hill ward
| Party | Candidate | Votes | % | ±% | |
|---|---|---|---|---|---|
| Labour Co-op | Adrian Richard Brown | 674 | 45.7 | -1.7 | |
| Conservative | Nicholas Rohan Foster | 574 | 38.9 | -5.0 | |
| Liberal Democrats | Andrew David Anderson | 227 | 15.4 | +6.6 | |
| Majority | 100 | 6.8 | |||
| Turnout | 1,475 | 29.49 | |||
| Labour gain from Conservative | Swing | ||||
Bedwell
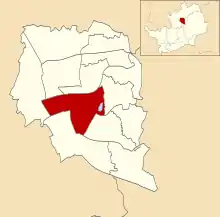
Location of Bedwell ward
| Party | Candidate | Votes | % | ±% | |
|---|---|---|---|---|---|
| Labour Co-op | Liz Harrington | 813 | 54.2 | -6.2 | |
| Conservative | Nicholas John Leech | 356 | 23.7 | -6.8 | |
| Green | Victoria Louise Snelling | 213 | 14.2 | +5.1 | |
| Liberal Democrats | Nick Macmillan | 119 | 7.9 | New | |
| Majority | 457 | 30.5 | |||
| Turnout | 1,501 | 27.85 | |||
| Labour hold | Swing | ||||
Chells
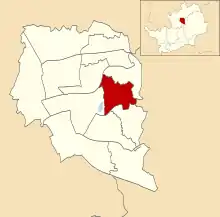
Location of Chells ward
| Party | Candidate | Votes | % | ±% | |
|---|---|---|---|---|---|
| Liberal Democrats | Stephen John Booth | 766 | 46.6 | +0.3 | |
| Labour Co-op | Pam Stuart | 446 | 27.1 | -5.6 | |
| Conservative | Matthew Paul Wyatt | 282 | 17.2 | -3.8 | |
| Green | David Peter Ingarfill | 149 | 9.1 | New | |
| Majority | 320 | 19.5 | |||
| Turnout | 1,643 | 33.54 | |||
| Liberal Democrats gain from Labour | Swing | ||||
Longmeadow
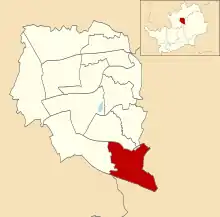
Location of Longmeadow ward
| Party | Candidate | Votes | % | ±% | |
|---|---|---|---|---|---|
| Conservative | Alexander Michael Farquharson | 682 | 45.3 | -2.8 | |
| Labour | Chris Webb | 608 | 40.3 | -0.3 | |
| Liberal Democrats | Nigel Robert Bye | 217 | 14.4 | +3.1 | |
| Majority | 74 | 5.0 | |||
| Turnout | 1,507 | 31.70 | |||
| Conservative hold | Swing | ||||
Manor

Location of Manor ward
| Party | Candidate | Votes | % | ±% | |
|---|---|---|---|---|---|
| Liberal Democrats | Robin Gareth Parker | 1,484 | 75.6 | +14.8 | |
| Conservative | James David Corrigan | 264 | 13.5 | -6.8 | |
| Labour | David Stanley Wood | 214 | 10.9 | -7.9 | |
| Majority | 1,220 | 62.1 | |||
| Turnout | 1,962 | 39.73 | |||
| Liberal Democrats hold | Swing | ||||
Martins Wood

Location of Martins Wood ward
| Party | Candidate | Votes | % | ±% | |
|---|---|---|---|---|---|
| Labour Co-op | Teresa Lynn Callaghan | 526 | 36.3 | -5.2 | |
| Liberal Democrats | Jill Brinkworth | 524 | 36.1 | +11.3 | |
| Conservative | Bret Ray Facey | 401 | 27.6 | -6.1 | |
| Majority | 2 | 0.2 | |||
| Turnout | 1,451 | 32.06 | |||
| Labour hold | Swing | ||||
Old Town

Location of Old Town ward
| Party | Candidate | Votes | % | ±% | |
|---|---|---|---|---|---|
| Labour Co-op | Loraine Graziella Rossati | 881 | 39.6 | -3.1 | |
| Conservative | James Robert Phillip Fraser | 845 | 38.0 | -4.8 | |
| Green | Elizabeth Genevieve Sturges | 312 | 14.0 | +5.8 | |
| Liberal Democrats | George Eric Pinder | 187 | 8.4 | +2.1 | |
| Majority | 36 | 1.6 | |||
| Turnout | 2,225 | 35.59 | |||
| Labour gain from Conservative | Swing | ||||
Pin Green

Location of Pin Green ward
| Party | Candidate | Votes | % | ±% | |
|---|---|---|---|---|---|
| Labour Co-op | Jeannette Audrey Thomas | 606 | 43.0 | -8.5 | |
| Conservative | Andy Facey | 454 | 32.2 | -4.6 | |
| Green | Naomi Ruth Collins | 228 | 16.2 | +4.5 | |
| Liberal Democrats | Ross London | 122 | 8.7 | New | |
| Majority | 152 | 10.8 | |||
| Turnout | 1,410 | 30.10 | |||
| Labour hold | Swing | ||||
Roebuck

Location of Roebuck ward
| Party | Candidate | Votes | % | ±% | |
|---|---|---|---|---|---|
| Labour Co-op | John Gardner | 698 | 43.8 | -4.3 | |
| Conservative | Janet Marie Munro | 537 | 33.7 | -6.6 | |
| Green | John Malocco Martin | 185 | 11.6 | +6.5 | |
| Liberal Democrats | Paul Matthew Barber | 174 | 10.9 | +4.8 | |
| Majority | 161 | 10.1 | |||
| Turnout | 1,594 | 31.75 | |||
| Labour hold | Swing | ||||
St Nicholas

Location of St Nicholas ward
| Party | Candidate | Votes | % | ±% | |
|---|---|---|---|---|---|
| Labour Co-op | Claire Lesley Parris | 787 | 46.9 | -5.0 | |
| Conservative | Mandi Tandi | 642 | 38.2 | +0.6 | |
| Liberal Democrats | Daniel Peter Charles Snell | 250 | 14.9 | +9.7 | |
| Majority | 145 | 8.7 | |||
| Turnout | 1,679 | 32.10 | |||
| Labour hold | Swing | ||||
Shephall

Location of Shephall ward
| Party | Candidate | Votes | % | ±% | |
|---|---|---|---|---|---|
| Labour Co-op | Sarah Jane Mead | 580 | 46.5 | -6.9 | |
| Conservative | Celia Lawrence | 368 | 29.5 | -5.9 | |
| Green | Michael Malocco | 201 | 16.1 | +9.9 | |
| Liberal Democrats | Charles Galton Darwin Littleton | 99 | 7.9 | +2.9 | |
| Majority | 212 | 17.0 | |||
| Turnout | 1,248 | 27.74 | |||
| Labour hold | Swing | ||||
Symonds Green

Location of Symonds Green ward
| Party | Candidate | Votes | % | ±% | |
|---|---|---|---|---|---|
| Labour | Michael Downing | 639 | 43.6 | -8.7 | |
| Conservative | Alexandra Marianne Young | 509 | 34.7 | -2.5 | |
| Green | Richard David Warr | 173 | 11.8 | +6.8 | |
| Liberal Democrats | Clive Hearmon | 145 | 9.9 | +4.4 | |
| Majority | 130 | 8.9 | |||
| Turnout | 1,466 | 33.48 | |||
| Labour hold | Swing | ||||
Woodfield
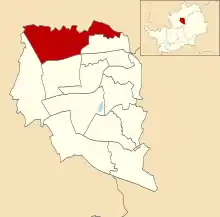
Location of Woodfield ward
| Party | Candidate | Votes | % | ±% | |
|---|---|---|---|---|---|
| Conservative | Graham Edward Lawrence | 624 | 46.8 | -7.1 | |
| Labour | Jim Callaghan | 388 | 29.1 | -6.0 | |
| Liberal Democrats | Neil Geoffrey Brinkworth | 320 | 24.0 | +13.0 | |
| Majority | 236 | 17.7 | |||
| Turnout | 1,332 | 32.10 | |||
| Conservative hold | Swing | ||||
References
- "Stevenage Borough Council". BBC News. 3 May 2019.
- "2019 Election Results". Stevenage Borough Council. 2 May 2019. Archived from the original on 10 May 2019. Retrieved 10 May 2019.
This article is issued from Wikipedia. The text is licensed under Creative Commons - Attribution - Sharealike. Additional terms may apply for the media files.