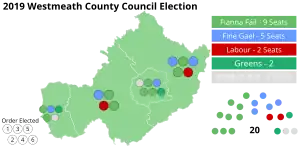
2019 Westmeath County Council election
An election to all 20 seats on Westmeath County Council was held on 24 May 2019 as part of the 2019 Irish local elections. County Westmeath was divided into 4 local electoral areas (LEAs) to elect councillors for a five-year term of office on the electoral system of proportional representation by means of the single transferable vote (PR-STV).
| |||||||||||||||||||||||||||||||||
All 20 seats on Westmeath County Council 11 seats needed for a majority | |||||||||||||||||||||||||||||||||
|---|---|---|---|---|---|---|---|---|---|---|---|---|---|---|---|---|---|---|---|---|---|---|---|---|---|---|---|---|---|---|---|---|---|
| |||||||||||||||||||||||||||||||||
 Results by local electoral area | |||||||||||||||||||||||||||||||||
| |||||||||||||||||||||||||||||||||
Boundary review
The 2018 LEA boundary review committee replaced the three LEAs used in the 2014 elections.[1][2]
Results by party
Fianna Fáil gained one seat in this election, Fine Gael and the Labour Party retained their five and two seats respectively, the Green Party had its first ever two local councillors in Westmeath elected, Sinn Féin lost their representation on this council while there were two Independent candidates elected. The smaller parties that ran candidates in Westmeath (Aontú, the Social Democrats and Renua) failed to make any breakthrough.
| Party | Seats | ± | 1st pref | FPv% | ±% | |
|---|---|---|---|---|---|---|
| Fianna Fáil | 9 | 12,259 | 36.34 | |||
| Fine Gael | 5 | 7,860 | 23.30 | |||
| Labour | 2 | 3,469 | 10.28 | |||
| Green | 2 | 1,174 | 3.48 | New | ||
| Sinn Féin | 0 | 1,957 | 5.80 | |||
| Aontú | 0 | 394 | 1.17 | New | ||
| Social Democrats | 0 | 194 | 0.58 | New | ||
| Renua | 0 | 86 | 0.25 | New | ||
| Independent | 2 | 6,344 | 18.80 | |||
| Total | 20 | 33,737 | 100.0 | |||
Results by local electoral area
^ *: Outgoing councillor elected in 2014.
^ †: Outgoing councillor coopted subsequent to the 2014 election.
Athlone
| Party | Candidate | FPv% | Count | |||||||||||
|---|---|---|---|---|---|---|---|---|---|---|---|---|---|---|
| 1 | 2 | 3 | 4 | 5 | 6 | 7 | 8 | 9 | 10 | 11 | ||||
| Fianna Fáil | Frankie Keena[*] | 18.55 | 1,584 | |||||||||||
| Fianna Fáil | Aengus O'Rourke[*] | 15.39 | 1,314 | 1,374 | 1,390 | 1,403 | 1,437 | |||||||
| Fine Gael | John Dolan[*] | 14.91 | 1,273 | 1,298 | 1,305 | 1,320 | 1,335 | 1,337 | 1,433 | |||||
| Independent | Jamie Moran | 12.04 | 1,028 | 1,042 | 1,072 | 1,089 | 1,126 | 1,128 | 1,167 | 1,238 | 1,417 | 1,420 | 1,615 | |
| Green | Louise Heavin | 6.95 | 593 | 604 | 627 | 706 | 729 | 731 | 771 | 864 | 935 | 939 | 1,071 | |
| Fine Gael | Alan Shaw | 6.59 | 563 | 574 | 578 | 594 | 601 | 603 | 623 | 692 | 752 | 754 | 794 | |
| Sinn Féin | Pádraig Hegarty | 6.11 | 522 | 528 | 538 | 558 | 567 | 567 | 581 | 605 | 715 | 716 | ||
| Independent | Paul Hogan[*] | 5.33 | 455 | 464 | 475 | 481 | 503 | 505 | 530 | 581 | ||||
| Independent | Michael O'Brien[*] | 4.03 | 344 | 352 | 363 | 380 | 392 | 394 | 429 | |||||
| Independent | P.J. Coghill | 3.64 | 311 | 318 | 325 | 328 | 347 | 349 | ||||||
| Aontú | Noel Peter McKervey | 2.30 | 196 | 198 | 223 | 226 | ||||||||
| Social Democrats | Fiona Lynam | 2.27 | 194 | 199 | 204 | |||||||||
| Renua | Anthony Moran | 1.01 | 86 | 88 | ||||||||||
| Independent | Imelda Geraghty | 0.49 | 42 | 42 | ||||||||||
| Independent | Donal Jackson | 0.37 | 32 | 33 | ||||||||||
| Electorate: 19,157 Valid: 8,537 Spoilt: 119 Quota: 1,423 Turnout: 8,656 | ||||||||||||||
Kinnegad
| Party | Candidate | FPv% | Count | ||||||
|---|---|---|---|---|---|---|---|---|---|
| 1 | 2 | 3 | 4 | 5 | 6 | ||||
| Fine Gael | Frank McDermott[*] | 15.16 | 1,246 | 1,281 | 1,303 | 1,392 | |||
| Fianna Fáil | John Shaw[*] | 14.79 | 1,216 | 1,244 | 1,258 | 1,279 | 1,322 | 1,521 | |
| Fianna Fáil | Paddy Hill[*] | 12.41 | 1,020 | 1,021 | 1,048 | 1,142 | 1,303 | 1,434 | |
| Labour | Denis Leonard | 12.03 | 989 | 1,014 | 1,020 | 1,046 | 1,191 | 1,314 | |
| Fine Gael | Emily Wallace[†] | 11.12 | 914 | 956 | 973 | 993 | 1,122 | 1,285 | |
| Fianna Fáil | Shauna Coyne | 8.41 | 691 | 699 | 710 | 725 | 765 | ||
| Sinn Féin | Hazel Behan | 7.65 | 629 | 631 | 646 | 749 | 823 | 898 | |
| Labour | Lorraine Scally | 7.08 | 582 | 597 | 608 | 698 | |||
| Independent | Úna D'Arcy[*] | 5.99 | 492 | 502 | 569 | ||||
| Independent | Patrick Joseph Boyhan | 3.19 | 262 | 268 | |||||
| Fine Gael | Becky Loftus Dore | 2.18 | 179 | ||||||
| Electorate: 16,746 Valid: 8,220 Spoilt: 169 Quota: 1,371 Turnout: 8,389 | |||||||||
Moate
| Party | Candidate | FPv% | Count | ||||
|---|---|---|---|---|---|---|---|
| 1 | 2 | 3 | 4 | ||||
| Fine Gael | Thomas Farrell[*] | 18.48 | 1,567 | 1,588 | 1,806 | ||
| Fianna Fáil | Liam McDaniel[†] | 15.68 | 1,329 | 1,363 | 1,528 | 1,597 | |
| Fianna Fáil | Vinny McCormack | 15.49 | 1,313 | 1,332 | 1,358 | 1,595 | |
| Labour | Johnnie Penrose[*] | 14.89 | 1,262 | 1,342 | 1,474 | 1,922 | |
| Independent | Michael O'Brien | 12.66 | 1,073 | 1,199 | 1,223 | 1,249 | |
| Fianna Fáil | Brian Crum[†] | 10.05 | 852 | 872 | 899 | ||
| Fine Gael | Damien Clear | 7.16 | 607 | 644 | |||
| Sinn Féin | Peter Judge | 3.48 | 295 | ||||
| Independent | Searlait Cabdi Ní Chianáin | 2.12 | 180 | ||||
| Electorate: 15,319 Valid: 8,478 Spoilt: 165 Quota: 1,696 Turnout: 8,643 | |||||||
Mullingar
| Party | Candidate | FPv% | Count | ||||||||||
|---|---|---|---|---|---|---|---|---|---|---|---|---|---|
| 1 | 2 | 3 | 4 | 5 | 6 | 7 | 8 | 9 | 10 | ||||
| Independent | Mick Dollard[*] | 15.13 | 1,286 | ||||||||||
| Fianna Fáil | Ken Glynn[*] | 14.02 | 1,192 | 1,201 | 1,203 | 1,217 | |||||||
| Fianna Fáil | Aoife Davitt | 10.42 | 886 | 891 | 892 | 907 | 907 | 921 | 951 | 1,008 | 1,059 | 1,120 | |
| Fianna Fáil | William Patrick Collentine[†] | 10.14 | 862 | 872 | 873 | 886 | 888 | 906 | 930 | 979 | 1,029 | 1,106 | |
| Fine Gael | Andrew Joseph Duncan[*] | 9.27 | 788 | 795 | 797 | 811 | 811 | 850 | 880 | 937 | 980 | 1,078 | |
| Fine Gael | Gerard Joseph Heery | 8.5 | 723 | 728 | 732 | 741 | 741 | 767 | 786 | 831 | 853 | 955 | |
| Green | Hazel Smyth | 6.83 | 581 | 584 | 591 | 605 | 605 | 655 | 681 | 753 | 860 | 1,019 | |
| Independent | Sean Lynch | 6.25 | 531 | 537 | 545 | 569 | 569 | 611 | 627 | 665 | 742 | ||
| Sinn Féin | Sorca Clarke[*] | 6.01 | 511 | 518 | 522 | 537 | 537 | 561 | 587 | 616 | |||
| Labour | Mark Scally | 4.16 | 354 | 359 | 360 | 363 | 363 | 384 | 487 | ||||
| Labour | Margaret Lynam Sweeney | 3.32 | 282 | 290 | 291 | 295 | 295 | 307 | |||||
| Independent | Chris Murtagh | 2.98 | 253 | 256 | 267 | 294 | 294 | ||||||
| Aontú | Séamus Burke | 2.33 | 198 | 200 | 205 | ||||||||
| Independent | Alice McDonnell | 0.65 | 55 | 56 | |||||||||
| Electorate: 19,946 Valid: 8,502 Spoilt: 200 Quota: 1,215 Turnout: 8,702 | |||||||||||||
Results by gender
| 2019 Westmeath County Council election[7][8] Candidates by gender | ||||
|---|---|---|---|---|
| Gender | Number of candidates |
% of candidates |
Elected councillors |
% of councillors |
| Men | 34 | 69.4% | 16 | 80.0% |
| Women | 15 | 30.6% | 4 | 20.0% |
| TOTAL | 49 | 20 | ||
Sources
- "Westmeath County Council - Local Election candidates". RTÉ. 13 May 2019. Archived from the original on 6 June 2019. Retrieved 15 May 2019.
- "Elections 2019". Westmeath County Council. Archived from the original on 4 September 2020. Retrieved 19 June 2019.
- "Elections 2019; How the Voting Went". The Westmeath Examiner. 1 June 2019. pp. 6–7.
- "Local Elections 2019: Results, Transfer of Votes and Statistics" (PDF). Department of Housing, Planning and Local Government (DHPLG). pp. 208–212. Archived from the original (PDF) on 10 June 2020. Retrieved 10 June 2020.
References
- Local Electoral Area Boundary Committee No. 1 (13 June 2018). Report 2018 (PDF). Government Publications. pp. 114–117, 165. ISBN 978-1-4064-2990-9. Archived from the original (PDF) on 14 November 2018. Retrieved 8 May 2019.
- Phelan, John Paul (19 December 2018). "S.I. No. 636/2018 — County of Westmeath Local Electoral Areas Order 2018". electronic Irish Statute Book (eISB). Archived from the original on 2 February 2019. Retrieved 8 May 2019.
- DHPLG 2019, p. 208–209.
- DHPLG 2019, p. 210.
- DHPLG 2019, p. 211.
- DHPLG 2019, p. 212.
- "Westmeath County Council: Greens surprise with two seats". The Irish Times. Dublin. 27 May 2019 [25 May 2019]. Archived from the original on 20 June 2021.
- DHPLG 2019, p. 247.