2019 Kildare County Council election
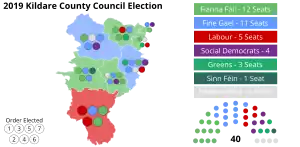
An election to all 40 seats on Kildare County Council was held on 24 May 2019 as part of the 2019 Irish local elections. County Kildare was divided into 8 local electoral areas (LEAs) to elect councillors for a five-year term of office on the electoral system of proportional representation by means of the single transferable vote (PR-STV).
| |||||||||||||||||||||||||||||||||||||||||||||||||||||
All 40 seats on Kildare County Council 21 seats needed for a majority | |||||||||||||||||||||||||||||||||||||||||||||||||||||
|---|---|---|---|---|---|---|---|---|---|---|---|---|---|---|---|---|---|---|---|---|---|---|---|---|---|---|---|---|---|---|---|---|---|---|---|---|---|---|---|---|---|---|---|---|---|---|---|---|---|---|---|---|---|
| |||||||||||||||||||||||||||||||||||||||||||||||||||||
 Results by Local Electoral Area | |||||||||||||||||||||||||||||||||||||||||||||||||||||
Boundary review
Following a recommendation of the 2018 Boundary Committee, the boundaries of the LEAs were altered from those used in the 2014 elections.[1][2] Its terms of reference required no change in the total number of councillors but set a lower maximum LEA size of seven councillors, exceeded by three of the five 2014 LEAs. Other changes were necessitated by population shifts revealed by the 2016 census.
Overview
Fianna Fáil remained the largest party with 12 seats although they saw a slight reduction in vote share. Fine Gael increased their vote share by over 2% and also gained an extra 2 seats to have a total of 11. Labour retained their 5 seats on the council. The Social Democrats benefitted from the presence of Catherine Murphy in the County and saw 4 gains with the party winning seats in Clane, Leixlip, Naas and Newbridge. The Green Party returned to the council with 3 seats; its 3 gains coming from Celbridge, Maynooth and Naas.
Sinn Féin lost 4 seats overall as its vote share fell by 67% and the party only came home with 1 seat. Partly due to retirements Independents saw a net loss of 5 seats.
Results by party
| Party | Seats | ± | 1st pref | FPv% | ±% | |
|---|---|---|---|---|---|---|
| Fianna Fáil | 12 | 17,614 | 25.67 | |||
| Fine Gael | 11 | 16,964 | 24.72 | |||
| Labour | 5 | 8,774 | 12.79 | |||
| Social Democrats | 4 | 4,600 | 6.70 | New | ||
| Green | 3 | 4,945 | 7.21 | |||
| Sinn Féin | 1 | 3,060 | 4.46 | |||
| Aontú | 0 | 636 | 0.93 | New | ||
| People Before Profit | 0 | 314 | 0.46 | |||
| Renua | 0 | 190 | 0.28 | New | ||
| Independent | 4 | 11,522 | 16.79 | |||
| Total | 40 | 68,619 | 100.0 | |||
Results by local electoral area
^ *: Outgoing councillor elected in 2014.
^ †: Outgoing councillor coopted subsequent to the 2014 election.
Athy
| Party | Candidate | FPv% | Count | ||||||||
|---|---|---|---|---|---|---|---|---|---|---|---|
| 1 | 2 | 3 | 4 | 5 | 6 | 7 | 8 | ||||
| Labour | Mark Wall[*][lower-alpha 1] | 26.97% | 2,489 | ||||||||
| Fine Gael | Ivan Keatley[*] | 15.99% | 1,476 | 1,536 | 1,580 | ||||||
| Labour | Aoife Breslin[*] | 15.47% | 1,428 | 2,026 | |||||||
| Fianna Fáil | Brian Dooley[†] | 10.43% | 963 | 1,033 | 1,137 | 1,165 | 1,172 | 1,216 | 1,389 | 1,586 | |
| Fianna Fáil | Emmet Kane | 6.08% | 561 | 590 | 608 | 618 | 621 | 684 | |||
| Fianna Fáil | Veralouise Behan | 5.89% | 544 | 591 | 631 | 663 | 664 | 766 | 1,044 | 1,216 | |
| Sinn Féin | Thomas Redmond[*] | 5.88% | 543 | 604 | 719 | 785 | 791 | 871 | 912 | 1,003 | |
| Independent | Tony McNamee | 5.76% | 532 | 542 | 554 | 601 | 605 | ||||
| Fine Gael | Ciara O'Keeffe | 4.80% | 443 | 496 | 573 | 622 | 634 | 719 | 774 | ||
| Social Democrats | Samantha Kenny | 2.72% | 251 | 271 | 316 | ||||||
| Electorate: 19,330 Valid: 9,230 Spoilt: 219 Quota: 1,539 Turnout: 9,449 (48.88%) | |||||||||||
Celbridge
| Party | Candidate | FPv% | Count | ||||||||
|---|---|---|---|---|---|---|---|---|---|---|---|
| 1 | 2 | 3 | 4 | 5 | 6 | 7 | 8 | ||||
| Fianna Fáil | Michael Coleman[†] | 22.38% | 1,493 | ||||||||
| Independent | Íde Cussen[*] | 12.62% | 842 | 877 | 902 | 927 | 981 | 1,075 | 1,151 | 1,276 | |
| Green | Vanessa Liston | 12.20% | 814 | 832 | 839 | 864 | 905 | 952 | 1,093 | 1,297 | |
| Independent | Brendan Young[*] | 10.64% | 710 | 726 | 751 | 792 | 837 | 898 | 978 | 1,146 | |
| Labour | Ciara Galvin | 9.94% | 663 | 683 | 691 | 708 | 736 | 786 | 971 | 1,155 | |
| Social Democrats | Stephen Marken | 9.75% | 650 | 665 | 680 | 706 | 730 | 765 | 840 | ||
| Fine Gael | Philip Slattery | 8.73% | 582 | 606 | 618 | 625 | 656 | 682 | |||
| Independent | Michael Beirne | 4.71% | 314 | 326 | 341 | 355 | 395 | ||||
| Independent | Peter Kavanagh | 4.03% | 269 | 277 | 297 | 306 | |||||
| Sinn Féin | John Paul Monks | 2.71% | 181 | 186 | 192 | ||||||
| Independent | Tony Murray | 2.28% | 152 | 157 | |||||||
| Electorate: 15,383 Valid: 6,670 Spoilt: 133 Quota: 1,335 Turnout: 6,803 (44.22%) | |||||||||||
Clane
| Party | Candidate | FPv% | Count | ||||||||||
|---|---|---|---|---|---|---|---|---|---|---|---|---|---|
| 1 | 2 | 3 | 4 | 5 | 6 | 7 | 8 | 9 | 10 | ||||
| Fine Gael | Brendan Weld[*] | 15.10% | 1,255 | 1,269 | 1,310 | 1,338 | 1,393 | ||||||
| Fianna Fáil | Daragh Fitzpatrick[*] | 14.12% | 1,173 | 1,181 | 1,208 | 1,366 | 1,399 | ||||||
| Independent | Pádraig McEvoy[*] | 13.45% | 1,118 | 1,137 | 1,179 | 1,220 | 1,309 | 1,381 | 1,385 | 1,387 | |||
| Social Democrats | Aidan Farrelly | 12.79% | 1,063 | 1,084 | 1,113 | 1,147 | 1,209 | 1,326 | 1,331 | 1,332 | 1,745 | ||
| Fine Gael | Brendan Wyse | 10.25% | 852 | 861 | 889 | 905 | 922 | 944 | 945 | 948 | 1,032 | 1,119 | |
| Fine Gael | Seamus Langan | 8.80% | 731 | 740 | 762 | 778 | 784 | 803 | 803 | 803 | 857 | 913 | |
| Green | Eoin Hallissey | 7.22% | 600 | 622 | 636 | 664 | 713 | 781 | 784 | 785 | |||
| Sinn Féin | Marc Gibbs | 4.60% | 382 | 393 | 415 | 427 | 445 | ||||||
| Fianna Fáil | Daniel Keenan | 4.21% | 350 | 361 | 372 | ||||||||
| Aontú | Una O'Connor | 3.81% | 317 | 354 | 382 | 394 | |||||||
| Independent | Thomas Hogan | 3.36% | 279 | 289 | |||||||||
| Renua | Séamus Ó Riain | 2.29% | 190 | ||||||||||
| Electorate: 18,527 Valid: 8,310 Spoilt: 168 Quota: 1,386 Turnout: 8,478 (45.76%) | |||||||||||||
Kildare
| Party | Candidate | FPv% | Count | |||||||
|---|---|---|---|---|---|---|---|---|---|---|
| 1 | 2 | 3 | 4 | 5 | 6 | 7 | ||||
| Fianna Fáil | Suzanne Doyle[*] | 24.50% | 1,847 | |||||||
| Fianna Fáil | Anne Connolly | 16.48% | 1,242 | 1,482 | ||||||
| Fine Gael | Kevin Duffy | 14.62% | 1,102 | 1,147 | 1,173 | 1,350 | ||||
| Fine Gael | Mark Stafford[*] | 13.07% | 985 | 1,090 | 1,124 | 1,161 | 1,299 | |||
| Sinn Féin | Patricia Ryan[lower-alpha 1] | 9.02% | 680 | 708 | 721 | 874 | 1,006 | 1,081 | 1,096 | |
| Independent | Declan Crowe | 8.90% | 671 | 753 | 797 | 853 | 1,029 | 1,047 | 1,074 | |
| Green | Colette Newman | 6.79% | 512 | 573 | 603 | 673 | ||||
| Labour | Paul Hutchinson | 6.62% | 499 | 528 | 549 | |||||
| Electorate: 17,272 Valid: 7,538 Spoilt: 161 Quota: 1,257 Turnout: 7,699 (44.58%) | ||||||||||
Leixlip
| Party | Candidate | FPv% | Count | |||||
|---|---|---|---|---|---|---|---|---|
| 1 | 2 | 3 | 4 | 5 | ||||
| Fine Gael | Joe Neville[*] | 25.54% | 1,596 | |||||
| Fianna Fáil | Bernard Caldwell[*] | 16.91% | 1,057 | 1,066 | 1,105 | 1,369 | 1,574 | |
| Social Democrats | Nuala Killeen | 16.00% | 1,000 | 1,004 | 1,135 | 1,226 | 1,498 | |
| Independent | Anthony Larkin[*] | 13.74% | 859 | 867 | 962 | 1,051 | 1,234 | |
| Fianna Fáil | Valerie Colton | 10.22% | 639 | 643 | 669 | |||
| Labour | Mairéad Beades | 10.03% | 627 | 633 | 707 | 816 | ||
| Green | Jason W. Kenny | 2.96% | 185 | 186 | ||||
| Sinn Féin | Anthony Doyle | 2.38% | 149 | 149 | ||||
| Independent | Sean Gill | 1.34% | 84 | 84 | ||||
| Independent | Michael Reidy | 0.86% | 54 | 55 | ||||
| Electorate: 13,174 Valid: 6,250 Spoilt: 86 Quota: 1,563 Turnout: 6,336 (48.09%) | ||||||||
Maynooth
| Party | Candidate | FPv% | Count | ||||
|---|---|---|---|---|---|---|---|
| 1 | 2 | 3 | 4 | ||||
| Fianna Fáil | Naoise Ó Cearúil[*] | 16.40% | 1,341 | 1,405 | |||
| Fianna Fáil | Paul Ward[*] | 15.95% | 1,304 | 1,339 | 1,354 | 1,455 | |
| Labour | Angela Feeney | 13.45% | 1,100 | 1,197 | 1,206 | 1,434 | |
| Fine Gael | Tim Durkan[*] | 13.44% | 1,099 | 1,134 | 1,139 | 1,234 | |
| Fine Gael | Rioana "Oni" Mulligan | 11.60% | 949 | 985 | 986 | 1,088 | |
| Green | Peter Hamilton | 11.38% | 931 | 1,047 | 1,053 | 1,304 | |
| Independent | Teresa Murray[*] | 10.17% | 832 | 962 | 967 | ||
| Sinn Féin | Réada Cronin[*] | 6.24% | 510 | ||||
| Independent | John Reid | 1.37% | 112 | ||||
| Electorate: 17,928 Valid: 8,178 Spoilt: 187 Quota: 1,364 Turnout: 8,365 (46.66%) | |||||||
Naas
| Party | Candidate | FPv% | Count | ||||||||||
|---|---|---|---|---|---|---|---|---|---|---|---|---|---|
| 1 | 2 | 3 | 4 | 5 | 6 | 7 | 8 | 9 | 10 | ||||
| Green | Vincent P. Martin[lower-alpha 1] | 12.01% | 1,462 | 1,505 | 1,521 | 1,596 | |||||||
| Fine Gael | Fintan Brett[*] | 10.42% | 1,269 | 1,277 | 1,283 | 1,289 | 1,291 | 1,302 | 1,313 | 1,374 | 1,510 | 1,583 | |
| Fine Gael | Evie Sammon | 9.95% | 1,211 | 1,233 | 1,236 | 1,254 | 1,257 | 1,305 | 1,309 | 1,357 | 1,667 | ||
| Fianna Fáil | Brian Larkin | 8.25% | 1,004 | 1,012 | 1,055 | 1,064 | 1,067 | 1,098 | 1,122 | 1,146 | 1,219 | 1,229 | |
| Independent | Seamie Moore[*] | 7.98% | 971 | 982 | 996 | 1,037 | 1,038 | 1,172 | 1,325 | 1,370 | 1,491 | 1,512 | |
| Fianna Fáil | Carmel Kelly[†] | 7.80% | 950 | 963 | 1,078 | 1,082 | 1,084 | 1,109 | 1,150 | 1,422 | 1,495 | 1,505 | |
| Social Democrats | Bill Clear | 7.60% | 925 | 947 | 966 | 1,012 | 1,034 | 1,070 | 1,153 | 1,250 | 1,319 | 1,332 | |
| Labour | Anne Breen[*] | 7.53% | 917 | 926 | 945 | 960 | 965 | 1,009 | 1,049 | 1,281 | 1,392 | 1,410 | |
| Fine Gael | Darren Scully[*] | 7.23% | 880 | 884 | 894 | 902 | 905 | 932 | 971 | 1,000 | |||
| Labour | Fergus Carpenter | 6.94% | 845 | 858 | 867 | 884 | 886 | 900 | 936 | ||||
| Independent | Gerard Dunne | 3.58% | 436 | 448 | 453 | 484 | 487 | ||||||
| Independent | Sorcha O'Neill[*] | 3.54% | 431 | 458 | 461 | 523 | 531 | 602 | |||||
| People Before Profit | Ashling Merriman | 2.58% | 314 | 370 | 371 | ||||||||
| Fianna Fáil | Terry Dignan | 2.34% | 285 | 289 | |||||||||
| Sinn Féin | Niall Flynn | 2.26% | 275 | ||||||||||
| Electorate: 26,430 Valid: 12,175 Spoilt: 261 Quota: 1,522 Turnout: 12,436 (47.05%) | |||||||||||||
Newbridge
| Party | Candidate | FPv% | Count | |||||||||||
|---|---|---|---|---|---|---|---|---|---|---|---|---|---|---|
| 1 | 2 | 3 | 4 | 5 | 6 | 7 | 8 | 9 | 10 | 11 | ||||
| Independent | Fiona McLoughlin Healy[*] | 22.70% | 2,331 | |||||||||||
| Fine Gael | Peggy O'Dwyer | 10.33% | 1,061 | 1,195 | 1,202 | 1,228 | 1,239 | 1,271 | 1,467 | |||||
| Fianna Fáil | Robert Power[*] | 9.97% | 1,024 | 1,087 | 1,090 | 1,108 | 1,118 | 1,141 | 1,184 | 1,218 | 1,228 | 1,335 | 1,437 | |
| Fine Gael | Tracey O'Dwyer | 9.72% | 998 | 1,043 | 1,045 | 1,062 | 1,069 | 1,088 | 1,144 | 1,192 | 1,231 | 1,433 | 1,505 | |
| Fianna Fáil | Noel Heavey | 7.13% | 732 | 802 | 809 | 816 | 830 | 869 | 918 | 948 | 952 | 1,032 | 1,118 | |
| Social Democrats | Chris Pender | 6.92% | 711 | 833 | 848 | 894 | 999 | 1,042 | 1,065 | 1,254 | 1,258 | 1,313 | 1,477 | |
| Fianna Fáil | Antoinette Buckley | 5.75% | 590 | 631 | 632 | 639 | 645 | 656 | 675 | 701 | 702 | |||
| Fianna Fáil | Murty Aspell[†] | 5.02% | 515 | 573 | 575 | 583 | 596 | 627 | 704 | 719 | 719 | 829 | 902 | |
| Fine Gael | Tom Dempsey | 4.63% | 475 | 519 | 521 | 529 | 537 | 553 | ||||||
| Green | Enda Connolly | 4.29% | 441 | 484 | 497 | 538 | 580 | 628 | 636 | |||||
| Independent | Morgan McCabe[†] | 4.08% | 419 | 504 | 546 | 553 | 586 | 654 | 677 | 747 | 749 | 774 | ||
| Sinn Féin | Noel Connolly | 3.31% | 340 | 373 | 377 | 381 | ||||||||
| Aontú | Damian Molyneaux | 3.11% | 319 | 376 | 395 | 411 | 452 | |||||||
| Labour | Ciara O'Reilly | 2.01% | 206 | 235 | 237 | |||||||||
| Independent | Gerard Delaney | 1.03% | 106 | 146 | ||||||||||
| Electorate: 22,464 Valid: 10,268 Spoilt: 217 Quota: 1,467 Turnout: 10,485 (46.67%) | ||||||||||||||
Footnotes
- See change below.
Results by gender
| 2019 Kildare County Council election[12][13] Candidates by gender | ||||
|---|---|---|---|---|
| Gender | Number of candidates |
% of candidates |
Elected councillors |
% of councillors |
| Men | 61 | 67.8% | 24 | 60.0% |
| Women | 29 | 32.2% | 16 | 40.0% |
| TOTAL | 90 | 40 | ||
Changes after 2019
| Party | Outgoing | Electoral area | Reason | Date | Co-optee | |
|---|---|---|---|---|---|---|
| Sinn Féin | Patricia Ryan | Kildare | Elected to the 33rd Dáil at the 2020 general election[14][15] | 25 February 2020 | Noel Connolly[16] | |
| Labour | Mark Wall | Athy | Elected to the 26th Seanad at the 2020 Seanad election[17] | 26 May 2020 | Mark Leigh[18] | |
| Green | Vincent P. Martin | Naas | Nominated by the Taoiseach to 26th Seanad[19] | September 2020 | Colm Kenny[20] | |
Sources
- "Kildare County Council - Local Election candidates". RTÉ. 13 May 2019. Archived from the original on 31 May 2019. Retrieved 15 May 2019.
- "Local Elections 2019: Results, Transfer of Votes and Statistics" (PDF). Department of Housing, Planning and Local Government (DHPLG). pp. 126–135. Archived from the original (PDF) on 10 June 2020. Retrieved 10 June 2020.
References
- Local Electoral Area Boundary Committee No. 1 (13 June 2018). Report 2018 (PDF). Government Publications. pp. 48–51, 148. ISBN 978-1-4064-2990-9. Archived (PDF) from the original on 30 April 2023. Retrieved 8 May 2019.
- County of Kildare Local Electoral Areas Order 2018 (S.I. No. 620 of 2018). Signed on 19 December 2018 by John Paul Phelan, Minister of State at the Department of Housing, Planning and Local Government. Statutory Instrument of the Government of Ireland. Archived from the original on 2 February 2019. Retrieved from Irish Statute Book on 8 May 2019.
- "Local Election 24 May 2019 — Constituency of Athy LEA" (PDF). Kildare County Council. Archived from the original (PDF) on 7 September 2020. Retrieved 18 June 2019.
- "Local Election 24 May 2019 — Constituency of Celbridge LEA" (PDF). Kildare County Council. Archived from the original (PDF) on 8 September 2020. Retrieved 18 June 2019.
- "Local Election 24 May 2019 — Constituency of Clane LEA" (PDF). Kildare County Council. Archived from the original (PDF) on 8 September 2020. Retrieved 18 June 2019.
- "Local Election 24 May 2019 — Constituency of Kildare LEA" (PDF). Kildare County Council. Archived from the original (PDF) on 8 September 2020. Retrieved 18 June 2019.
- "Local Election 24 May 2019 — Constituency of Leixlip LEA" (PDF). Kildare County Council. Archived from the original (PDF) on 8 September 2020. Retrieved 18 June 2019.
- "Local Election 24 May 2019 — Constituency of Maynooth LEA" (PDF). Kildare County Council. Archived from the original (PDF) on 8 September 2020. Retrieved 18 June 2019.
- "Local Election 24 May 2019 — Constituency of Naas LEA" (PDF). Kildare County Council. Archived from the original (PDF) on 8 September 2020. Retrieved 18 June 2019.
- "Local Election 24 May 2019 — Constituency of Newbridge LEA PART A - 1 to 10 of 11 Counts" (PDF). Kildare County Council. Archived from the original (PDF) on 8 September 2020. Retrieved 18 June 2019.
- "Local Election 24 May 2019 — Constituency of Newbridge LEA PART B - Counts 11–11 of 11" (PDF). Kildare County Council. Archived from the original (PDF) on 8 September 2020. Retrieved 18 June 2019.
- "Kildare County Council: Fianna Fáil and Fine Gael dominate". The Irish Times. Dublin. 27 May 2019 [25 May 2019]. Archived from the original on 12 June 2021. Retrieved 11 June 2022.
- DHPLG 2019, p. 247.
- Forrest, Conor (10 February 2020) [9 February 2020]. "Kildare South results: Fianna Fáil's Fiona O'Loughlin loses seat; Sinn Féin's Patricia Ryan tops poll with Martin Heydon (FG) and Cathal Berry (Ind) taking remaining seats". The Irish Times. Dublin. Archived from the original on 7 June 2021. Retrieved 6 June 2021.
- "Election 2020: Kildare South". The Irish Times. Dublin. 10 February 2020. Archived from the original on 7 June 2021. Retrieved 6 June 2021.
- "Kildare County Council co-opts new Sinn Fein councillor". KildareNow. 25 February 2020. Archived from the original on 7 June 2021. Retrieved 7 May 2020.
- O'Halloran, Marie (4 April 2020). "Seanad election results: Full list of Senators voted in to new Seanad". The Irish Times. Dublin. Archived from the original on 5 June 2021. Retrieved 5 June 2021.
- Hogan, Senan (26 May 2020). "New face to join Kildare Co Council following election of Mark Wall as Senator". KildareNow. Archived from the original on 7 June 2021. Retrieved 10 June 2020.
- "Taoiseach Micheál Martin announces his 11 Seanad nominees". TheJournal.ie. 27 June 2020. Archived from the original on 30 June 2020. Retrieved 5 June 2021.
- "Green Party picks Naas man to replace Senator Vincent P Martin on Kildare County Council". Leinster Leader. 14 August 2020. Archived from the original on 20 August 2020.