2021 Hastings Borough Council election
The 2021 Hastings Borough Council election took place on 6 May 2021 to elect members of Hastings Borough Council in England. This was on the same day as other local elections.
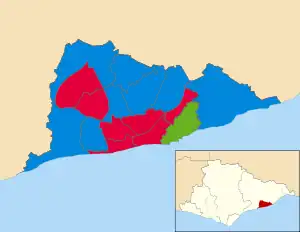
Map showing the results of the 2021 Hastings Borough Council election
Results summary
| 2021 Hastings Borough Council election[1] | ||||||||||
|---|---|---|---|---|---|---|---|---|---|---|
| Party | This election | Full council | This election | |||||||
| Seats | Net | Seats % | Other | Total | Total % | Votes | Votes % | +/− | ||
| Labour | 7 | 43.8 | 12 | 19 | 59.4 | 10,102 | 37.6 | -11.0 | ||
| Conservative | 8 | 50.0 | 4 | 12 | 37.5 | 10,920 | 40.7 | +9.4 | ||
| Green | 1 | 6.3 | 0 | 1 | 3.1 | 4,389 | 16.3 | +5.5 | ||
| Liberal Democrats | 0 | 0.0 | 0 | 0 | 0.0 | 1,439 | 5.4 | -3.1 | ||
Ward results
Ashdown
| Party | Candidate | Votes | % | ±% | |
|---|---|---|---|---|---|
| Conservative | Sorrell Marlow-Eastwood | 792 | 61.0 | +11.4 | |
| Labour | Liam Crowter | 282 | 21.7 | -10.2 | |
| Green | Christopher Saunders | 117 | 9.0 | +3.2 | |
| Liberal Democrats | Martin Griffiths | 108 | 8.3 | +3.5 | |
| Majority | 510 | 39.3 | |||
| Turnout | 1,299 | 32.2 | |||
| Conservative hold | Swing | ||||
Baird
| Party | Candidate | Votes | % | ±% | |
|---|---|---|---|---|---|
| Conservative | Rob Cooke | 575 | 48.5 | +14.8 | |
| Labour | Warren Davies | 503 | 42.4 | -12.8 | |
| Green | Daniel Hope | 73 | 6.2 | +1.3 | |
| Liberal Democrats | Robert Wakeford | 34 | 2.9 | +0.2 | |
| Majority | 72 | 6.1 | N/A | ||
| Turnout | 1,185 | 31.1 | |||
| Conservative gain from Labour | Swing | ||||
Braybrooke
| Party | Candidate | Votes | % | ±% | |
|---|---|---|---|---|---|
| Labour | Sabina Arthur | 739 | 45.8 | -15.3 | |
| Conservative | Shelley Bland | 499 | 31.0 | +9.4 | |
| Green | Sally Phillips | 292 | 18.1 | +6.8 | |
| Liberal Democrats | Lee Grant | 82 | 5.1 | -0.8 | |
| Majority | 240 | 14.8 | |||
| Turnout | 1,612 | 40.2 | |||
| Labour hold | Swing | ||||
Castle
| Party | Candidate | Votes | % | ±% | |
|---|---|---|---|---|---|
| Labour Co-op | Claire Carr | 733 | 43.8 | -1.4 | |
| Green | Andrea Needham | 418 | 25.0 | +13.9 | |
| Conservative | John Sydes | 372 | 22.2 | +11.9 | |
| Liberal Democrats | Katy Hunter-Burbridge | 150 | 9.0 | -24.9 | |
| Majority | 315 | 18.8 | |||
| Turnout | 1,673 | 34.0 | |||
| Labour Co-op hold | Swing | ||||
Central St Leonards
| Party | Candidate | Votes | % | ±% | |
|---|---|---|---|---|---|
| Labour | Trevor Webb | 704 | 43.7 | -7.9 | |
| Green | Marie Jones | 406 | 25.2 | +7.8 | |
| Conservative | Sue Clarke | 392 | 24.3 | +1.0 | |
| Liberal Democrats | Stephen Milton | 110 | 6.8 | +0.2 | |
| Majority | 298 | 18.5 | |||
| Turnout | 1,612 | 32.1 | |||
| Labour hold | Swing | ||||
Conquest
| Party | Candidate | Votes | % | ±% | |
|---|---|---|---|---|---|
| Conservative | Paul Foster | 851 | 61.3 | +9.3 | |
| Labour | Brian Bostock | 322 | 23.2 | -4.6 | |
| Liberal Democrats | Veronica Chessell | 113 | 8.1 | -1.7 | |
| Green | Gabriel Carlyle | 103 | 7.4 | +1.9 | |
| Majority | 529 | 38.1 | |||
| Turnout | 1,389 | 37.1 | |||
| Conservative hold | Swing | ||||
Gensing
| Party | Candidate | Votes | % | ±% | |
|---|---|---|---|---|---|
| Labour | Heather Bishop | 740 | 45.8 | -11.5 | |
| Green | Kenneth Davis | 408 | 25.3 | +13.8 | |
| Conservative | John Waterfall | 369 | 22.8 | +4.5 | |
| Liberal Democrats | Susan Stoodley | 98 | 6.1 | +0.9 | |
| Majority | 332 | 20.5 | |||
| Turnout | 1,615 | 35.0 | |||
| Labour hold | Swing | ||||
Hollington
| Party | Candidate | Votes | % | ±% | |
|---|---|---|---|---|---|
| Labour | Maya Evans | 560 | 53.6 | -4.0 | |
| Conservative | Terry Fawthrop | 381 | 36.5 | +7.3 | |
| Green | Beccy McCray | 71 | 6.8 | +1.1 | |
| Liberal Democrats | Anne Gallop | 33 | 3.2 | -0.8 | |
| Majority | 179 | 17.1 | |||
| Turnout | 1,045 | 27.4 | |||
| Labour hold | Swing | ||||
Maze Hill
| Party | Candidate | Votes | % | ±% | |
|---|---|---|---|---|---|
| Conservative | Graeme Williams | 781 | 51.7 | +3.5 | |
| Labour | Steve Thorpe | 422 | 27.9 | -4.0 | |
| Green | Samuel Hefferman | 232 | 15.4 | +5.4 | |
| Liberal Democrats | Jonathon Stoodley | 75 | 5.0 | -3.7 | |
| Majority | 359 | 23.8 | |||
| Turnout | 1,510 | 39.8 | |||
| Conservative hold | Swing | ||||
Old Hastings
| Party | Candidate | Votes | % | ±% | |
|---|---|---|---|---|---|
| Green | Julia Hilton | 1,032 | 52.4 | +15.7 | |
| Labour | Anna Sabin | 500 | 25.4 | -12.8 | |
| Conservative | Stuart Murphy | 399 | 20.3 | -1.8 | |
| Liberal Democrats | Gene Saunders | 38 | 1.9 | New | |
| Majority | 532 | 27.0 | N/A | ||
| Turnout | 1,969 | 48.9 | |||
| Green gain from Labour | Swing | ||||
Ore
| Party | Candidate | Votes | % | ±% | |
|---|---|---|---|---|---|
| Conservative | Alan Hay | 573 | 44.5 | +5.6 | |
| Labour | Anime Abdallah | 471 | 36.6 | -8.6 | |
| Green | Gary Rolfe | 205 | 15.9 | +9.2 | |
| Liberal Democrats | Jon Smalldon | 38 | 3.0 | -0.6 | |
| Majority | 102 | 7.9 | N/A | ||
| Turnout | 1,287 | 32.9 | |||
| Conservative gain from Labour | Swing | ||||
Silverhill
| Party | Candidate | Votes | % | ±% | |
|---|---|---|---|---|---|
| Conservative | Lucian Fernando | 682 | 43.2 | +6.4 | |
| Labour | Margi O'Callaghan | 612 | 38.7 | -6.8 | |
| Green | Dave Carey-Stuart | 201 | 12.7 | +5.7 | |
| Liberal Democrats | Terry Keen | 85 | 5.4 | +0.8 | |
| Majority | 70 | 4.5 | N/A | ||
| Turnout | 1,580 | 37.7 | |||
| Conservative gain from Labour | Swing | ||||
St Helens
| Party | Candidate | Votes | % | ±% | |
|---|---|---|---|---|---|
| Conservative | Peter Pragnell | 889 | 49.7 | +10.7 | |
| Labour | Antonia Berelson | 600 | 33.5 | -6.0 | |
| Green | Lucy Brennan | 199 | 11.1 | +4.0 | |
| Liberal Democrats | Bob Lloyd | 102 | 5.7 | -2.5 | |
| Majority | 289 | 16.2 | N/A | ||
| Turnout | 1,790 | 46.1 | |||
| Conservative gain from Labour | Swing | ||||
Tressell
| Party | Candidate | Votes | % | ±% | |
|---|---|---|---|---|---|
| Labour | Ali Roark | 455 | 45.0 | -11.7 | |
| Conservative | Fiona Archbold | 317 | 31.3 | +11.7 | |
| Green | Holly Rose | 196 | 19.4 | +7.7 | |
| Liberal Democrats | Jim Deasley | 44 | 4.3 | -1.9 | |
| Majority | 138 | 13.7 | |||
| Turnout | 1,012 | 27.4 | |||
| Labour hold | Swing | ||||
West St Leonards
| Party | Candidate | Votes | % | ±% | |
|---|---|---|---|---|---|
| Conservative | Karl Beaney | 661 | 56.7 | +18.5 | |
| Labour | John Cannan | 279 | 23.9 | -10.0 | |
| Green | Jane Packman | 119 | 10.2 | +6.1 | |
| Liberal Democrats | Stewart Rayment | 107 | 9.2 | -12.1 | |
| Majority | 382 | 32.8 | |||
| Turnout | 1,166 | 32.4 | |||
| Conservative hold | Swing | ||||
Wishing Tree
| Party | Candidate | Votes | % | ±% | |
|---|---|---|---|---|---|
| Labour | Alan Roberts | 608 | 46.0 | -8.6 | |
| Conservative | Martin Clarke | 540 | 40.8 | +14.3 | |
| Green | Christine Saunders | 112 | 8.5 | +2.4 | |
| Liberal Democrats | Emlyn Jones | 63 | 4.8 | -1.7 | |
| Majority | 68 | 5.2 | |||
| Turnout | 1,323 | 30.7 | |||
| Labour hold | Swing | ||||
References
- Council, Hastings Borough (6 May 2021). "Election results by party, 6 May 2021". hastings.moderngov.co.uk.
| East Sussex County Council | |
|---|---|
| Brighton and Hove City Council | |
| Eastbourne Borough Council | |
| Hastings Borough Council | |
| Lewes District Council | |
| Rother District Council | |
| Wealden District Council | |
| Brighton Borough Council | |
| Hove Borough Council |
|
| |
This article is issued from Wikipedia. The text is licensed under Creative Commons - Attribution - Sharealike. Additional terms may apply for the media files.