2022 Fife Council election
Elections to Fife Council took place on 5 May 2022, the same day as the other Scottish local government elections. The election will use the 22 wards created as a result of the Local Government Commission for Scotland's 5th review which was published in September 2016,[1] with each ward electing three or four councillors using the single transferable vote system form of proportional representation, with 75 councillors elected.
| |||||||||||||||||||||||||||||||||||||||||||||||||||||||||||||||||
All 75 seats to Fife Council 38 seats needed for a majority | |||||||||||||||||||||||||||||||||||||||||||||||||||||||||||||||||
|---|---|---|---|---|---|---|---|---|---|---|---|---|---|---|---|---|---|---|---|---|---|---|---|---|---|---|---|---|---|---|---|---|---|---|---|---|---|---|---|---|---|---|---|---|---|---|---|---|---|---|---|---|---|---|---|---|---|---|---|---|---|---|---|---|---|
| |||||||||||||||||||||||||||||||||||||||||||||||||||||||||||||||||
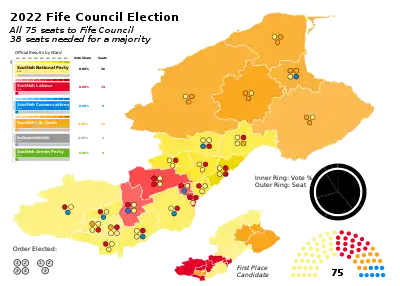 2022 Fife Council election results map | |||||||||||||||||||||||||||||||||||||||||||||||||||||||||||||||||
| |||||||||||||||||||||||||||||||||||||||||||||||||||||||||||||||||
Election results
| Party | Seats | Gains | Losses | Net gain/loss | Seats % | Votes % | Votes | +/− | |||
|---|---|---|---|---|---|---|---|---|---|---|---|
| SNP | 34 | 5 | 0 | 35.3% | 36.9% | 46,873 | +3.1% | ||||
| Labour | 20 | 0 | 4 | 26.7% | 24.5% | 31,102 | +0.6% | ||||
| Liberal Democrats | 13 | 6 | 0 | 17.3% | 16.8% | 21,320 | +3.7% | ||||
| Conservative | 8 | 0 | 7 | 10.7% | 14.4% | 26,558 | -6.7% | ||||
| Scottish Green | 0 | 0 | 0 | 0 | 4.6% | 5,854 | +1.2% | ||||
| Independent | 0 | 0 | 2 | 0 | 1.1% | 1,429 | -3.3% | ||||
| Alba | 0 | 0 | 0 | 0 | 0.8% | 1,059 | New | ||||
| Scottish Family | 0 | 0 | 0 | 0 | 0.8% | 1,035 | New | ||||
| TUSC | 0 | 0 | 0 | 0 | 0.04% | 53 | New | ||||
| UKIP | 0 | 0 | 0 | 0 | 0.04% | 45 | -0.01% | ||||
| Sovereignty | 0 | 0 | 0 | 0 | 0.03% | 41 | New | ||||
| ISP | 0 | 0 | 0 | 0 | 0.03% | 33 | New | ||||
| Libertarian | 0 | 0 | 0 | 0 | 0.02% | 23 | +0.01% | ||||
| Electorate: 289,315 Valid: 127,154 Spoilt: 2,158 Quota: {{{quota}}} Turnout: 44% | |||||||||||
Note: "Votes" are the first preference votes. The net gain/loss and percentage changes relate to the result of the previous Scottish local elections on 4 May 2017. This may differ from other published sources showing gain/loss relative to seats held at dissolution of Scotland's councils.
| Ward | % |
Cllrs |
% |
Cllrs |
% |
Cllrs |
% |
Cllrs |
% |
Cllrs |
% |
Cllrs |
Total Cllrs |
|---|---|---|---|---|---|---|---|---|---|---|---|---|---|
| SNP | Lab | Conservative | Green | Lib Dem | Others | ||||||||
| West Fife and Coastal Villages | 39.1 | 1 | 32.5 | 1 | 17.1 | 1 | 4.1 | 0 | 6.7 | 0 | 3.8 | 0 | 3 |
| Dunfermline North | 36.2 | 1 | 28.5 | 1 | 17.4 | 1 | 5.9 | 0 | 6.4 | 0 | 2.3 | 0 | 3 |
| Dunfermline Central | 33.4 | 2 | 24.6 | 1 | 9.4 | 0 | 6.0 | 0 | 24.7 | 1 | 1.9 | 0 | 4 |
| Dunfermline South | 33.5 | 2 | 23.2 | 1 | 10.6 | 0 | 3.6 | 0 | 19.5 | 1 | 2.6 | 0 | 4 |
| Rosyth | 39.4 | 2 | 26.3 | 1 | 16.8 | 0 | 5.2 | 0 | 6.5 | 0 | 5.9 | 0 | 3 |
| Inverkeithing and Dalgety Bay | 38.8 | 2 | 18.5 | 1 | 29.2 | 1 | 8.2 | 0 | 4.0 | 0 | 1.2 | 0 | 3 |
| Cowdenbeath | 36.6 | 2 | 38.0 | 1 | 28.9 | 1 | 2.5 | 0 | 1.4 | 0 | 2.5 | 0 | 4 |
| Lochgelly, Cardenden and Benarty | 43.2 | 2 | 43.6 | 2 | 7.7 | 0 | 2.3 | 0 | 1.8 | 0 | 1.5 | 0 | 4 |
| Burntisland, Kinghorn and Western Kirkcaldy | 37.9 | 1 | 29.4 | 1 | 21.0 | 1 | 5.7 | 0 | 3.5 | 0 | 2.6 | 0 | 3 |
| Kirkcaldy North | 38.9 | 1 | 39.0 | 1 | 15.2 | 1 | 3.9 | 0 | 2.9 | 0 | 3 | ||
| Kirkcaldy Central | 37.9 | 1 | 41.6 | 2 | 13.6 | 1 | 4.4 | 0 | 2.5 | 0 | 3 | ||
| Kirkcaldy East | 40.3 | 2 | 39.7 | 1 | 11.7 | 0 | 4.3 | 0 | 2.9 | 0 | 1.0 | 0 | 3 |
| Glenrothes West and Kinglassie | 49.5 | 2 | 32.5 | 1 | 11.6 | 0 | 3.8 | 0 | 2.6 | 0 | 3 | ||
| Glenrothes North, Leslie and Markinch | 44.6 | 2 | 26.4 | 1 | 18.6 | 1 | 3.6 | 0 | 5.1 | 0 | 1.7 | 0 | 4 |
| Glenrothes Central and Thornton | 48.7 | 2 | 27.9 | 1 | 12.1 | 0 | 3.7 | 0 | 3.9 | 0 | 3.7 | 0 | 3 |
| Howe of Fife and Tay Coast | 31.0 | 1 | 14.6 | 0 | 7.6 | 0 | 44.9 | 2 | 1.9 | 0 | 3 | ||
| Tay Bridgehead | 28.4 | 1 | 4.3 | 0 | 8.4 | 0 | 6.3 | 0 | 48.2 | 2 | 4.4 | 0 | 3 |
| St Andrews | 22.2 | 1 | 8.4 | 0 | 14.7 | 1 | 6.6 | 0 | 48.1 | 2 | 4 | ||
| East Neuk and Landward | 25.1 | 1 | 2.6 | 0 | 13.2 | 0 | 5.2 | 0 | 45.8 | 2 | 9.0 | 0 | 3 |
| Cupar | 25.8 | 1 | 3.4 | 0 | 11.5 | 0 | 4.9 | 0 | 52.4 | 2 | 2.1 | 0 | 3 |
| Leven, Kennoway and Largo | 42.4 | 2 | 24.7 | 1 | 10.4 | 0 | 2.4 | 0 | 19.3 | 1 | 2.1 | 0 | 4 |
| Buckhaven, Methil and Wemyss Villages | 47.4 | 2 | 40.8 | 2 | 6.5 | 0 | 2.2 | 0 | 2.3 | 0 | 1.3 | 0 | 4 |
Ward results
West Fife and Coastal Villages
- 2017: 1xLab; 1xCon; 1xSNP
| Party | Candidate | FPv% | Count | ||||||||||
|---|---|---|---|---|---|---|---|---|---|---|---|---|---|
| 1 | 2 | 3 | 4 | 5 | 6 | 7 | 8 | 9 | 10 | ||||
| Labour | Graeme Downie | 24.9% | 1,482 | 1,487 | 1,492 | ||||||||
| SNP | Sam Steele | 21.8% | 1,301 | 1,307 | 1,330 | 1,330 | 1,336 | 1,417 | 1,448 | 1,509.1 | |||
| Conservative | Conner Young | 17.1% | 1,017 | 1,020 | 1,020 | 1,020 | 1,056 | 1,062 | 1,179 | 1,286.2 | 1,286.2 | 1,425.4 | |
| SNP | Katie Strang | 14.0% | 837 | 843 | 860 | 860 | 865 | 933 | 961 | 1,012 | 1,027.9 | ||
| Labour | Jacqueline McKenna | 7.7% | 458 | 458 | 461 | 461.8 | 471.8 | 501.8 | 640.8 | ||||
| Liberal Democrats | Jo Cockburn | 6.7% | 399 | 402 | 406 | 406.1 | 418 | 460.1 | |||||
| Scottish Green | Craig McCutcheon | 4.1% | 246 | 251 | 264 | 264 | 273 | ||||||
| Scottish Family | Danny Smith | 1.6% | 94 | 97 | 107 | 107 | |||||||
| Alba | William Gavin | 1.4% | 83 | 92 | |||||||||
| Independent | Martin Keatings | 0.8% | 46 | ||||||||||
| Electorate: 13,553 Valid: 5,963 Spoilt: 129 Quota: 1,491 Turnout: 44.9% | |||||||||||||
Dunfermline North
- 2017: 1xCon; 1xSNP; 1xLab
- 2022: 1xLab; 1xSNP; 1xCon;
- 2017-2022 Change: No change
| Party | Candidate | FPv% | Count | ||||||||
|---|---|---|---|---|---|---|---|---|---|---|---|
| 1 | 2 | 3 | 4 | 5 | 6 | 7 | 8 | ||||
| Labour | Gordon Pryde | 28.5% | 1,627 | ||||||||
| SNP | Auxi Barrera | 23.6% | 1,350 | 1,360.5 | 1,365.6 | 1,368.2 | 1,509.4 | ||||
| Conservative | Gavin Ellis (incumbent) | 17.8% | 1,017 | 1,049 | 1,059.1 | 1,084.4 | 1,107.1 | 1,108.4 | 1,365.4 | 1,474.8 | |
| SNP | Craig McIvor | 15.4% | 882 | 896.3 | 897.8 | 903.5 | 973.6 | 1,042.6 | 1,120.4 | ||
| Liberal Democrats | Caroline McIlwraith | 6.4% | 363 | 421.5 | 432.4 | 448.6 | 535.2 | 538.8 | |||
| Scottish Green | Mags Hall | 5.9% | 338 | 354.1 | 372.5 | 387.7 | |||||
| Scottish Family | Karen Smith | 1.4% | 80 | 86.6 | 93.2 | ||||||
| TUSC | Dave Edler | 0.9% | 53 | 66.2 | |||||||
| Electorate: 12,503 Valid: 5,710 Spoilt: 79 Quota: 1,428 Turnout: 5,789 (46.3%) | |||||||||||
Dunfermline Central
- 2017: 2xLab; 1xCon; 1xSNP
| Party | Candidate | FPv% | Count | ||||||||
|---|---|---|---|---|---|---|---|---|---|---|---|
| 1 | 2 | 3 | 4 | 5 | 6 | 7 | 8 | ||||
| Liberal Democrats | Aude Boubaker-Calder | 24.7% | 1,970 | ||||||||
| SNP | Derek Glen (incumbent) | 20.1% | 1,603 | ||||||||
| SNP | Jean Hall Muir (incumbent) | 13.3% | 1,057 | 1,075.7 | 1,081.9 | 1,081.9 | 1,119.5 | 1,388.1 | 1,405.7 | 1,486.2 | |
| Labour | Jim Leishman (incumbent) | 13.2% | 1,055 | 1,139.5 | 1,139.9 | 1,155.7 | 1,171.2 | 1,243.2 | 1,473.3 | 2,367.3 | |
| Labour | Garry Haldane (incumbent) | 11.4% | 909 | 977.9 | 978.2 | 983.4 | 992.4 | 1,056.9 | 1,216.1 | ||
| Conservative | Malcolm Macaulay | 9.4% | 752 | 841.8 | 841.9 | 856.1 | 861.3 | 878.9 | |||
| Scottish Green | Lewis Campbell | 6.0% | 478 | 519.9 | 520.5 | 526.9 | 538.1 | ||||
| Alba | Leanne Tervit | 1.2% | 94 | 95.1 | 95.2 | 101 | |||||
| Scottish Family | Gary Pratt | 0.7% | 53 | 56.6 | 56.7 | ||||||
| Electorate: 16,854 Valid: 7,971 Spoilt: 100 Quota: 1,595 Turnout: 47.9% | |||||||||||
Dunfermline South
- 2017: 1xCon; 1xSNP; 1xLib Dem; 1xLab
| Party | Candidate | FPv% | Count | |||||||||
|---|---|---|---|---|---|---|---|---|---|---|---|---|
| 1 | 2 | 3 | 4 | 5 | 6 | 7 | 8 | 9 | ||||
| Liberal Democrats | James Calder (incumbent) | 19.5% | 1,523 | 1,528 | 1,542 | 1,586 | ||||||
| Labour | Cara Hilton | 19.3% | 1,505 | 1,508 | 1,513 | 1,550 | 1,558.5 | 1,794.1 | ||||
| SNP | Lynn Ballantyne Wardlaw | 16.9% | 1,316 | 1,340 | 1,344 | 1,408 | 1,410 | 1,425.1 | 1,446.9 | 1,543.7 | 1,601.9 | |
| SNP | Naz Anis-Miah | 16.6% | 1,292 | 1,308 | 1,314 | 1,382 | 1,383.4 | 1,390.5 | 1,409.4 | 1,534.1 | 1,568.9 | |
| Conservative | David Ross (incumbent) | 10.6% | 825 | 826 | 846 | 855 | 860.6 | 878.9 | 917.7 | 1,008 | ||
| Independent | Martin Willcocks | 6.9% | 541 | 564 | 580 | 611 | 613.4 | 619.5 | 641.8 | |||
| Labour | Ross Paterson (incumbent) | 3.9% | 304 | 308 | 846 | 327 | 328.5 | |||||
| Scottish Green | Tom Freeman | 3.6% | 279 | 288 | 295 | |||||||
| Scottish Family | Paul Lynch | 1.3% | 105 | 112 | ||||||||
| Alba | Rob Thompson | 1.3% | 103 | |||||||||
| Electorate: 17,563 Valid: 7,793 Spoilt: 92 Quota: 1,559 Turnout: 44.9% | ||||||||||||
Rosyth
- 2017: 1xCon; 1xSNP; 1xLab
| Party | Candidate | FPv% | Count | |||||||||
|---|---|---|---|---|---|---|---|---|---|---|---|---|
| 1 | 2 | 3 | 4 | 5 | 6 | 7 | 8 | 9 | ||||
| Labour | Andrew Verrecchia (incumbent) | 26.3% | 1,274 | |||||||||
| SNP | Brian Goodall | 22.4% | 1,085 | 1,088.4 | 1,089.3 | 1,092.5 | 1,139.7 | 1,232.2 | ||||
| SNP | Andy Jackson | 17.0% | 826 | 829.7 | 831 | 833 | 883.3 | 955.9 | 973 | 1,032.1 | 1,120.2 | |
| Conservative | Grant Thomson | 16.8% | 813 | 824.5 | 830.7 | 854 | 871 | 884.2 | 884.5 | 1,000.7 | ||
| Liberal Democrats | Teresa Little | 6.5% | 316 | 333.8 | 336 | 347.4 | 366 | 422.2 | 422.7 | |||
| Scottish Green | Fiona McOwan | 5.2% | 250 | 254.9 | 259 | 268.2 | 290.3 | |||||
| Alba | Stephen Lynas | 4.0% | 192 | 194 | 196 | 203.2 | ||||||
| Scottish Family | Alastair Macintyre | 1.4% | 69 | 70.9 | 77 | |||||||
| Libertarian | George Morton | 0.5% | 23 | 23.7 | ||||||||
| Electorate: 11,736 Valid: 4,848 Spoilt: 82 Quota: 1,213 Turnout: 42% | ||||||||||||
Inverkeithing and Dalgety Bay
- 2017: 2xSNP; 1xCon; 1xLab
| Party | Candidate | FPv% | Count | ||||||||
|---|---|---|---|---|---|---|---|---|---|---|---|
| 1 | 2 | 3 | 4 | 5 | 6 | 7 | 8 | ||||
| SNP | David Barratt (incumbent) | 28.4% | 2,187 | ||||||||
| Labour | Patrick Browne | 18.5% | 1,426 | 1,467.9 | 1,471.9 | 1,612 | |||||
| Conservative | Dave Dempsey (incumbent) | 17.6% | 1,355 | 1,380.7 | 1,401.6 | 1,446.6 | 1,456.7 | 1,494.3 | 1,519.2 | 2,430.5 | |
| Conservative | Dave Coleman (incumbent) | 11.6% | 897 | 908.2 | 923.2 | 939.8 | 950.6 | 990.6 | 1,014.9 | ||
| SNP | Sarah Neal | 10.4% | 802 | 1,262.2 | 1,273.1 | 1,296.4 | 1,302.9 | 1,763.6 | |||
| Scottish Green | Ryan Blackadder | 8.2% | 634 | 709 | 728.6 | 791.4 | 807.4 | ||||
| Liberal Democrats | Callum Hawthorne | 4.0% | 309 | 316.7 | 329.7 | ||||||
| Scottish Family | Sarah Davis | 1.2% | 93 | 95.4 | |||||||
| Electorate: 14,541 Valid: 7,703 Spoilt: 110 Quota: 1,541 Turnout: 53.7% | |||||||||||
Cowdenbeath
- 2017: 2xLab; 1xSNP; 1xCon
| Party | Candidate | FPv% | Count | |||||||||
|---|---|---|---|---|---|---|---|---|---|---|---|---|
| 1 | 2 | 3 | 4 | 5 | 6 | 7 | 8 | 9 | ||||
| Labour | Alex Campbell (incumbent) | 30.6% | 2,028 | |||||||||
| SNP | Alie Bain (incumbent) | 28.9% | 1,916 | |||||||||
| Conservative | Darren Watt (incumbent) | 18.9% | 1,256 | 1,309.9 | 1,320.1 | 1,346.1 | ||||||
| SNP | Bailey-Lee Robb | 7.7% | 513 | 543.8 | 1,001.8 | 1,009.6 | 1,010.8 | 1,047.5 | 1,054.9 | 1,162.6 | 1,381.2 | |
| Labour | Gary Guichan (incumbent) | 7.4% | 489 | 992.3 | 1,020.6 | 1,034.3 | 1,040.6 | 1,055.6 | 1,094.5 | 1,158.4 | ||
| Scottish Green | Alyssa Lee | 2.5% | 169 | 179.7 | 207.4 | 217.7 | 218.4 | 237.3 | 260.3 | |||
| Liberal Democrats | Peter Venturi | 1.4% | 96 | 106.7 | 108.6 | 113.2 | 116.6 | 120.3 | ||||
| Alba | Jacqueline Bijster | 1.3% | 85 | 92.3 | 110.1 | 115.7 | 116 | |||||
| Scottish Family | Helen Grieg | 1.2% | 80 | 90 | 96.8 | |||||||
| Electorate: 17,132 Valid: 6,632 Spoilt: 182 Quota: 1,327 Turnout: 39.8% | ||||||||||||
Lochgelly, Cardenden and Benarty
- 2017: 2xLab; 2xSNP
| Party | Candidate | FPv% | Count | |||
|---|---|---|---|---|---|---|
| 1 | 2 | 3 | ||||
| Labour | Mary Bain-Lockhart (incumbent) | 24.9% | 1,230 | |||
| SNP | Rosemary Liewald (incumbent) | 23.7% | 1,173 | |||
| SNP | Lea McLelland (incumbent) | 19.5% | 965 | 983.3 | 1,143.4 | |
| Labour | Linda Erskine (incumbent) | 18.7% | 925 | 1,115.2 | ||
| Conservative | Margaret Fairgrieve | 7.7% | 379 | 385 | 385.8 | |
| Scottish Green | Danny Oswald | 2.3% | 115 | 117.1 | 125.5 | |
| Liberal Democrats | Russel McPhate | 1.8% | 88 | 94.2 | 95.3 | |
| Scottish Family | Anil Alexander | 1.5% | 72 | 74 | 75.2 | |
| Electorate: 14,192 Valid: 4,947 Spoilt: 125 Quota: 990 Turnout: 35.7% | ||||||
Burntisland, Kinghorn and Western Kirkcaldy
- 2017: 1xCon; 1xSNP; 1xLab
| Party | Candidate | FPv% | Count | |||||||||
|---|---|---|---|---|---|---|---|---|---|---|---|---|
| 1 | 2 | 3 | 4 | 5 | 6 | 7 | 8 | 9 | ||||
| SNP | Lesley Backhouse (incumbent) | 29.5% | 1,735 | |||||||||
| Labour | Julie MacDougall | 29.4% | 1,730 | |||||||||
| Conservative | Kathleen Leslie (incumbent) | 21.0% | 1,239 | 1,245.5 | 1,296.3 | 1,297.4 | 1,319.2 | 1,326.6 | 1,416.9 | 1,442.6 | 1,669.8 | |
| SNP | Olaf Stando | 8.4% | 493 | 677.7 | 693.4 | 699.3 | 700.4 | 742.9 | 771.7 | 1,018.2 | ||
| Scottish Green | Claire Luxford | 5.7% | 336 | 370.9 | 398.5 | 409.4 | 412.2 | 427.4 | 497.5 | |||
| Liberal Democrats | Anne O'Brien | 3.5% | 209 | 215 | 293.6 | 295.4 | 301.1 | 309 | ||||
| Alba | Colin Fraser | 1.3% | 76 | 82.3 | 85.6 | 97 | 102.9 | |||||
| Scottish Family | Garry Downie | 0.7% | 40 | 40.8 | 45.7 | 49.7 | ||||||
| ISP | Andrew Bentley-Steed | 0.6% | 33 | 40.4 | 42.5 | |||||||
| Electorate: 11,716 Valid: 5,891 Spoilt: 69 Quota: 1,473 Turnout: 50.9% | ||||||||||||
Kirkcaldy North
- 2017: 2xLab; 1xSNP
| Party | Candidate | FPv% | Count | ||||||||
|---|---|---|---|---|---|---|---|---|---|---|---|
| 1 | 2 | 3 | 4 | 5 | 6 | 7 | 8 | ||||
| Labour | David Ross (incumbent) | 34.9% | 1,804 | ||||||||
| SNP | Carol Lindsay (incumbent) | 32.1% | 1,661 | ||||||||
| Conservative | James Leslie | 15.2% | 789 | 812.5 | 813.8 | 828.8 | 838.8 | 855.1 | 1,029.9 | 1,187.9 | |
| SNP | Sally Walsh | 6.8% | 352 | 360.2 | 669.4 | 672.9 | 710.3 | 821.3 | 936.4 | ||
| Labour | Ryan Smart (incumbent in Buckhaven, Methil and Wemyss Villages) | 4.1% | 213 | 641.3 | 652.4 | 661.1 | 672.6 | 731 | |||
| Scottish Green | Michael Collie | 3.9% | 204 | 212.5 | 226.9 | 231.2 | 254.1 | ||||
| Alba | Craig Dempsey | 2.0% | 101 | 101.8 | 108.7 | 112 | |||||
| UKIP | Gerald Haddrell | 0.9% | 45 | 46.1 | 46.6 | ||||||
| Electorate: 12,519 Valid: 5,169 Spoilt: 100 Quota: 1,293 Turnout: 42.1% | |||||||||||
Kirkcaldy Central
- 2017: 2xLab; 1xSNP
| Party | Candidate | FPv% | Count | |||||||
|---|---|---|---|---|---|---|---|---|---|---|
| 1 | 2 | 3 | 4 | 5 | 6 | 7 | ||||
| SNP | Blair Allan | 22.0% | 1,005 | 1,010 | 1,047 | 1,064 | 1,069.3 | 1,071 | 1,800.3 | |
| Labour | Alistair Cameron (incumbent) | 21.6% | 984 | 1,004 | 1,030 | 1,186 | ||||
| Labour | Judy Hamilton (incumbent) | 20.0% | 915 | 938 | 977 | 1,158 | ||||
| SNP | Zoe Hisbent (incumbent) | 15.8% | 723 | 725 | 800 | 809 | 813.1 | 815.6 | ||
| Conservative | Graham Duncan | 13.6% | 619 | 642 | 652 | |||||
| Scottish Green | Tao Macleod | 4.4% | 203 | 224 | ||||||
| Liberal Democrats | Karen Utting | 2.5% | 115 | |||||||
| Electorate: 11,394 Valid: 4,564 Spoilt: 106 Quota: 1,142 Turnout: 41% | ||||||||||
Kirkcaldy East
- 2017: 1xLab; 1xSNP; 1xCon
| Party | Candidate | FPv% | Count | ||||||||
|---|---|---|---|---|---|---|---|---|---|---|---|
| 1 | 2 | 3 | 4 | 5 | 6 | 7 | 8 | ||||
| Labour | Ian Cameron (incumbent) | 32.9% | 1,313 | ||||||||
| SNP | Rod Cavanagh (incumbent) | 23.1% | 924 | 944.1 | 950.1 | 955.1 | 1,011.3 | ||||
| SNP | Nicola Patrick | 17.2% | 687 | 693.7 | 696.7 | 702.2 | 772.1 | 782.6 | 793.6 | 931.9 | |
| Conservative | Richard Watt (incumbent) | 11.7% | 469 | 475.9 | 480.2 | 516.8 | 524.6 | 524.6 | |||
| Labour | George Macdonald | 6.8% | 273 | 510.2 | 512.7 | 539.3 | 578.4 | 579.1 | 774.9 | ||
| Scottish Green | David Hansen | 4.3% | 172 | 180.4 | 186.4 | 211.3 | |||||
| Liberal Democrats | Wink Thompson | 2.9% | 116 | 123.2 | 133.9 | ||||||
| Sovereignty | Walter Neilson | 1.0% | 41 | 43.4 | |||||||
| Electorate: 11,052 Valid: 3,995 Spoilt: 130 Quota: 999 Turnout: 37.3% | |||||||||||
Glenrothes West and Kinglassie
- 2017: 2xSNP; 1xLab
| Party | Candidate | FPv% | Count | |||||
|---|---|---|---|---|---|---|---|---|
| 1 | 2 | 3 | 4 | 5 | ||||
| SNP | Julie Ford (incumbent) | 37.9% | 1,740 | |||||
| Labour | Altany Craik (incumbent) | 32.5% | 1,491 | |||||
| SNP | Craig Walker (incumbent) | 11.6% | 533 | 1,059.7 | 1,104.3 | 1,138.2 | 1,186.9 | |
| Conservative | David Croll | 11.6% | 531 | 537.5 | 613.6 | 639.7 | 745 | |
| Liberal Democrats | Keith Smith | 3.8% | 174 | 182.2 | 275.1 | 327.6 | ||
| Independent | Ian Robertson | 2.6% | 119 | 128.9 | 163.6 | |||
| Electorate: 12,068 Valid: 4,588 Spoilt: 103 Quota: 1,148 Turnout: 38.9% | ||||||||
Glenrothes North, Leslie and Markinch
- 2017: 2xSNP; 1xCon; 1xLab
| Party | Candidate | FPv% | Count | ||||||||
|---|---|---|---|---|---|---|---|---|---|---|---|
| 1 | 2 | 3 | 4 | 5 | 6 | 7 | 8 | ||||
| SNP | John Beare (incumbent) | 27.7% | 1,730 | ||||||||
| Conservative | Peter Gulline | 18.6% | 1,161 | 1,166 | 1,168.4 | 1,198.3 | 1,203.9 | 1,296.8 | |||
| SNP | Lynn Mowatt | 16.9% | 1,059 | 1,433.4 | |||||||
| Labour | Jan Wincott (incumbent) | 15.0% | 940 | 951.9 | 973 | 984.4 | 1,026.1 | 1,106.3 | 1,118.3 | 1,853.3 | |
| Labour | Afifa Khanam | 11.4% | 714 | 727 | 737.1 | 747.5 | 806.1 | 906.9 | 917 | ||
| Liberal Democrats | Frances Bennie | 5.1% | 318 | 329.3 | 338.4 | 351.2 | 422 | ||||
| Scottish Green | Bryce Goodall | 3.6% | 224 | 256.6 | 320.2 | 342.4 | |||||
| Scottish Family | George Carratt | 1.7% | 109 | 112.6 | 117.8 | ||||||
| Electorate: 14,432 Valid: 6,255 Spoilt: 116 Quota: 1,252 Turnout: 44.1% | |||||||||||
Glenrothes Central and Thornton
- 2017: 2xSNP; 1xLab
| Party | Candidate | FPv% | Count | ||||||
|---|---|---|---|---|---|---|---|---|---|
| 1 | 2 | 3 | 4 | 5 | 6 | ||||
| SNP | Ross Vettraino (incumbent) | 34.1% | 1,588 | ||||||
| Labour | Derek Noble (incumbent) | 27.9% | 1,299 | ||||||
| SNP | Daniel Wilson | 14.6% | 679 | 1,046.1 | 1,063.3 | 1,067.9 | 1,114.1 | 1,220.7 | |
| Conservative | Heather Gulline | 12.1% | 561 | 566.3 | 585.9 | 607.8 | 620.3 | 631.8 | |
| Liberal Democrats | Jane Kerr | 3.9% | 183 | 188.9 | 223.2 | 231.9 | 246.5 | 297.2 | |
| Scottish Green | Morven Ovenstone-Jones | 3.7% | 170 | 180.1 | 191.5 | 207.8 | 221.9 | ||
| Alba | Jim Bryce | 2.2% | 101 | 105.8 | 109 | 116.4 | |||
| Scottish Family | Steve Saunders | 1.5% | 71 | 73.9 | 80.2 | ||||
| Electorate: 12,021 Valid: 4,652 Spoilt: 90 Quota: 1,164 Turnout: 39.4% | |||||||||
Howe of Fife and Tay Coast
- 2017: 1xLib Dem; 1xCon; 1xSNP
- 2022: 2xLib Dem; 1xSNP
- 2017-2022 Change: -1 Con; +1 Lib Dem
| Party | Candidate | FPv% | Count | ||||||
|---|---|---|---|---|---|---|---|---|---|
| 1 | 2 | 3 | 4 | 5 | 6 | ||||
| SNP | David MacDiarmid (incumbent) | 31.0% | 1,871 | ||||||
| Liberal Democrats | Donald Lothian (incumbent) | 24.0% | 1,448 | 1,508.1 | |||||
| Liberal Democrats | Gary Holt | 20.9% | 1,261 | 1,280 | 1,280.1 | 1,290.5 | 1,306.4 | 1,594.9 | |
| Conservative | Andy Heer (incumbent) | 14.6% | 880 | 888.7 | 888.7 | 905.9 | 914.7 | 944.2 | |
| Scottish Green | Malcolm Jack | 7.6% | 458 | 627.8 | 627.8 | 637.5 | 679.4 | ||
| Alba | Jackie Anderson | 1.0% | 58 | 91.6 | 91.6 | 95.8 | |||
| Scottish Family | Alan Brown | 0.9% | 54 | 57.9 | 57.9 | ||||
| Electorate: 11,317 Valid: 6,030 Spoilt: 74 Quota: 1,508 Turnout: 53.9% | |||||||||
Tay Bridgehead
- 2017: 2xLib Dem; 1xSNP
| Party | Candidate | FPv% | Count | ||||||
|---|---|---|---|---|---|---|---|---|---|
| 1 | 2 | 3 | 4 | 5 | 6 | ||||
| SNP | Louise Kennedy-Dalby | 28.4% | 1,783 | ||||||
| Liberal Democrats | Jonny Tepp (incumbent) | 26.9% | 1,692 | ||||||
| Liberal Democrats | Allan Knox | 21.2% | 1,333 | 1,362 | 1,461.3 | 1,470.7 | 1,531.8 | 1,654.4 | |
| Conservative | Keith Barton | 8.4% | 527 | 528.8 | 534 | 535 | 559.1 | 582.7 | |
| Scottish Green | Colin Palmer | 6.3% | 397 | 500.6 | 506.8 | 553.1 | 588.3 | 676.1 | |
| Labour | Philip Thompson | 4.3% | 271 | 287.8 | 292.7 | 305.4 | 341.6 | ||
| Independent | Sean Elder | 2.8% | 177 | 184.1 | 186 | 214.3 | |||
| Alba | Steven Simpson | 1.6% | 100 | 120 | 120.3 | ||||
| Electorate: 11,925 Valid: 6,280 Spoilt: 56 Quota: 1,571 Turnout: 53.1% | |||||||||
St. Andrews
- 2017: 1xLib Dem; 1xCon; 1xLab; 1xSNP
- 2022: 2xLib Dem; 1xCon; 1xSNP
- 2017-2022 Change: +1 Lib Dem; -1 Lab
| Party | Candidate | FPv% | Count | ||||||
|---|---|---|---|---|---|---|---|---|---|
| 1 | 2 | 3 | 4 | 5 | 6 | ||||
| Liberal Democrats | Jane Liston (incumbent) | 25.1% | 1,265 | ||||||
| Liberal Democrats | Al Clark | 23.0% | 1,161 | ||||||
| SNP | Ann Verner (incumbent) | 22.2% | 1,123 | ||||||
| Conservative | Robin Lawson | 14.7% | 742 | 800.9 | 841.6 | 844.4 | 860.9 | 1,120 | |
| Labour | Rosalind Garton | 8.4% | 422 | 493.4 | 535.8 | 554.3 | 842.2 | ||
| Scottish Green | Fergus Cook | 6.6% | 335 | 385.8 | 408 | 468.4 | |||
| Electorate: 12,106 Valid: 5,048 Spoilt: 37 Quota: 1,010 Turnout: 42% | |||||||||
East Neuk and Landward
- 2017: 1xCon; 1xSNP; 1xLib Dem
- 2022: 2xLib Dem; 1xSNP
- 2017-2022 Change: -1 Con; +1 Lib Dem
| Party | Candidate | FPv% | Count | |||||||
|---|---|---|---|---|---|---|---|---|---|---|
| 1 | 2 | 3 | 4 | 5 | 6 | 7 | ||||
| Liberal Democrats | Fiona Corps | 32.1% | 1,721 | |||||||
| SNP | Alycia Hayes | 25.1% | 1,345 | |||||||
| Conservative | Debbie MacCallum | 13.2% | 707 | 724.7 | 724.8 | 731 | 744.2 | 748.5 | 848 | |
| Liberal Democrats | Sean Dillon | 12.7% | 679 | 998.7 | 999.2 | 1,015.2 | 1,063 | 1,203.8 | 1,425 | |
| Independent | Linda Holt (incumbent) | 7.5% | 404 | 417.3 | 417.6 | 455.6 | 469.8 | 516.7 | ||
| Scottish Green | David Stutchfield | 5.2% | 281 | 291 | 293.5 | 303.8 | 339.6 | |||
| Labour | Stuart Irwin | 2.6% | 139 | 143.4 | 143.8 | 146 | ||||
| Independent | John Docherty (incumbent) | 1.5% | 80 | 84.6 | 84.9 | |||||
| Electorate: 10,467 Valid: 5,356 Spoilt: 58 Quota: 1,340 Turnout: 51.7% | ||||||||||
Cupar
- 2017: 1xLib Dem; 1xCon; 1xSNP
- 2022: 2xLib Dem; 1xSNP
- 2017-2022 Change: -1 Con; +1 Lib Dem
| Party | Candidate | FPv% | Count | ||||||
|---|---|---|---|---|---|---|---|---|---|
| 1 | 2 | 3 | 4 | 5 | 6 | ||||
| Liberal Democrats | Margaret Kennedy (incumbent) | 35.4% | 2,160 | ||||||
| SNP | Stefan Hoggan-Radu | 25.8% | 1,571 | ||||||
| Liberal Democrats | John Caffrey | 17.0% | 1,036 | 1,495 | 1,508.8 | 1,503.6 | 1,513.8 | 1,537.8 | |
| Conservative | Tony Miklinski (incumbent) | 11.5% | 698 | 766 | 766.5 | 770.1 | 774.4 | 790.8 | |
| Scottish Green | Robert Hugh-Jones | 4.9% | 296 | 327.2 | 351.4 | 361.1 | 371.9 | 277.4 | |
| Labour | Wendy Haynes | 3.4% | 206 | 234.9 | 238.8 | 242.4 | 245.8 | 250.8 | |
| Scottish Family | Sylvia Brown | 1.1% | 66 | 69.2 | 70 | 71 | 80.9 | ||
| Independent | Donald Adey | 0.5% | 33 | 37.1 | 37.7 | 51 | |||
| Independent | Gordon Pay | 0.5% | 29 | 32.8 | 47.2 | ||||
| Electorate: 11,439 Valid: 6,095 Spoilt: 56 Quota: 1,524 Turnout: 53.8% | |||||||||
Leven, Kennoway and Largo
- 2017: 2xSNP; 1xCon; 1xLab
| Party | Candidate | FPv% | Count | |||
|---|---|---|---|---|---|---|
| 1 | 2 | 3 | ||||
| SNP | David Alexander (incumbent) | 31.7% | 2,077 | |||
| Labour | Colin Davidson (incumbent) | 20.6% | 1,348 | |||
| Liberal Democrats | Eugene Clarke | 19.3% | 1,268 | 1,307.8 | 1,312.5 | |
| SNP | Alistair Suttie (incumbent) | 10.8% | 707 | 1,323.2 | ||
| Conservative | Graham Ritchie (incumbent) | 10.4% | 683 | 686.7 | 688.5 | |
| Labour | Jacob Winton | 4.1% | 271 | 287.2 | 310.9 | |
| Scottish Green | Iain Morrice | 2.4% | 156 | 199.5 | 200.3 | |
| Scottish Family | Davina Saunders | 0.7% | 49 | 52.7 | 53 | |
| Electorate: 15,245 Valid: 6,559 Spoilt: 128 Quota: 1,312 Turnout: 43.9% | ||||||
Buckhaven, Methil and Wemyss Villages
- 2017: 2xSNP; 2xLab
| Party | Candidate | FPv% | Count | ||||
|---|---|---|---|---|---|---|---|
| 1 | 2 | 3 | 4 | ||||
| SNP | Ken Caldwell (incumbent) | 30.0% | 1,532 | ||||
| Labour | David Graham (incumbent) | 24.4% | 1,248 | ||||
| SNP | John O'Brien (incumbent) | 17.4% | 890 | 1,037.4 | |||
| Labour | Thomas Adams | 15.8% | 809 | 838.3 | 881.9 | 1,052.9 | |
| Conservative | Brian Mills | 6.5% | 330 | 333.3 | 336.6 | 343.7 | |
| Liberal Democrats | Celyn Ashworth | 2.3% | 117 | 119.3 | 127.3 | 130.4 | |
| Scottish Green | Jerome van Leeuwen | 2.2% | 113 | 124 | 193.6 | 196.7 | |
| Alba | Susan Blair | 1.3% | 66 | 75.7 | 99.9 | 102.3 | |
| Electorate: 13,540 Valid: 5,105 Spoilt: 136 Quota: 1,022 Turnout: 38.7% | |||||||
Aftermath
On 19 May 2022, a Labour-minority council was backed by 41 votes to 34, with Liberal Democrat and Conservative councillors voting for it. Labour denied forming a coalition with either the Lib Dems or the Conservatives but said they would need the support of others in the council to provide an effective administration. A social media post put out by the local authority explaining how the three Unionist parties had voted together was later edited to remove any reference to different parties.[25] SNP group leader, Councillor David Alexander said that this outcome was "trampling on democracy" and said there was "no coherent defence for this gerrymandered motion" given that the SNP had won the most seats.[26]
References
- "Local Government Boundary Commission for Scotland - Fifth Electoral Reviews - Fife". www.lgbc-scotland.gov.uk. Archived from the original on 12 March 2017. Retrieved 20 May 2017.
- "Candidate Votes Per Stage Report - Ward 1 - West Fife and Coastal Villages" (PDF). Fife Council. Retrieved 21 September 2022.
- "Candidate Votes Per Stage Report - Ward 2 - Dunfermline North" (PDF). Fife Council. Retrieved 21 September 2022.
- "Candidate Votes Per Stage Report - Ward 3 - Dunfermline Central" (PDF). Fife Council. Retrieved 21 September 2022.
- "Candidate Votes Per Stage Report - Ward 4 - Dunfermline South" (PDF). Fife Council. Retrieved 21 September 2022.
- "Candidate Votes Per Stage Report - Ward 5 - Rosyth" (PDF). Fife Council. Retrieved 21 September 2022.
- "Candidate Votes Per Stage Report - Ward 6 - Inverkeithing & Dalgety Bay" (PDF). Fife Council. Retrieved 21 September 2022.
- "Candidate Votes Per Stage Report - Ward 7 - Cowdenbeath" (PDF). Fife Council. Retrieved 21 September 2022.
- "Candidate Votes Per Stage Report - Ward 8 - Lochgelly, Cardenden & Benarty" (PDF). Fife Council. Retrieved 21 September 2022.
- "Candidate Votes Per Stage Report - Ward 9 - Burntisland, Kinghorn & Western Kirkcaldy" (PDF). Fife Council. Retrieved 21 September 2022.
- "Candidate Votes Per Stage Report - Ward 10 - Kirkcaldy North" (PDF). Fife Council. Retrieved 21 September 2022.
- "Candidate Votes Per Stage Report - Ward 11 - Kirkcaldy Central" (PDF). Fife Council. Retrieved 21 September 2022.
- "Candidate Votes Per Stage Report - Ward 12 - Kirkcaldy East" (PDF). Fife Council. Retrieved 21 September 2022.
- "Candidate Votes Per Stage Report - Ward 13 - Glenrothes West & Kinglassie" (PDF). Fife Council. Retrieved 21 September 2022.
- "Candidate Votes Per Stage Report - Ward 14 - Glenrothes North, Leslie & Markinch" (PDF). Fife Council. Retrieved 21 September 2022.
- "Candidate Votes Per Stage Report - Ward 15 - Glenrothes Central & Thornton" (PDF). Fife Council. Retrieved 21 September 2022.
- "Local Elections 2022 | Fife Council". Fife Council. Retrieved 6 May 2022.
- "Candidate Votes Per Stage Report - Ward 16 - Howe Of Fife and Tay Coast" (PDF). Fife Council. 6 May 2022. Retrieved 7 May 2022.
- "Candidate Votes Per Stage Report - Ward 17 - Tay Bridgehead" (PDF). Fife Council. Retrieved 21 September 2022.
- "Candidate Votes Per Stage Report - Ward 18 - St Andrews" (PDF). Fife Council. 6 May 2022. Retrieved 7 May 2022.
- "Candidate Votes Per Stage Report - Ward 19 - East Neuk and Landward" (PDF). Fife Council. 6 May 2022. Retrieved 7 May 2022.
- "Candidate Votes Per Stage Report - Ward 20 - Cupar" (PDF). Fife Council. 6 May 2022. Archived from the original (PDF) on 6 May 2022. Retrieved 6 May 2022.
- "Candidate Votes Per Stage Report - Ward 21 - Leven, Kennoway & Largo" (PDF). Fife Council. Retrieved 21 September 2022.
- "Candidate Votes Per Stage Report - Ward 22 - Buckhaven, Methil & Wemyss Villages" (PDF). Fife Council. Retrieved 21 September 2022.
- Richards, Xander (24 May 2022). "Kathleen Leslie: Tory who called Nicola Sturgeon 'hag' hands Labour Fife Council". The National. Archived from the original on 24 May 2022.
- Buchanan, Clare (19 May 2022). "Fife Council to be run by minority Labour administration as SNP accuse party of "trampling on democracy". Dunfermline Press. Retrieved 20 May 2022.
External links
- "Statement of Persons Nominated in full, without stations, 2022" (PDF). Fife Council. Retrieved 14 April 2022.