2023 Rugby Borough Council election
The 2023 Rugby Borough Council election took place on 4 May 2023, to elect 14 members (one-third) of Rugby Borough Council in Warwickshire, England.
| |||||||||||||||||||||||||||||||||||||
14 out of 42 seats to Rugby Borough Council 22 seats needed for a majority | |||||||||||||||||||||||||||||||||||||
|---|---|---|---|---|---|---|---|---|---|---|---|---|---|---|---|---|---|---|---|---|---|---|---|---|---|---|---|---|---|---|---|---|---|---|---|---|---|
| |||||||||||||||||||||||||||||||||||||
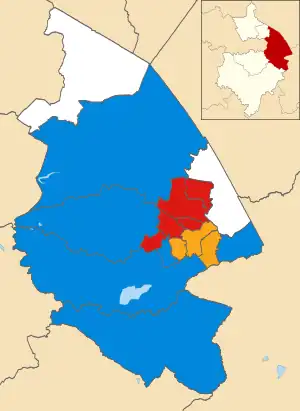 Winner of each seat at the 2023 Rugby Borough Council election | |||||||||||||||||||||||||||||||||||||
| |||||||||||||||||||||||||||||||||||||
Summary
Following the results, the Conservatives lost the council to no overall control.[1]
| 2023 Rugby Borough Council election[2] | ||||||||||
|---|---|---|---|---|---|---|---|---|---|---|
| Party | This election | Full council | This election | |||||||
| Seats | Net | Seats % | Other | Total | Total % | Votes | Votes % | +/− | ||
| Conservative | 6 | 42.9 | 15 | 21 | 50.0 | 9,260 | 36.1 | –1.8 | ||
| Labour | 5 | 35.7 | 7 | 12 | 28.6 | 8,916 | 34.8 | +0.8 | ||
| Liberal Democrats | 3 | 21.4 | 6 | 9 | 21.4 | 5,552 | 21.6 | –0.6 | ||
| Green | 0 | 0.0 | 0 | 0 | 0.0 | 1,768 | 6.9 | +1.1 | ||
| Reform UK | 0 | 0.0 | 0 | 0 | 0.0 | 156 | 0.6 | N/A | ||
Ward results
Admirals & Cawston
| Party | Candidate | Votes | % | ±% | |
|---|---|---|---|---|---|
| Labour | Verity Robinson | 1,067 | 45.3 | –6.2 | |
| Conservative | Dean Richards | 977 | 41.5 | +7.2 | |
| Liberal Democrats | Lee Chase | 186 | 7.9 | –0.7 | |
| Green | Jenny Farley | 124 | 5.3 | –0.3 | |
| Majority | 90 | 3.8 | –13.4 | ||
| Turnout | 2,354 | 34.0 | –0.9 | ||
| Labour gain from Conservative | Swing | ||||
Benn
| Party | Candidate | Votes | % | ±% | |
|---|---|---|---|---|---|
| Labour | Rob Barnett | 914 | 62.8 | ±0.0 | |
| Conservative | Dapo Awotunde | 280 | 19.2 | –1.2 | |
| Green | Angie Dunne | 151 | 10.4 | –6.3 | |
| Liberal Democrats | Trisha Trimble | 111 | 7,6 | N/A | |
| Majority | 634 | 43.6 | +1.2 | ||
| Turnout | 1,456 | 24.8 | –1.5 | ||
| Labour hold | Swing | ||||
Bilton
| Party | Candidate | Votes | % | ±% | |
|---|---|---|---|---|---|
| Conservative | Lisa Parker | 787 | 36.3 | –5.2 | |
| Liberal Democrats | Stephen Pimm | 712 | 32.8 | +1.1 | |
| Labour | Colin Mander | 555 | 25.6 | +5.2 | |
| Green | Benjamin Gladwin | 115 | 5.3 | –1.1 | |
| Majority | 75 | 3.5 | –6.3 | ||
| Turnout | 2,169 | 43.0 | +0.4 | ||
| Conservative hold | Swing | ||||
Coton & Boughton
| Party | Candidate | Votes | % | ±% | |
|---|---|---|---|---|---|
| Labour | Senthil Periasamy | 909 | 45.1 | +3.1 | |
| Conservative | Seb Lowe | 813 | 40.3 | –0.2 | |
| Liberal Democrats | Edward Blackburn | 127 | 6.3 | –2.3 | |
| Green | Roy Sandison | 103 | 5.1 | –2.0 | |
| Reform UK | Jamie Pullin | 64 | 3.2 | N/A | |
| Majority | 96 | 4.8 | +3.3 | ||
| Turnout | 2,016 | 35.3 | +2.8 | ||
| Labour gain from Conservative | Swing | ||||
Dunsmore
| Party | Candidate | Votes | % | ±% | |
|---|---|---|---|---|---|
| Conservative | John Keeling | 1,089 | 44.8 | –4.8 | |
| Labour | Ann Coomber | 638 | 26.2 | +8.0 | |
| Liberal Democrats | Jonathan Bennett | 494 | 20.3 | –12.0 | |
| Green | Helen Ford | 212 | 8.7 | N/A | |
| Majority | 451 | 18.6 | +1.2 | ||
| Turnout | 2,433 | 35.9 | –2.0 | ||
| Conservative hold | Swing | ||||
Eastlands
| Party | Candidate | Votes | % | ±% | |
|---|---|---|---|---|---|
| Liberal Democrats | Neil Sandison | 894 | 49.3 | –0.1 | |
| Labour | George Bates | 461 | 25.4 | +2.0 | |
| Conservative | Heidi Thomas | 347 | 19.1 | –1.4 | |
| Green | Mark Patrick | 113 | 6.2 | –0.5 | |
| Majority | 433 | 23.9 | –2.1 | ||
| Turnout | 1,815 | 31.9 | –3.8 | ||
| Liberal Democrats hold | Swing | ||||
Hillmorton
| Party | Candidate | Votes | % | ±% | |
|---|---|---|---|---|---|
| Conservative | Luke Russell | 909 | 44.4 | –1.2 | |
| Labour | Jenny Offordile | 866 | 42.3 | +3.0 | |
| Liberal Democrats | Julie Douglas | 168 | 8.2 | –6.9 | |
| Green | Becca Stevenson | 105 | 5.1 | N/A | |
| Majority | 43 | 2.1 | –4.2 | ||
| Turnout | 2,048 | 32.9 | –1.3 | ||
| Conservative hold | Swing | ||||
Leam Valley
| Party | Candidate | Votes | % | ±% | |
|---|---|---|---|---|---|
| Conservative | Dale Keeling | 477 | 57.5 | –23.7 | |
| Labour | Mark Gore | 171 | 20.6 | +1.8 | |
| Liberal Democrats | Victoria Saxby-Edwards | 94 | 11.3 | N/A | |
| Green | Chris Mawby | 88 | 10.6 | N/A | |
| Majority | 306 | 36.9 | –25.5 | ||
| Turnout | 830 | 42.2 | |||
| Conservative hold | Swing | ||||
New Bilton
| Party | Candidate | Votes | % | ±% | |
|---|---|---|---|---|---|
| Labour | Barbara Brown | 717 | 59.4 | +0.5 | |
| Conservative | Christopher Johnson | 298 | 24.7 | –3.0 | |
| Liberal Democrats | Claire Sandison | 109 | 9.0 | N/A | |
| Green | Maralyn Pickup | 84 | 7.0 | –6.4 | |
| Majority | 419 | 34.7 | +3.5 | ||
| Turnout | 1,208 | 22.8 | –2.9 | ||
| Labour hold | Swing | ||||
Newbold & Brownsover
| Party | Candidate | Votes | % | ±% | |
|---|---|---|---|---|---|
| Labour | Nooria Sayani | 777 | 51.3 | –3.8 | |
| Conservative | Ginny Gould | 498 | 32.9 | +0.9 | |
| Green | Mark Summers | 132 | 8.7 | –3.7 | |
| Liberal Democrats | Hugh Trimble | 108 | 7.1 | N/A | |
| Majority | 279 | 18.4 | –4.2 | ||
| Turnout | 1,515 | 24.7 | –1.8 | ||
| Labour hold | Swing | ||||
Paddox
| Party | Candidate | Votes | % | ±% | |
|---|---|---|---|---|---|
| Liberal Democrats | Jerry Roodhouse | 1,197 | 59.1 | +3.0 | |
| Labour | Chris Mawby | 363 | 17.9 | +0.1 | |
| Conservative | Bella Leathley | 360 | 17.8 | –3.0 | |
| Green | Bob Beggs | 107 | 5.3 | +0.1 | |
| Majority | 834 | 41.2 | +5.9 | ||
| Turnout | 2,027 | 37.0 | –1.5 | ||
| Liberal Democrats hold | Swing | ||||
Revel & Binley Woods
| Party | Candidate | Votes | % | ±% | |
|---|---|---|---|---|---|
| Conservative | Heather Timms | 1,126 | 61.4 | –2.7 | |
| Labour | Sarah Feeney | 502 | 27.4 | –8.5 | |
| Green | Stephen Ward | 119 | 6.5 | N/A | |
| Liberal Democrats | James Moran | 87 | 4.7 | N/A | |
| Majority | 624 | 34.0 | +5.6 | ||
| Turnout | 1,834 | 36.0 | –1.8 | ||
| Conservative hold | Swing | ||||
Rokeby & Overslade
| Party | Candidate | Votes | % | ±% | |
|---|---|---|---|---|---|
| Liberal Democrats | Isabelle McKenzie | 1,180 | 57.6 | –8.1 | |
| Conservative | Louise Adkins | 397 | 19.4 | ±0.0 | |
| Labour | Chris Lee | 356 | 17.4 | +2.5 | |
| Green | Kate Crowley | 115 | 5.6 | N/A | |
| Majority | 783 | 38.2 | –8.1 | ||
| Turnout | 2,048 | 35.4 | –1.9 | ||
| Liberal Democrats hold | Swing | ||||
Wolston & The Lawfords
| Party | Candidate | Votes | % | ±% | |
|---|---|---|---|---|---|
| Conservative | Derek Poole | 902 | 47.6 | –6.3 | |
| Labour | Kieren Brown | 616 | 32.5 | +3.6 | |
| Green | Lesley Summers | 200 | 10.6 | –1.7 | |
| Reform UK | John Birch | 92 | 4.9 | N/A | |
| Liberal Democrats | Hossain Tafazzal | 85 | 4.5 | –0.3 | |
| Majority | 286 | 15.1 | –9.9 | ||
| Turnout | 1,895 | 31.6 | –1.7 | ||
| Conservative hold | Swing | ||||
References
- "Labour wins two seats from Conservatives in Rugby Borough Council elections". Rugby Observer. 6 May 2022. Retrieved 2023-05-07.
- "Rugby result - Local Elections 2023". BBC News. Retrieved 2023-05-07.
This article is issued from Wikipedia. The text is licensed under Creative Commons - Attribution - Sharealike. Additional terms may apply for the media files.