Aarhus East (nomination district)
Aarhus East nominating district is one of the 92 nominating districts that exists for Danish elections following the 2007 municipal reform.[3][4][5] It is one of the four nomination districts in Aarhus Municipality, the others being Aarhus South, Aarhus West and Aarhus North.[6] It was created in 1970,[7] with its boundaries being slightly changed in 2007.
| Aarhus East | |
|---|---|
| Aarhus Øst | |
| Nomination district constituency for the Folketing | |
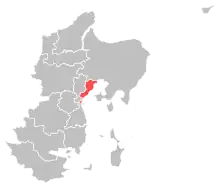 Location of Aarhus East within East Jutland | |
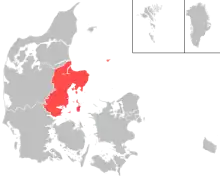 Location of East Jutland within Denmark | |
| Municipalities | Aarhus |
| Constituency | East Jutland |
| Electorate | 81,044 (2022)[1] |
| Current constituency | |
| Created | 1970[2] |
In general elections, the district is a strong area for parties commonly associated with the red bloc.[8]
General elections results
General elections in the 2020s
| Parties | Vote | |||||
|---|---|---|---|---|---|---|
| Votes | % | + / - | ||||
| Social Democrats | 12,826 | 18.22 | -0.35 | |||
| Liberal Alliance | 9,330 | 13.25 | +8.85 | |||
| Venstre | 8,822 | 12.53 | -7.37 | |||
| Green Left | 7,853 | 11.15 | +0.94 | |||
| Moderates | 7,316 | 10.39 | New | |||
| Red–Green Alliance | 6,236 | 8.86 | -1.21 | |||
| Social Liberals | 5,622 | 7.98 | -7.49 | |||
| The Alternative | 4,393 | 6.24 | +0.32 | |||
| Conservatives | 3,690 | 5.24 | -1.55 | |||
| Denmark Democrats | 1,760 | 2.50 | New | |||
| New Right | 1,229 | 1.75 | +0.22 | |||
| Danish People's Party | 655 | 0.93 | -2.66 | |||
| Independent Greens | 397 | 0.56 | New | |||
| Christian Democrats | 230 | 0.33 | -1.44 | |||
| Jesper Antonsen | 41 | 0.06 | New | |||
| Chresten H. Ibsen | 8 | 0.01 | -0.07 | |||
| Total | 70,408 | |||||
| Source[9] | ||||||
General elections in the 2010s
| Parties | Vote | |||||
|---|---|---|---|---|---|---|
| Votes | % | + / - | ||||
| Venstre | 12,564 | 19.90 | +3.13 | |||
| Social Democrats | 11,725 | 18.57 | -4.77 | |||
| Social Liberals | 9,771 | 15.47 | +6.94 | |||
| Green Left | 6,446 | 10.21 | +5.09 | |||
| Red–Green Alliance | 6,359 | 10.07 | +0.58 | |||
| Conservatives | 4,287 | 6.79 | +3.41 | |||
| The Alternative | 3,739 | 5.92 | -4.70 | |||
| Liberal Alliance | 2,781 | 4.40 | -7.22 | |||
| Danish People's Party | 2,269 | 3.59 | -6.38 | |||
| Christian Democrats | 1,118 | 1.77 | +0.92 | |||
| New Right | 967 | 1.53 | New | |||
| Stram Kurs | 593 | 0.94 | New | |||
| Klaus Riskær Pedersen Party | 465 | 0.74 | New | |||
| Chresten H. Ibsen | 53 | 0.08 | New | |||
| Hans Schultz | 7 | 0.01 | New | |||
| Total | 63,144 | |||||
| Source[10] | ||||||
| Parties | Vote | |||||
|---|---|---|---|---|---|---|
| Votes | % | + / - | ||||
| Social Democrats | 13,362 | 23.34 | +1.59 | |||
| Venstre | 9,599 | 16.77 | -7.10 | |||
| Liberal Alliance | 6,650 | 11.62 | +5.37 | |||
| The Alternative | 6,082 | 10.62 | New | |||
| Danish People's Party | 5,706 | 9.97 | +3.99 | |||
| Red–Green Alliance | 5,432 | 9.49 | -0.24 | |||
| Social Liberals | 4,881 | 8.53 | -8.18 | |||
| Green Left | 2,932 | 5.12 | -5.44 | |||
| Conservatives | 1,936 | 3.38 | -1.13 | |||
| Christian Democrats | 486 | 0.85 | +0.25 | |||
| Yahya Hassan | 165 | 0.29 | New | |||
| Poul Gundersen | 10 | 0.02 | New | |||
| Peter Ymer Nielsen | 6 | 0.01 | New | |||
| Total | 57,247 | |||||
| Source[11] | ||||||
| Parties | Vote | |||||
|---|---|---|---|---|---|---|
| Votes | % | + / - | ||||
| Venstre | 13,012 | 23.87 | +2.11 | |||
| Social Democrats | 11,858 | 21.75 | -2.38 | |||
| Social Liberals | 9,110 | 16.71 | +7.28 | |||
| Green Left | 5,760 | 10.56 | -7.94 | |||
| Red–Green Alliance | 5,307 | 9.73 | +5.85 | |||
| Liberal Alliance | 3,410 | 6.25 | +2.43 | |||
| Danish People's Party | 3,262 | 5.98 | -1.16 | |||
| Conservatives | 2,458 | 4.51 | -6.01 | |||
| Christian Democrats | 329 | 0.60 | -0.20 | |||
| Ibrahim Gøkhan | 8 | 0.01 | New | |||
| Janus Kramer Møller | 6 | 0.01 | New | |||
| Total | 54,520 | |||||
| Source[12] | ||||||
General elections in the 2000s
| Parties | Vote | |||||
|---|---|---|---|---|---|---|
| Votes | % | + / - | ||||
| Social Democrats | 12,398 | 24.13 | -0.48 | |||
| Venstre | 11,178 | 21.76 | -1.99 | |||
| Green Left | 9,505 | 18.50 | +10.25 | |||
| Conservatives | 5,402 | 10.52 | -0.89 | |||
| Social Liberals | 4,846 | 9.43 | -6.63 | |||
| Danish People's Party | 3,666 | 7.14 | +0.16 | |||
| Red–Green Alliance | 1,994 | 3.88 | -1.66 | |||
| New Alliance | 1,964 | 3.82 | New | |||
| Christian Democrats | 412 | 0.80 | -0.93 | |||
| Jes Krogh | 6 | 0.01 | New | |||
| Total | 51,371 | |||||
| Source[13] | ||||||
| Parties | Vote | |||||
|---|---|---|---|---|---|---|
| Votes | % | + / - | ||||
| Social Democrats | 12,253 | 24.61 | -4.51 | |||
| Venstre | 11,829 | 23.75 | -3.79 | |||
| Social Liberals | 7,996 | 16.06 | +6.86 | |||
| Conservatives | 5,683 | 11.41 | +2.35 | |||
| Green Left | 4,109 | 8.25 | -0.39 | |||
| Danish People's Party | 3,475 | 6.98 | 0.00 | |||
| Red–Green Alliance | 2,761 | 5.54 | +1.41 | |||
| Christian Democrats | 860 | 1.73 | -0.74 | |||
| Centre Democrats | 612 | 1.23 | -1.26 | |||
| Minority Party | 206 | 0.41 | New | |||
| Janus Kramer Møller | 13 | 0.03 | New | |||
| Total | 49,797 | |||||
| Source[14] | ||||||
| Parties | Vote | |||||
|---|---|---|---|---|---|---|
| Votes | % | + / - | ||||
| Social Democrats | 14,427 | 29.12 | -5.52 | |||
| Venstre | 13,647 | 27.54 | +5.19 | |||
| Social Liberals | 4,556 | 9.20 | +2.82 | |||
| Conservatives | 4,491 | 9.06 | +0.25 | |||
| Green Left | 4,281 | 8.64 | -1.91 | |||
| Danish People's Party | 3,459 | 6.98 | +2.66 | |||
| Red–Green Alliance | 2,048 | 4.13 | -0.68 | |||
| Centre Democrats | 1,234 | 2.49 | -2.10 | |||
| Christian People's Party | 1,225 | 2.47 | +0.32 | |||
| Progress Party | 156 | 0.31 | -0.65 | |||
| Lars Bang | 23 | 0.05 | New | |||
| Total | 49,547 | |||||
| Source[15] | ||||||
General elections in the 1990s
| Parties | Vote | |||||
|---|---|---|---|---|---|---|
| Votes | % | + / - | ||||
| Social Democrats | 16,607 | 34.64 | +5.58 | |||
| Venstre | 10,714 | 22.35 | +1.58 | |||
| Green Left | 5,058 | 10.55 | -0.30 | |||
| Conservatives | 4,221 | 8.81 | -5.15 | |||
| Social Liberals | 3,059 | 6.38 | -0.10 | |||
| Red–Green Alliance | 2,304 | 4.81 | -0.11 | |||
| Centre Democrats | 2,201 | 4.59 | +1.92 | |||
| Danish People's Party | 2,070 | 4.32 | New | |||
| Christian People's Party | 1,033 | 2.15 | +0.37 | |||
| Progress Party | 462 | 0.96 | -2.72 | |||
| Democratic Renewal | 198 | 0.41 | New | |||
| John Juhler | 9 | 0.02 | New | |||
| Total | 47,936 | |||||
| Source[16] | ||||||
| Parties | Vote | |||||
|---|---|---|---|---|---|---|
| Votes | % | + / - | ||||
| Social Democrats | 13,463 | 29.06 | -0.55 | |||
| Venstre | 9,623 | 20.77 | +4.59 | |||
| Conservatives | 6,467 | 13.96 | -0.19 | |||
| Green Left | 5,025 | 10.85 | -4.81 | |||
| Social Liberals | 3,003 | 6.48 | +1.48 | |||
| Jacob Haugaard | 2,694 | 5.82 | +2.42 | |||
| Red–Green Alliance | 2,277 | 4.92 | +1.00 | |||
| Progress Party | 1,704 | 3.68 | -0.26 | |||
| Centre Democrats | 1,236 | 2.67 | -1.45 | |||
| Christian People's Party | 825 | 1.78 | +0.20 | |||
| Søren Boelskifte | 5 | 0.01 | New | |||
| Bjarne S. Landsfeldt | 2 | 0.00 | New | |||
| Total | 46,324 | |||||
| Source[17] | ||||||
| Parties | Vote | |||||
|---|---|---|---|---|---|---|
| Votes | % | + / - | ||||
| Social Democrats | 12,702 | 29.61 | +6.40 | |||
| Venstre | 6,942 | 16.18 | +5.91 | |||
| Green Left | 6,719 | 15.66 | -7.33 | |||
| Conservatives | 6,071 | 14.15 | -4.46 | |||
| Social Liberals | 2,146 | 5.00 | -1.81 | |||
| Centre Democrats | 1,767 | 4.12 | +0.29 | |||
| Progress Party | 1,691 | 3.94 | -1.44 | |||
| Red–Green Alliance | 1,683 | 3.92 | New | |||
| Jacob Haugaard | 1,457 | 3.40 | +1.90 | |||
| Christian People's Party | 676 | 1.58 | +0.29 | |||
| The Greens | 500 | 1.17 | -0.48 | |||
| Common Course | 293 | 0.68 | -0.28 | |||
| Justice Party of Denmark | 249 | 0.58 | New | |||
| Total | 42,896 | |||||
| Source[18] | ||||||
General elections in the 1980s
| Parties | Vote | |||||
|---|---|---|---|---|---|---|
| Votes | % | + / - | ||||
| Social Democrats | 9,806 | 23.21 | +1.84 | |||
| Green Left | 9,711 | 22.99 | -0.86 | |||
| Conservatives | 7,864 | 18.61 | -0.68 | |||
| Venstre | 4,338 | 10.27 | +2.02 | |||
| Social Liberals | 2,877 | 6.81 | -1.10 | |||
| Progress Party | 2,271 | 5.38 | +2.47 | |||
| Centre Democrats | 1,620 | 3.83 | -0.14 | |||
| Left Socialists | 767 | 1.82 | -3.01 | |||
| Communist Party of Denmark | 705 | 1.67 | +0.07 | |||
| The Greens | 696 | 1.65 | -0.08 | |||
| Jacob Haugaard | 635 | 1.50 | +0.38 | |||
| Christian People's Party | 545 | 1.29 | -0.24 | |||
| Common Course | 404 | 0.96 | +0.08 | |||
| Finn Mikkelsen | 6 | 0.01 | New | |||
| Bruno Nielsen-Boreas | 3 | 0.01 | New | |||
| Total | 42,248 | |||||
| Source[19] | ||||||
| Parties | Vote | |||||
|---|---|---|---|---|---|---|
| Votes | % | + / - | ||||
| Green Left | 9,952 | 23.85 | +4.15 | |||
| Social Democrats | 8,918 | 21.37 | -2.65 | |||
| Conservatives | 8,052 | 19.29 | -1.79 | |||
| Venstre | 3,441 | 8.25 | -0.80 | |||
| Social Liberals | 3,302 | 7.91 | +1.58 | |||
| Left Socialists | 2,015 | 4.83 | -4.30 | |||
| Centre Democrats | 1,658 | 3.97 | +0.25 | |||
| Progress Party | 1,216 | 2.91 | +1.09 | |||
| The Greens | 723 | 1.73 | New | |||
| Communist Party of Denmark | 667 | 1.60 | +0.44 | |||
| Christian People's Party | 638 | 1.53 | -0.01 | |||
| Jacob Haugaard | 468 | 1.12 | +0.63 | |||
| Common Course | 366 | 0.88 | New | |||
| Justice Party of Denmark | 217 | 0.52 | -1.31 | |||
| Humanist Party | 69 | 0.17 | New | |||
| Socialist Workers Party | 19 | 0.05 | -0.03 | |||
| Marxist–Leninists Party | 12 | 0.03 | -0.02 | |||
| Henning Brønd-Nielsen | 1 | 0.00 | New | |||
| Total | 41,734 | |||||
| Source[20] | ||||||
| Parties | Vote | |||||
|---|---|---|---|---|---|---|
| Votes | % | + / - | ||||
| Social Democrats | 9,553 | 24.02 | -2.18 | |||
| Conservatives | 8,383 | 21.08 | +7.22 | |||
| Green Left | 7,833 | 19.70 | -0.27 | |||
| Left Socialists | 3,631 | 9.13 | +0.97 | |||
| Venstre | 3,598 | 9.05 | +1.31 | |||
| Social Liberals | 2,518 | 6.33 | +1.52 | |||
| Centre Democrats | 1,481 | 3.72 | -4.16 | |||
| Justice Party of Denmark | 727 | 1.83 | +0.15 | |||
| Progress Party | 724 | 1.82 | -3.91 | |||
| Christian People's Party | 611 | 1.54 | +0.26 | |||
| Communist Party of Denmark | 461 | 1.16 | -0.75 | |||
| Jacob Haugaard | 195 | 0.49 | -0.02 | |||
| Socialist Workers Party | 33 | 0.08 | 0.00 | |||
| Marxist–Leninists Party | 20 | 0.05 | New | |||
| Total | 39,768 | |||||
| Source[21] | ||||||
| Parties | Vote | |||||
|---|---|---|---|---|---|---|
| Votes | % | + / - | ||||
| Social Democrats | 9,693 | 26.20 | -7.19 | |||
| Green Left | 7,387 | 19.97 | +8.21 | |||
| Conservatives | 5,127 | 13.86 | +0.76 | |||
| Left Socialists | 3,017 | 8.16 | -2.04 | |||
| Centre Democrats | 2,913 | 7.88 | +4.84 | |||
| Venstre | 2,862 | 7.74 | -0.92 | |||
| Progress Party | 2,121 | 5.73 | -0.47 | |||
| Social Liberals | 1,779 | 4.81 | -0.35 | |||
| Communist Party of Denmark | 705 | 1.91 | -0.97 | |||
| Justice Party of Denmark | 623 | 1.68 | -1.08 | |||
| Christian People's Party | 472 | 1.28 | -0.18 | |||
| Jacob Haugaard | 190 | 0.51 | -0.17 | |||
| Communist Workers Party | 69 | 0.19 | -0.52 | |||
| Socialist Workers Party | 31 | 0.08 | New | |||
| Henrik Christensen | 1 | 0.00 | New | |||
| Lars Michaelsen | 0 | 0.00 | New | |||
| Total | 36,990 | |||||
| Source[22] | ||||||
General elections in the 1970s
| Parties | Vote | |||||
|---|---|---|---|---|---|---|
| Votes | % | + / - | ||||
| Social Democrats | 12,403 | 33.39 | -2.48 | |||
| Conservatives | 4,865 | 13.10 | +4.45 | |||
| Green Left | 4,367 | 11.76 | +3.84 | |||
| Left Socialists | 3,789 | 10.20 | +1.83 | |||
| Venstre | 3,216 | 8.66 | +0.74 | |||
| Progress Party | 2,303 | 6.20 | -4.03 | |||
| Social Liberals | 1,916 | 5.16 | +2.23 | |||
| Centre Democrats | 1,129 | 3.04 | -3.14 | |||
| Communist Party of Denmark | 1,071 | 2.88 | -2.63 | |||
| Justice Party of Denmark | 1,027 | 2.76 | -0.69 | |||
| Christian People's Party | 544 | 1.46 | -0.76 | |||
| Communist Workers Party | 264 | 0.71 | New | |||
| Jacob Haugaard | 254 | 0.68 | New | |||
| Total | 37,148 | |||||
| Source[23] | ||||||
| Parties | Vote | |||||
|---|---|---|---|---|---|---|
| Votes | % | + / - | ||||
| Social Democrats | 13,201 | 35.87 | +5.67 | |||
| Progress Party | 3,765 | 10.23 | -0.05 | |||
| Conservatives | 3,185 | 8.65 | +3.00 | |||
| Left Socialists | 3,080 | 8.37 | +2.86 | |||
| Venstre | 2,916 | 7.92 | -10.96 | |||
| Green Left | 2,915 | 7.92 | +0.18 | |||
| Centre Democrats | 2,276 | 6.18 | +4.01 | |||
| Communist Party of Denmark | 2,029 | 5.51 | -0.62 | |||
| Justice Party of Denmark | 1,269 | 3.45 | +1.04 | |||
| Social Liberals | 1,080 | 2.93 | -3.64 | |||
| Christian People's Party | 818 | 2.22 | -2.22 | |||
| Pensioners' Party | 260 | 0.71 | New | |||
| Tommy Nielsen | 7 | 0.02 | New | |||
| Total | 36,801 | |||||
| Source[24] | ||||||
| Parties | Vote | |||||
|---|---|---|---|---|---|---|
| Votes | % | + / - | ||||
| Social Democrats | 10,949 | 30.20 | +3.92 | |||
| Venstre | 6,845 | 18.88 | +10.65 | |||
| Progress Party | 3,727 | 10.28 | -3.28 | |||
| Green Left | 2,807 | 7.74 | -1.29 | |||
| Social Liberals | 2,382 | 6.57 | -3.21 | |||
| Communist Party of Denmark | 2,223 | 6.13 | -0.31 | |||
| Conservatives | 2,047 | 5.65 | -4.50 | |||
| Left Socialists | 1,996 | 5.51 | +2.53 | |||
| Christian People's Party | 1,611 | 4.44 | +1.45 | |||
| Justice Party of Denmark | 874 | 2.41 | -1.72 | |||
| Centre Democrats | 786 | 2.17 | -4.22 | |||
| Elmer Mariager | 6 | 0.02 | New | |||
| Total | 36,253 | |||||
| Source[25] | ||||||
| Parties | Vote | |||||
|---|---|---|---|---|---|---|
| Votes | % | + / - | ||||
| Social Democrats | 9,680 | 26.28 | -12.26 | |||
| Progress Party | 4,995 | 13.56 | New | |||
| Conservatives | 3,738 | 10.15 | -8.10 | |||
| Social Liberals | 3,604 | 9.78 | -3.26 | |||
| Green Left | 3,325 | 9.03 | -2.68 | |||
| Venstre | 3,030 | 8.23 | -1.81 | |||
| Communist Party of Denmark | 2,371 | 6.44 | +4.59 | |||
| Centre Democrats | 2,354 | 6.39 | New | |||
| Justice Party of Denmark | 1,521 | 4.13 | +2.31 | |||
| Christian People's Party | 1,103 | 2.99 | +1.55 | |||
| Left Socialists | 1,099 | 2.98 | -0.34 | |||
| John Bove | 18 | 0.05 | New | |||
| Total | 36,838 | |||||
| Source[26] | ||||||
| Parties | Vote | |||||
|---|---|---|---|---|---|---|
| Votes | % | + / - | ||||
| Social Democrats | 13,618 | 38.54 | + | |||
| Conservatives | 6,450 | 18.25 | + | |||
| Social Liberals | 4,607 | 13.04 | + | |||
| Green Left | 4,138 | 11.71 | + | |||
| Venstre | 3,549 | 10.04 | + | |||
| Left Socialists | 1,172 | 3.32 | + | |||
| Communist Party of Denmark | 652 | 1.85 | + | |||
| Justice Party of Denmark | 642 | 1.82 | + | |||
| Christian People's Party | 509 | 1.44 | New | |||
| Total | 35,337 | |||||
| Source[27] | ||||||
European Parliament elections results
2019 European Parliament election in Denmark
| Parties | Vote | |||||
|---|---|---|---|---|---|---|
| Votes | % | + / - | ||||
| Green Left | 10,063 | 19.13 | +1.01 | |||
| Venstre | 9,967 | 18.95 | +3.69 | |||
| Social Democrats | 8,827 | 16.78 | -2.68 | |||
| Social Liberals | 8,084 | 15.37 | +3.93 | |||
| Red–Green Alliance | 3,607 | 6.86 | New | |||
| The Alternative | 3,548 | 6.75 | New | |||
| Conservatives | 3,206 | 6.10 | -1.37 | |||
| Danish People's Party | 2,468 | 4.69 | -10.44 | |||
| Liberal Alliance | 1,592 | 3.03 | -1.27 | |||
| People's Movement against the EU | 1,237 | 2.35 | -6.47 | |||
| Total | 52,599 | |||||
| Source[28] | ||||||
2014 European Parliament election in Denmark
| Parties | Vote | |||||
|---|---|---|---|---|---|---|
| Votes | % | + / - | ||||
| Social Democrats | 7,313 | 19.46 | -3.90 | |||
| Green Left | 6,812 | 18.12 | -4.60 | |||
| Venstre | 5,737 | 15.26 | -1.68 | |||
| Danish People's Party | 5,689 | 15.13 | +5.69 | |||
| Social Liberals | 4,299 | 11.44 | +5.05 | |||
| People's Movement against the EU | 3,315 | 8.82 | +1.47 | |||
| Conservatives | 2,809 | 7.47 | -2.62 | |||
| Liberal Alliance | 1,615 | 4.30 | +3.25 | |||
| Total | 37,589 | |||||
| Source[29] | ||||||
2009 European Parliament election in Denmark
| Parties | Vote | |||||
|---|---|---|---|---|---|---|
| Votes | % | + / - | ||||
| Social Democrats | 8,822 | 23.36 | -5.73 | |||
| Green Left | 8,581 | 22.72 | +9.18 | |||
| Venstre | 6,400 | 16.94 | +2.28 | |||
| Conservatives | 3,810 | 10.09 | -0.60 | |||
| Danish People's Party | 3,566 | 9.44 | +5.31 | |||
| People's Movement against the EU | 2,778 | 7.35 | +2.20 | |||
| Social Liberals | 2,412 | 6.39 | -5.62 | |||
| June Movement | 1,008 | 2.67 | -6.99 | |||
| Liberal Alliance | 396 | 1.05 | New | |||
| Total | 37,773 | |||||
| Source[30] | ||||||
2004 European Parliament election in Denmark
| Parties | Vote | |||||
|---|---|---|---|---|---|---|
| Votes | % | + / - | ||||
| Social Democrats | 8,746 | 29.09 | +15.21 | |||
| Venstre | 4,407 | 14.66 | -5.64 | |||
| Green Left | 4,070 | 13.54 | +3.10 | |||
| Social Liberals | 3,611 | 12.01 | -1.44 | |||
| Conservatives | 3,214 | 10.69 | +2.77 | |||
| June Movement | 2,906 | 9.66 | -7.93 | |||
| People's Movement against the EU | 1,549 | 5.15 | -2.11 | |||
| Danish People's Party | 1,241 | 4.13 | +0.43 | |||
| Christian Democrats | 326 | 1.08 | -0.49 | |||
| Total | 30,070 | |||||
| Source[31] | ||||||
1999 European Parliament election in Denmark
| Parties | Vote | |||||
|---|---|---|---|---|---|---|
| Votes | % | + / - | ||||
| Venstre | 6,196 | 20.30 | +6.12 | |||
| June Movement | 5,370 | 17.59 | -2.97 | |||
| Social Democrats | 4,237 | 13.88 | +3.94 | |||
| Social Liberals | 4,105 | 13.45 | +3.61 | |||
| Green Left | 3,186 | 10.44 | -3.04 | |||
| Conservatives | 2,418 | 7.92 | -9.61 | |||
| People's Movement against the EU | 2,216 | 7.26 | -3.76 | |||
| Centre Democrats | 1,187 | 3.89 | +3.17 | |||
| Danish People's Party | 1,129 | 3.70 | New | |||
| Christian Democrats | 480 | 1.57 | +0.81 | |||
| Progress Party | 110 | 0.36 | -1.61 | |||
| Total | 30,524 | |||||
| Source[32] | ||||||
1994 European Parliament election in Denmark
| Parties | Vote | |||||
|---|---|---|---|---|---|---|
| Votes | % | + / - | ||||
| June Movement | 6,485 | 20.56 | New | |||
| Conservatives | 5,528 | 17.53 | +4.52 | |||
| Venstre | 4,471 | 14.18 | +3.48 | |||
| Green Left | 4,252 | 13.48 | -2.58 | |||
| People's Movement against the EU | 3,477 | 11.02 | -17.21 | |||
| Social Democrats | 3,134 | 9.94 | -6.23 | |||
| Social Liberals | 3,104 | 9.84 | +6.02 | |||
| Progress Party | 620 | 1.97 | -1.53 | |||
| Christian Democrats | 241 | 0.76 | -1.08 | |||
| Centre Democrats | 226 | 0.72 | -5.95 | |||
| Total | 31,538 | |||||
| Source[33] | ||||||
1989 European Parliament election in Denmark
| Parties | Vote | |||||
|---|---|---|---|---|---|---|
| Votes | % | + / - | ||||
| People's Movement against the EU | 6,982 | 28.23 | -1.64 | |||
| Social Democrats | 4,000 | 16.17 | +3.13 | |||
| Green Left | 3,972 | 16.06 | +0.97 | |||
| Conservatives | 3,219 | 13.01 | -6.85 | |||
| Venstre | 2,647 | 10.70 | +4.64 | |||
| Centre Democrats | 1,651 | 6.67 | +1.15 | |||
| Social Liberals | 944 | 3.82 | +1.05 | |||
| Progress Party | 866 | 3.50 | +1.04 | |||
| Christian Democrats | 454 | 1.84 | +0.72 | |||
| Total | 24,735 | |||||
| Source[34] | ||||||
1984 European Parliament election in Denmark
| Parties | Vote | |||||
|---|---|---|---|---|---|---|
| Votes | % | |||||
| People's Movement against the EU | 7,593 | 29.87 | ||||
| Conservatives | 5,047 | 19.86 | ||||
| Green Left | 3,836 | 15.09 | ||||
| Social Democrats | 3,315 | 13.04 | ||||
| Venstre | 1,540 | 6.06 | ||||
| Centre Democrats | 1,402 | 5.52 | ||||
| Left Socialists | 1,070 | 4.21 | ||||
| Social Liberals | 703 | 2.77 | ||||
| Progress Party | 626 | 2.46 | ||||
| Christian Democrats | 285 | 1.12 | ||||
| Total | 25,417 | |||||
| Source[35] | ||||||
Referendums
2022 Danish European Union opt-out referendum[36]
| Option | Votes | % |
|---|---|---|
| ✓ YES | 40,275 | 76.95 |
| X NO | 12,063 | 23.05 |
2015 Danish European Union opt-out referendum[37]
| Option | Votes | % |
|---|---|---|
| ✓ YES | 26,734 | 56.83 |
| X NO | 20,307 | 43.17 |
2014 Danish Unified Patent Court membership referendum[38]
| Option | Votes | % |
|---|---|---|
| ✓ YES | 23,709 | 64.98 |
| X NO | 12,776 | 35.02 |
2009 Danish Act of Succession referendum[39]
| Option | Votes | % |
|---|---|---|
| ✓ YES | 28,958 | 87.71 |
| X NO | 4,059 | 12.29 |
2000 Danish euro referendum[40]
| Option | Votes | % |
|---|---|---|
| ✓ YES | 26,977 | 55.51 |
| X NO | 21,622 | 44.49 |
1998 Danish Amsterdam Treaty referendum[41]
| Option | Votes | % |
|---|---|---|
| ✓ YES | 25,571 | 59.95 |
| X NO | 17,084 | 40.05 |
1993 Danish Maastricht Treaty referendum[42]
| Option | Votes | % |
|---|---|---|
| ✓ YES | 25,743 | 55.67 |
| X NO | 20,501 | 44.33 |
1992 Danish Maastricht Treaty referendum[43]
| Option | Votes | % |
|---|---|---|
| X NO | 23,415 | 52.80 |
| ✓ YES | 20,928 | 47.20 |
1986 Danish Single European Act referendum[44]
| Option | Votes | % |
|---|---|---|
| X NO | 19,053 | 53.69 |
| ✓ YES | 16,434 | 46.31 |
1972 Danish European Communities membership referendum[45]
| Option | Votes | % |
|---|---|---|
| ✓ YES | 20,566 | 54.08 |
| X NO | 17,460 | 45.92 |
Notes
References
- "Aarhus Østkredsen". kmdvalg.dk (in Danish). Retrieved 2023-06-04.
- "Forslag til Lov om ændring af lov om valg til Folketinget" (PDF). Folketingstidende. 4 June 1970.
- "Nye valgkredse fordeler stemmerne anderledes". dr.dk (in Danish). Retrieved 2023-06-04.
- "Beretning om nye valgkredse som følge af kommunalreformen" (in Danish). Retrieved 2023-06-04.
- "Det danske valgsystem: Valg til Folketinget". valg.im (in Danish). Retrieved 2023-06-04.
- "65 Aarhus Øst". dataforsyningen.dk (in Danish). Retrieved 2023-06-04.
- "Forslag til Lov om ændring af lov om valg til Folketinget" (PDF). Folketingstidende. 4 June 1970.
- "Valgresultater fra tidligere valg:". kmdvalg (in Danish). Retrieved 2023-06-04.
- "FOLKETINGSVALG TIRSDAG 1. NOVEMBER 2022". valg.im (in Danish). Retrieved 2023-06-27.
- "FOLKETINGSVALG ONSDAG 5. JUNI 2019". valg.im (in Danish). Retrieved 2023-06-27.
- "FOLKETINGSVALG TORSDAG 18. JUNI 2015". valg.im (in Danish). Retrieved 2023-06-27.
- "FOLKETINGSVALG TORSDAG 15. SEPTEMBER 2011". valg.im (in Danish). Retrieved 2023-06-27.
- "Folketingsvalget den 13. november 2007". valg.im (in Danish). Retrieved 2023-06-27.
- "valg2005.book" (PDF). valg.im (in Danish). Retrieved 2023-06-27.
- "BMTABEL" (PDF). valg.im (in Danish). Retrieved 2023-06-27.
- "VALG98" (PDF). valg.im (in Danish). Retrieved 2023-06-27.
- "VALG94" (PDF). valg.im (in Danish). Retrieved 2023-06-27.
- "VALG90" (PDF). valg.im (in Danish). Retrieved 2023-06-27.
- "Folketingsvalget den 10. maj 1988". valg.im (in Danish). Retrieved 2023-06-27.
- "Folketingsvalget den 8.september 1987". dst.dk (in Danish). Retrieved 2023-06-27.
- "Folketingsvalget den 10. januar 1984". dst.dk (in Danish). Retrieved 2023-06-27.
- "Folketingsvalget den 8. december 1981". dst.dk (in Danish). Retrieved 2023-06-27.
- "Folketingsvalget den 23. oktober 1979". dst.dk (in Danish). Retrieved 2023-06-27.
- "Folketingsvalget den 15. februar 1977". dst.dk (in Danish). Retrieved 2023-06-27.
- "Folketingsvalget den 9. januar 1975". dst.dk (in Danish). Retrieved 2023-06-27.
- "Folketingsvalget den 4. december 1973". dst.dk (in Danish). Retrieved 2023-06-27.
- "Folketingsvalget den 21. september 1971 samt folkeafstemningen". dst.dk (in Danish). Retrieved 2023-06-27.
- "EUROPA-PARLAMENTSVALG SØNDAG 26. MAJ 2019". dst.dk (in Danish). Retrieved 2023-07-01.
- "EUROPA-PARLAMENTSVALG SØNDAG 25. MAJ 2014". dst.dk (in Danish). Retrieved 2023-07-01.
- "EUROPA-PARLAMENTSVALG SØNDAG 7. JUNI 2009". dst.dk (in Danish). Retrieved 2023-07-01.
- "EUROPA-PARLAMENTSVALGET DEN 13. JUNI 2004" (PDF). im.dk (in Danish). Retrieved 2023-07-01.
- "VALGET TIL EUROPA-PARLAMENTET DEN 10. JUNI 1999" (PDF). im.dk (in Danish). Retrieved 2023-07-01.
- "VALGET TIL EUROPA-PARLAMENTET DEN 9. JUNI 1994" (PDF). im.dk (in Danish). Retrieved 2023-07-01.
- "Valget til Europa-parlamentet den 15. juni 1989". dst.dk (in Danish). Retrieved 2023-07-01.
- "Valget til Europa-Parlamentet den 14. juni 1984". dst.dk (in Danish). Retrieved 2023-07-01.
- "FOLKEAFSTEMNING ONSDAG 1. JUNI 2022". dst.dk (in Danish). Retrieved 2023-07-05.
- "FOLKEAFSTEMNING TORSDAG 3. DECEMBER 2015". dst.dk (in Danish). Retrieved 2023-07-05.
- "FOLKEAFSTEMNING SØNDAG 25. MAJ 2014". dst.dk (in Danish). Retrieved 2023-07-05.
- "FOLKEAFSTEMNING SØNDAG 7. JUNI 2009". dst.dk (in Danish). Retrieved 2023-07-05.
- "FOLKEAFSTEMNINGEN DEN 28. SEPTEMBER 2000 OM DANMARKS DELTAGELSE I DEN FÆLLES VALUTA" (PDF). valg.im (in Danish). Retrieved 2023-07-05.
- "FOLKEAFSTEMNINGEN DEN 28. MAJ 1998OM DANMARKS TILTRÆDELSE AF AMSTERDAMTRAKTATEN" (PDF). valg.im (in Danish). Retrieved 2023-07-05.
- "FOLKEAFSTEMNINGEN DEN 18. MAJ 1993 OM DANMARKS TILTRÆDELSE AF EDINBURGH-AFGØRELSEN OG MAASTRICHT-TRAKTATEN". dst.dk (in Danish). Retrieved 2023-07-05.
- "Folkeafstemningen den 1. juni 1992 om Danmarks tiltrædelse af traktaten om Den Europæiske Union". dst.dk (in Danish). Retrieved 2023-07-05.
- "Vejledende folkeafstemning torsdag den 27. februar 1986 om Danmarks tiltrædelse af EF- pakken". dst.dk (in Danish). Retrieved 2023-07-05.
- "Folkeafstemningen om Danmarks tiltrædelse af De europæiske Fælleskaber 2. oktober 1972". dst.dk (in Danish). Retrieved 2023-07-05.