Aarhus South (nomination district)
Aarhus South nominating district is one of the 92 nominating districts that exists for Danish elections following the 2007 municipal reform.[3][4][5] It is one of the four nomination districts in Aarhus Municipality, the others being Aarhus West, Aarhus North and Aarhus East.[6] It was established as a constituency in 1895[7] as Aarhus County 3, became Aarhus County 4 in 1915, and became a nomination district in 1920. It obtained its current boundaries and name in 1970.
| Aarhus South | |
|---|---|
| Aarhus Syd | |
| Nomination district constituency for the Folketing | |
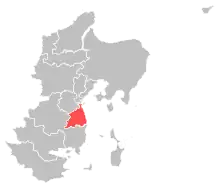 Location of Aarhus South within East Jutland | |
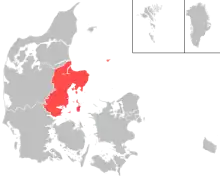 Location of East Jutland within Denmark | |
| Municipalities | Aarhus |
| Constituency | East Jutland |
| Electorate | 58,440 (2022)[1] |
| Current constituency | |
| Created | 1895 (as constituency)[2] 1920 (as nomination district) |
In general elections, the district is a strong area for parties commonly associated with the red bloc, and the Social Democrats has always won the most votes.[8]
General elections results
General elections in the 2020s
| Parties | Vote | |||||
|---|---|---|---|---|---|---|
| Votes | % | + / - | ||||
| Social Democrats | 12,296 | 24.08 | +0.71 | |||
| Venstre | 6,721 | 13.16 | -8.32 | |||
| Green Left | 5,799 | 11.36 | +1.32 | |||
| Liberal Alliance | 5,014 | 9.82 | +6.91 | |||
| Moderates | 4,875 | 9.55 | New | |||
| Red–Green Alliance | 3,723 | 7.29 | -1.33 | |||
| Social Liberals | 3,181 | 6.23 | -6.04 | |||
| The Alternative | 2,652 | 5.19 | +0.96 | |||
| Conservatives | 2,573 | 5.04 | -1.42 | |||
| Denmark Democrats | 1,903 | 3.73 | New | |||
| New Right | 1,096 | 2.15 | +0.31 | |||
| Danish People's Party | 735 | 1.44 | -3.65 | |||
| Independent Greens | 261 | 0.51 | New | |||
| Christian Democrats | 192 | 0.38 | -1.43 | |||
| Jesper Antonsen | 29 | 0.06 | New | |||
| Chresten H. Ibsen | 8 | 0.02 | -0.07 | |||
| Total | 51,058 | |||||
| Source[9] | ||||||
General elections in the 2010s
| Parties | Vote | |||||
|---|---|---|---|---|---|---|
| Votes | % | + / - | ||||
| Social Democrats | 11,975 | 23.37 | -3.85 | |||
| Venstre | 11,010 | 21.48 | +3.68 | |||
| Social Liberals | 6,290 | 12.27 | +5.53 | |||
| Green Left | 5,147 | 10.04 | +5.03 | |||
| Red–Green Alliance | 4,417 | 8.62 | +0.54 | |||
| Conservatives | 3,310 | 6.46 | +3.15 | |||
| Danish People's Party | 2,609 | 5.09 | -7.86 | |||
| The Alternative | 2,168 | 4.23 | -3.89 | |||
| Liberal Alliance | 1,492 | 2.91 | -6.89 | |||
| New Right | 945 | 1.84 | New | |||
| Christian Democrats | 928 | 1.81 | +1.11 | |||
| Stram Kurs | 558 | 1.09 | New | |||
| Klaus Riskær Pedersen Party | 343 | 0.67 | New | |||
| Chresten H. Ibsen | 47 | 0.09 | New | |||
| Hans Schultz | 8 | 0.02 | New | |||
| Total | 51,247 | |||||
| Source[10] | ||||||
| Parties | Vote | |||||
|---|---|---|---|---|---|---|
| Votes | % | + / - | ||||
| Social Democrats | 13,623 | 27.22 | +1.12 | |||
| Venstre | 8,909 | 17.80 | -7.99 | |||
| Danish People's Party | 6,483 | 12.95 | +5.21 | |||
| Liberal Alliance | 4,902 | 9.80 | +4.56 | |||
| The Alternative | 4,064 | 8.12 | New | |||
| Red–Green Alliance | 4,044 | 8.08 | +0.65 | |||
| Social Liberals | 3,375 | 6.74 | -6.41 | |||
| Green Left | 2,509 | 5.01 | -4.50 | |||
| Conservatives | 1,655 | 3.31 | -1.25 | |||
| Christian Democrats | 349 | 0.70 | +0.25 | |||
| Yahya Hassan | 106 | 0.21 | New | |||
| Peter Ymer Nielsen | 21 | 0.04 | New | |||
| Poul Gundersen | 5 | 0.01 | New | |||
| Total | 50,045 | |||||
| Source[11] | ||||||
| Parties | Vote | |||||
|---|---|---|---|---|---|---|
| Votes | % | + / - | ||||
| Social Democrats | 12,908 | 26.10 | -0.80 | |||
| Venstre | 12,752 | 25.79 | +1.90 | |||
| Social Liberals | 6,501 | 13.15 | +5.98 | |||
| Green Left | 4,705 | 9.51 | -6.27 | |||
| Danish People's Party | 3,825 | 7.74 | -1.59 | |||
| Red–Green Alliance | 3,673 | 7.43 | +4.87 | |||
| Liberal Alliance | 2,592 | 5.24 | +1.87 | |||
| Conservatives | 2,253 | 4.56 | -5.72 | |||
| Christian Democrats | 224 | 0.45 | -0.24 | |||
| Janus Kramer Møller | 11 | 0.02 | New | |||
| Ibrahim Gøkhan | 6 | 0.01 | New | |||
| Total | 49,450 | |||||
| Source[12] | ||||||
General elections in the 2000s
| Parties | Vote | |||||
|---|---|---|---|---|---|---|
| Votes | % | + / - | ||||
| Social Democrats | 12,577 | 26.90 | -1.22 | |||
| Venstre | 11,171 | 23.89 | -1.95 | |||
| Green Left | 7,376 | 15.78 | +8.86 | |||
| Conservatives | 4,806 | 10.28 | -1.18 | |||
| Danish People's Party | 4,364 | 9.33 | +0.43 | |||
| Social Liberals | 3,352 | 7.17 | -4.50 | |||
| New Alliance | 1,574 | 3.37 | New | |||
| Red–Green Alliance | 1,198 | 2.56 | -1.79 | |||
| Christian Democrats | 321 | 0.69 | -0.73 | |||
| Jes Krogh | 13 | 0.03 | New | |||
| Total | 46,752 | |||||
| Source[13] | ||||||
| Parties | Vote | |||||
|---|---|---|---|---|---|---|
| Votes | % | + / - | ||||
| Social Democrats | 12,893 | 28.12 | -3.34 | |||
| Venstre | 11,846 | 25.84 | -3.88 | |||
| Social Liberals | 5,350 | 11.67 | +4.96 | |||
| Conservatives | 5,252 | 11.46 | +2.85 | |||
| Danish People's Party | 4,078 | 8.90 | +0.31 | |||
| Green Left | 3,171 | 6.92 | -0.16 | |||
| Red–Green Alliance | 1,992 | 4.35 | +1.37 | |||
| Christian Democrats | 652 | 1.42 | -0.84 | |||
| Centre Democrats | 469 | 1.02 | -1.15 | |||
| Minority Party | 132 | 0.29 | New | |||
| Janus Kramer Møller | 7 | 0.02 | New | |||
| Total | 45,842 | |||||
| Source[14] | ||||||
| Parties | Vote | |||||
|---|---|---|---|---|---|---|
| Votes | % | + / - | ||||
| Social Democrats | 14,454 | 31.46 | -6.17 | |||
| Venstre | 13,655 | 29.72 | +6.27 | |||
| Conservatives | 3,954 | 8.61 | +0.17 | |||
| Danish People's Party | 3,948 | 8.59 | +3.21 | |||
| Green Left | 3,251 | 7.08 | -1.64 | |||
| Social Liberals | 3,085 | 6.71 | +2.03 | |||
| Red–Green Alliance | 1,367 | 2.98 | -0.48 | |||
| Christian People's Party | 1,037 | 2.26 | +0.19 | |||
| Centre Democrats | 996 | 2.17 | -2.42 | |||
| Progress Party | 180 | 0.39 | -0.79 | |||
| Lars Bang | 17 | 0.04 | New | |||
| Total | 45,944 | |||||
| Source[15] | ||||||
General elections in the 1990s
| Parties | Vote | |||||
|---|---|---|---|---|---|---|
| Votes | % | + / - | ||||
| Social Democrats | 16,929 | 37.63 | +4.47 | |||
| Venstre | 10,549 | 23.45 | +2.27 | |||
| Green Left | 3,921 | 8.72 | +0.65 | |||
| Conservatives | 3,795 | 8.44 | -5.69 | |||
| Danish People's Party | 2,422 | 5.38 | New | |||
| Social Liberals | 2,104 | 4.68 | -0.32 | |||
| Centre Democrats | 2,064 | 4.59 | +1.84 | |||
| Red–Green Alliance | 1,557 | 3.46 | +0.13 | |||
| Christian People's Party | 930 | 2.07 | +0.42 | |||
| Progress Party | 529 | 1.18 | -3.38 | |||
| Democratic Renewal | 176 | 0.39 | New | |||
| John Juhler | 11 | 0.02 | New | |||
| Total | 44,987 | |||||
| Source[16] | ||||||
| Parties | Vote | |||||
|---|---|---|---|---|---|---|
| Votes | % | + / - | ||||
| Social Democrats | 14,710 | 33.16 | -1.42 | |||
| Venstre | 9,396 | 21.18 | +4.66 | |||
| Conservatives | 6,266 | 14.13 | -0.51 | |||
| Green Left | 3,581 | 8.07 | -3.47 | |||
| Jacob Haugaard | 2,722 | 6.14 | +3.36 | |||
| Social Liberals | 2,216 | 5.00 | +0.91 | |||
| Progress Party | 2,021 | 4.56 | -0.19 | |||
| Red–Green Alliance | 1,478 | 3.33 | +0.99 | |||
| Centre Democrats | 1,221 | 2.75 | -1.87 | |||
| Christian People's Party | 734 | 1.65 | -0.08 | |||
| Søren Boelskifte | 12 | 0.03 | New | |||
| Bjarne S. Landsfeldt | 1 | 0.00 | New | |||
| Total | 44,358 | |||||
| Source[17] | ||||||
| Parties | Vote | |||||
|---|---|---|---|---|---|---|
| Votes | % | + / - | ||||
| Social Democrats | 14,471 | 34.58 | +5.92 | |||
| Venstre | 6,912 | 16.52 | +6.01 | |||
| Conservatives | 6,127 | 14.64 | -5.43 | |||
| Green Left | 4,829 | 11.54 | -5.66 | |||
| Progress Party | 1,988 | 4.75 | -1.35 | |||
| Centre Democrats | 1,934 | 4.62 | +0.49 | |||
| Social Liberals | 1,711 | 4.09 | -2.09 | |||
| Jacob Haugaard | 1,165 | 2.78 | +1.58 | |||
| Red–Green Alliance | 979 | 2.34 | New | |||
| Christian People's Party | 724 | 1.73 | +0.20 | |||
| The Greens | 395 | 0.94 | -0.44 | |||
| Common Course | 329 | 0.79 | -0.15 | |||
| Justice Party of Denmark | 279 | 0.67 | New | |||
| Total | 41,843 | |||||
| Source[18] | ||||||
General elections in the 1980s
| Parties | Vote | |||||
|---|---|---|---|---|---|---|
| Votes | % | + / - | ||||
| Social Democrats | 11,997 | 28.66 | +1.45 | |||
| Conservatives | 8,402 | 20.07 | -0.35 | |||
| Green Left | 7,197 | 17.20 | -1.63 | |||
| Venstre | 4,398 | 10.51 | +1.88 | |||
| Social Liberals | 2,586 | 6.18 | -1.38 | |||
| Progress Party | 2,554 | 6.10 | +2.75 | |||
| Centre Democrats | 1,730 | 4.13 | -0.16 | |||
| Christian People's Party | 642 | 1.53 | -0.44 | |||
| The Greens | 578 | 1.38 | +0.09 | |||
| Jacob Haugaard | 502 | 1.20 | +0.46 | |||
| Communist Party of Denmark | 463 | 1.11 | 0.00 | |||
| Left Socialists | 405 | 0.97 | -1.62 | |||
| Common Course | 394 | 0.94 | -0.27 | |||
| Finn Mikkelsen | 4 | 0.01 | New | |||
| Bruno Nielsen-Boreas | 3 | 0.01 | New | |||
| Total | 41,855 | |||||
| Source[19] | ||||||
| Parties | Vote | |||||
|---|---|---|---|---|---|---|
| Votes | % | + / - | ||||
| Social Democrats | 11,337 | 27.21 | -2.06 | |||
| Conservatives | 8,508 | 20.42 | -3.10 | |||
| Green Left | 7,844 | 18.83 | +3.12 | |||
| Venstre | 3,596 | 8.63 | -1.47 | |||
| Social Liberals | 3,149 | 7.56 | +1.66 | |||
| Centre Democrats | 1,786 | 4.29 | +0.04 | |||
| Progress Party | 1,394 | 3.35 | +1.50 | |||
| Left Socialists | 1,078 | 2.59 | -2.19 | |||
| Christian People's Party | 819 | 1.97 | +0.30 | |||
| The Greens | 536 | 1.29 | New | |||
| Common Course | 504 | 1.21 | New | |||
| Communist Party of Denmark | 461 | 1.11 | +0.35 | |||
| Jacob Haugaard | 308 | 0.74 | +0.46 | |||
| Justice Party of Denmark | 255 | 0.61 | -1.21 | |||
| Humanist Party | 50 | 0.12 | New | |||
| Socialist Workers Party | 20 | 0.05 | 0.00 | |||
| Marxist–Leninists Party | 17 | 0.04 | 0.00 | |||
| Henning Brønd-Nielsen | 0 | 0.00 | New | |||
| Total | 41,662 | |||||
| Source[20] | ||||||
| Parties | Vote | |||||
|---|---|---|---|---|---|---|
| Votes | % | + / - | ||||
| Social Democrats | 11,895 | 29.27 | -2.60 | |||
| Conservatives | 9,556 | 23.52 | +8.15 | |||
| Green Left | 6,383 | 15.71 | +0.04 | |||
| Venstre | 4,103 | 10.10 | +1.20 | |||
| Social Liberals | 2,397 | 5.90 | +0.87 | |||
| Left Socialists | 1,943 | 4.78 | +0.87 | |||
| Centre Democrats | 1,725 | 4.25 | -4.46 | |||
| Progress Party | 752 | 1.85 | -3.85 | |||
| Justice Party of Denmark | 739 | 1.82 | +0.15 | |||
| Christian People's Party | 678 | 1.67 | +0.11 | |||
| Communist Party of Denmark | 310 | 0.76 | -0.49 | |||
| Jacob Haugaard | 115 | 0.28 | +0.07 | |||
| Socialist Workers Party | 21 | 0.05 | 0.00 | |||
| Marxist–Leninists Party | 15 | 0.04 | New | |||
| Total | 40,632 | |||||
| Source[21] | ||||||
| Parties | Vote | |||||
|---|---|---|---|---|---|---|
| Votes | % | + / - | ||||
| Social Democrats | 12,182 | 31.87 | -7.29 | |||
| Green Left | 5,991 | 15.67 | +6.44 | |||
| Conservatives | 5,873 | 15.37 | +0.72 | |||
| Venstre | 3,402 | 8.90 | -0.97 | |||
| Centre Democrats | 3,329 | 8.71 | +5.82 | |||
| Progress Party | 2,178 | 5.70 | -0.43 | |||
| Social Liberals | 1,923 | 5.03 | -0.34 | |||
| Left Socialists | 1,495 | 3.91 | -0.98 | |||
| Justice Party of Denmark | 639 | 1.67 | -1.54 | |||
| Christian People's Party | 598 | 1.56 | -0.40 | |||
| Communist Party of Denmark | 476 | 1.25 | -0.77 | |||
| Jacob Haugaard | 82 | 0.21 | -0.06 | |||
| Communist Workers Party | 29 | 0.08 | -0.27 | |||
| Socialist Workers Party | 21 | 0.05 | New | |||
| Lars Michaelsen | 5 | 0.01 | New | |||
| Henrik Christensen | 0 | 0.00 | New | |||
| Total | 38,223 | |||||
| Source[22] | ||||||
General elections in the 1970s
| Parties | Vote | |||||
|---|---|---|---|---|---|---|
| Votes | % | + / - | ||||
| Social Democrats | 14,899 | 39.16 | -1.11 | |||
| Conservatives | 5,574 | 14.65 | +4.23 | |||
| Venstre | 3,755 | 9.87 | +0.87 | |||
| Green Left | 3,510 | 9.23 | +3.66 | |||
| Progress Party | 2,332 | 6.13 | -3.65 | |||
| Social Liberals | 2,045 | 5.37 | +2.10 | |||
| Left Socialists | 1,861 | 4.89 | +0.74 | |||
| Justice Party of Denmark | 1,221 | 3.21 | -0.54 | |||
| Centre Democrats | 1,101 | 2.89 | -3.38 | |||
| Communist Party of Denmark | 767 | 2.02 | -1.85 | |||
| Christian People's Party | 744 | 1.96 | -0.90 | |||
| Communist Workers Party | 134 | 0.35 | New | |||
| Jacob Haugaard | 104 | 0.27 | New | |||
| Total | 38,047 | |||||
| Source[23] | ||||||
| Parties | Vote | |||||
|---|---|---|---|---|---|---|
| Votes | % | + / - | ||||
| Social Democrats | 14,835 | 40.27 | +7.44 | |||
| Conservatives | 3,840 | 10.42 | +3.92 | |||
| Progress Party | 3,603 | 9.78 | +0.26 | |||
| Venstre | 3,316 | 9.00 | -11.56 | |||
| Centre Democrats | 2,308 | 6.27 | +4.24 | |||
| Green Left | 2,050 | 5.57 | -0.46 | |||
| Left Socialists | 1,528 | 4.15 | +1.12 | |||
| Communist Party of Denmark | 1,424 | 3.87 | -0.41 | |||
| Justice Party of Denmark | 1,381 | 3.75 | +1.33 | |||
| Social Liberals | 1,205 | 3.27 | -3.97 | |||
| Christian People's Party | 1,052 | 2.86 | -2.70 | |||
| Pensioners' Party | 284 | 0.77 | New | |||
| Tommy Nielsen | 9 | 0.02 | New | |||
| Total | 36,835 | |||||
| Source[24] | ||||||
| Parties | Vote | |||||
|---|---|---|---|---|---|---|
| Votes | % | + / - | ||||
| Social Democrats | 12,021 | 32.83 | +0.88 | |||
| Venstre | 7,528 | 20.56 | +10.22 | |||
| Progress Party | 3,486 | 9.52 | +8.12 | |||
| Social Liberals | 2,650 | 7.24 | -5.09 | |||
| Conservatives | 2,379 | 6.50 | -6.15 | |||
| Green Left | 2,209 | 6.03 | -2.38 | |||
| Christian People's Party | 2,035 | 5.56 | +1.37 | |||
| Communist Party of Denmark | 1,567 | 4.28 | -0.20 | |||
| Left Socialists | 1,108 | 3.03 | +0.87 | |||
| Justice Party of Denmark | 885 | 2.42 | -2.26 | |||
| Centre Democrats | 743 | 2.03 | -5.34 | |||
| Elmer Mariager | 5 | 0.01 | New | |||
| Total | 36,616 | |||||
| Source[25] | ||||||
| Parties | Vote | |||||
|---|---|---|---|---|---|---|
| Votes | % | + / - | ||||
| Social Democrats | 10,465 | 31.95 | -6.04 | |||
| Conservatives | 4,145 | 12.65 | -6.07 | |||
| Social Liberals | 4,039 | 12.33 | -3.35 | |||
| Venstre | 3,387 | 10.34 | -1.03 | |||
| Green Left | 2,755 | 8.41 | -1.12 | |||
| Centre Democrats | 2,413 | 7.37 | New | |||
| Justice Party of Denmark | 1,533 | 4.68 | +2.48 | |||
| Communist Party of Denmark | 1,467 | 4.48 | +3.22 | |||
| Christian People's Party | 1,374 | 4.19 | +2.69 | |||
| Left Socialists | 709 | 2.16 | +0.42 | |||
| Progress Party | 457 | 1.40 | New | |||
| John Bove | 14 | 0.04 | New | |||
| Total | 32,758 | |||||
| Source[26] | ||||||
| Parties | Vote | |||||
|---|---|---|---|---|---|---|
| Votes | % | + / - | ||||
| Social Democrats | 13,410 | 37.99 | +4.25 | |||
| Conservatives | 6,608 | 18.72 | -10.78 | |||
| Social Liberals | 5,536 | 15.68 | +0.47 | |||
| Venstre | 4,013 | 11.37 | +2.40 | |||
| Green Left | 3,365 | 9.53 | +3.06 | |||
| Justice Party of Denmark | 777 | 2.20 | +1.54 | |||
| Left Socialists | 614 | 1.74 | -0.17 | |||
| Christian People's Party | 531 | 1.50 | New | |||
| Communist Party of Denmark | 443 | 1.26 | +0.43 | |||
| Total | 35,297 | |||||
| Source[27] | ||||||
General elections in the 1960s
| Parties | Vote | |||||
|---|---|---|---|---|---|---|
| Votes | % | + / - | ||||
| Social Democrats | 18,354 | 33.74 | -3.57 | |||
| Conservatives | 16,048 | 29.50 | +0.60 | |||
| Social Liberals | 8,272 | 15.21 | +8.52 | |||
| Venstre | 4,880 | 8.97 | -0.41 | |||
| Green Left | 3,519 | 6.47 | -4.38 | |||
| Liberal Centre | 1,149 | 2.11 | -1.87 | |||
| Left Socialists | 1,039 | 1.91 | New | |||
| Communist Party of Denmark | 449 | 0.83 | +0.14 | |||
| Justice Party of Denmark | 361 | 0.66 | +0.04 | |||
| Independent Party | 322 | 0.59 | -0.99 | |||
| Total | 54,393 | |||||
| Source[28] | ||||||
| Parties | Vote | |||||
|---|---|---|---|---|---|---|
| Votes | % | + / - | ||||
| Social Democrats | 19,794 | 37.31 | -4.73 | |||
| Conservatives | 15,331 | 28.90 | -2.74 | |||
| Green Left | 5,759 | 10.85 | +5.35 | |||
| Venstre | 4,977 | 9.38 | -1.05 | |||
| Social Liberals | 3,548 | 6.69 | +3.47 | |||
| Liberal Centre | 2,112 | 3.98 | New | |||
| Independent Party | 840 | 1.58 | -1.61 | |||
| Communist Party of Denmark | 364 | 0.69 | -0.40 | |||
| Justice Party of Denmark | 329 | 0.62 | -0.74 | |||
| Total | 53,054 | |||||
| Source[29] | ||||||
| Parties | Vote | |||||
|---|---|---|---|---|---|---|
| Votes | % | + / - | ||||
| Social Democrats | 20,918 | 42.04 | -2.84 | |||
| Conservatives | 15,743 | 31.64 | +2.37 | |||
| Venstre | 5,187 | 10.43 | +1.38 | |||
| Green Left | 2,735 | 5.50 | -0.36 | |||
| Social Liberals | 1,601 | 3.22 | -0.02 | |||
| Independent Party | 1,585 | 3.19 | -1.23 | |||
| Justice Party of Denmark | 675 | 1.36 | -1.02 | |||
| Communist Party of Denmark | 544 | 1.09 | +0.18 | |||
| Danish Unity | 393 | 0.79 | New | |||
| Peace Politics People's Party | 373 | 0.75 | New | |||
| Total | 49,754 | |||||
| Source[30] | ||||||
| Parties | Vote | |||||
|---|---|---|---|---|---|---|
| Votes | % | + / - | ||||
| Social Democrats | 19,276 | 44.88 | +0.81 | |||
| Conservatives | 12,571 | 29.27 | +3.26 | |||
| Venstre | 3,886 | 9.05 | -2.82 | |||
| Green Left | 2,515 | 5.86 | New | |||
| Independent Party | 1,899 | 4.42 | -0.04 | |||
| Social Liberals | 1,391 | 3.24 | -1.76 | |||
| Justice Party of Denmark | 1,023 | 2.38 | -3.55 | |||
| Communist Party of Denmark | 390 | 0.91 | -1.75 | |||
| Total | 42,951 | |||||
| Source[31] | ||||||
General elections in the 1950s
| Parties | Vote | |||||
|---|---|---|---|---|---|---|
| Votes | % | + / - | ||||
| Social Democrats | 16,526 | 44.07 | -3.01 | |||
| Conservatives | 9,752 | 26.01 | -0.64 | |||
| Venstre | 4,452 | 11.87 | +2.26 | |||
| Justice Party of Denmark | 2,223 | 5.93 | +2.39 | |||
| Social Liberals | 1,875 | 5.00 | +0.82 | |||
| Independent Party | 1,671 | 4.46 | -0.51 | |||
| Communist Party of Denmark | 999 | 2.66 | -1.31 | |||
| Total | 37,498 | |||||
| Source[32] | ||||||
September 1953 Danish Folketing election
| Parties | Vote | |||||
|---|---|---|---|---|---|---|
| Votes | % | + / - | ||||
| Social Democrats | 16,136 | 47.08 | +2.44 | |||
| Conservatives | 9,135 | 26.65 | -3.13 | |||
| Venstre | 3,295 | 9.61 | +0.18 | |||
| Independent Party | 1,705 | 4.97 | New | |||
| Social Liberals | 1,433 | 4.18 | -0.85 | |||
| Communist Party of Denmark | 1,360 | 3.97 | -0.46 | |||
| Justice Party of Denmark | 1,212 | 3.54 | -1.54 | |||
| Total | 34,276 | |||||
| Source[33] | ||||||
April 1953 Danish Folketing election
| Parties | Vote | |||||
|---|---|---|---|---|---|---|
| Votes | % | + / - | ||||
| Social Democrats | 14,398 | 44.64 | -1.12 | |||
| Conservatives | 9,605 | 29.78 | -0.70 | |||
| Venstre | 3,041 | 9.43 | +1.32 | |||
| Justice Party of Denmark | 1,639 | 5.08 | -2.87 | |||
| Social Liberals | 1,621 | 5.03 | +1.26 | |||
| Communist Party of Denmark | 1,428 | 4.43 | +0.50 | |||
| Danish Unity | 525 | 1.63 | New | |||
| Total | 32,257 | |||||
| Source[34] | ||||||
1950 Danish Folketing election
| Parties | Vote | |||||
|---|---|---|---|---|---|---|
| Votes | % | + / - | ||||
| Social Democrats | 14,514 | 45.76 | -1.81 | |||
| Conservatives | 9,667 | 30.48 | +4.28 | |||
| Venstre | 2,574 | 8.11 | -1.31 | |||
| Justice Party of Denmark | 2,522 | 7.95 | +2.81 | |||
| Communist Party of Denmark | 1,248 | 3.93 | -3.09 | |||
| Social Liberals | 1,195 | 3.77 | +0.75 | |||
| Total | 31,720 | |||||
| Source[35] | ||||||
General elections in the 1940s
1947 Danish Folketing election
| Parties | Vote | |||||
|---|---|---|---|---|---|---|
| Votes | % | + / - | ||||
| Social Democrats | 8,466 | 47.57 | +7.96 | |||
| Conservatives | 4,662 | 26.20 | -7.22 | |||
| Venstre | 1,677 | 9.42 | +4.17 | |||
| Communist Party of Denmark | 1,249 | 7.02 | -7.38 | |||
| Justice Party of Denmark | 915 | 5.14 | +3.85 | |||
| Social Liberals | 538 | 3.02 | +0.94 | |||
| Danish Unity | 290 | 1.63 | -2.33 | |||
| Total | 17,797 | |||||
| Source[36] | ||||||
1945 Danish Folketing election
| Parties | Vote | |||||
|---|---|---|---|---|---|---|
| Votes | % | + / - | ||||
| Social Democrats | 7,077 | 39.61 | -14.24 | |||
| Conservatives | 5,971 | 33.42 | +2.15 | |||
| Communist Party of Denmark | 2,572 | 14.40 | New | |||
| Venstre | 938 | 5.25 | -1.70 | |||
| Danish Unity | 708 | 3.96 | +2.51 | |||
| Social Liberals | 371 | 2.08 | -0.51 | |||
| Justice Party of Denmark | 230 | 1.29 | -0.36 | |||
| Total | 17,867 | |||||
| Source[37] | ||||||
1943 Danish Folketing election
| Parties | Vote | |||||
|---|---|---|---|---|---|---|
| Votes | % | + / - | ||||
| Social Democrats | 16,805 | 53.85 | +3.01 | |||
| Conservatives | 9,757 | 31.27 | +0.80 | |||
| Venstre | 2,169 | 6.95 | +1.02 | |||
| Social Liberals | 808 | 2.59 | -0.42 | |||
| National Socialist Workers' Party of Denmark | 621 | 1.99 | +0.65 | |||
| Justice Party of Denmark | 515 | 1.65 | -0.30 | |||
| Danish Unity | 451 | 1.45 | +1.00 | |||
| Farmers' Party | 79 | 0.25 | -0.57 | |||
| Total | 31,205 | |||||
| Source[38] | ||||||
General elections in the 1930s
1939 Danish Folketing election
| Parties | Vote | |||||
|---|---|---|---|---|---|---|
| Votes | % | + / - | ||||
| Social Democrats | 12,458 | 50.84 | -4.32 | |||
| Conservatives | 7,465 | 30.47 | +1.18 | |||
| Venstre | 1,454 | 5.93 | -0.06 | |||
| Social Liberals | 738 | 3.01 | -0.06 | |||
| Communist Party of Denmark | 709 | 2.89 | +1.34 | |||
| National Cooperation | 561 | 2.29 | New | |||
| Justice Party of Denmark | 479 | 1.95 | -1.15 | |||
| National Socialist Workers' Party of Denmark | 328 | 1.34 | +0.42 | |||
| Farmers' Party | 200 | 0.82 | -0.09 | |||
| Danish Unity | 111 | 0.45 | New | |||
| Total | 24,503 | |||||
| Source[39] | ||||||
1935 Danish Folketing election
| Parties | Vote | |||||
|---|---|---|---|---|---|---|
| Votes | % | + / - | ||||
| Social Democrats | 12,542 | 55.16 | -4.30 | |||
| Conservatives | 6,660 | 29.29 | +5.31 | |||
| Venstre | 1,363 | 5.99 | -3.54 | |||
| Justice Party of Denmark | 705 | 3.10 | -0.13 | |||
| Social Liberals | 697 | 3.07 | +0.14 | |||
| Communist Party of Denmark | 353 | 1.55 | +0.67 | |||
| National Socialist Workers' Party of Denmark | 210 | 0.92 | New | |||
| Independent People's Party | 208 | 0.91 | New | |||
| Total | 22,738 | |||||
| Source[40] | ||||||
1932 Danish Folketing election
| Parties | Vote | |||||
|---|---|---|---|---|---|---|
| Votes | % | + / - | ||||
| Social Democrats | 11,258 | 59.46 | -6.22 | |||
| Conservatives | 4,540 | 23.98 | -2.93 | |||
| Venstre | 1,804 | 9.53 | +6.80 | |||
| Justice Party of Denmark | 612 | 3.23 | +1.25 | |||
| Social Liberals | 554 | 2.93 | +0.61 | |||
| Communist Party of Denmark | 167 | 0.88 | +0.50 | |||
| Total | 18,935 | |||||
| Source[41] | ||||||
General elections in the 1920s
1929 Danish Folketing election
| Parties | Vote | |||||
|---|---|---|---|---|---|---|
| Votes | % | + / - | ||||
| Social Democrats | 5,807 | 65.68 | +9.67 | |||
| Conservatives | 2,379 | 26.91 | +0.94 | |||
| Venstre | 241 | 2.73 | -8.60 | |||
| Social Liberals | 205 | 2.32 | -0.35 | |||
| Justice Party of Denmark | 175 | 1.98 | -1.36 | |||
| Total | 8,841 | |||||
| Source[42] | ||||||
1926 Danish Folketing election
| Parties | Vote | |||||
|---|---|---|---|---|---|---|
| Votes | % | + / - | ||||
| Social Democrats | 8,430 | 56.01 | +2.07 | |||
| Conservatives | 3,909 | 25.97 | +0.16 | |||
| Venstre | 1,706 | 11.33 | -0.70 | |||
| Justice Party of Denmark | 502 | 3.34 | -0.10 | |||
| Social Liberals | 402 | 2.67 | -0.97 | |||
| Communist Party of Denmark | 102 | 0.68 | -0.36 | |||
| Total | 15,051 | |||||
| Source[43] | ||||||
1924 Danish Folketing election
| Parties | Vote | |||||
|---|---|---|---|---|---|---|
| Votes | % | + / - | ||||
| Social Democrats | 7,666 | 53.94 | +1.91 | |||
| Conservatives | 3,668 | 25.81 | +2.18 | |||
| Venstre | 1,710 | 12.03 | -4.54 | |||
| Social Liberals | 518 | 3.64 | -0.93 | |||
| Justice Party of Denmark | 489 | 3.44 | New | |||
| Communist Party of Denmark | 148 | 1.04 | New | |||
| Farmer Party | 14 | 0.10 | New | |||
| Total | 14,213 | |||||
| Source[44] | ||||||
September 1920 Danish Folketing election
| Parties | Vote | |||||
|---|---|---|---|---|---|---|
| Votes | % | + / - | ||||
| Social Democrats | 6,420 | 52.03 | +2.56 | |||
| Conservatives | 2,915 | 23.63 | -1.15 | |||
| Venstre | 2,045 | 16.57 | -1.63 | |||
| Social Liberals | 564 | 4.57 | -0.29 | |||
| Industry Party | 325 | 2.63 | +0.38 | |||
| Danish Left Socialist Party | 69 | 0.56 | New | |||
| Total | 12,338 | |||||
| Source[45] | ||||||
July 1920 Danish Folketing election
| Parties | Vote | |||||
|---|---|---|---|---|---|---|
| Votes | % | + / - | ||||
| Social Democrats | 5,078 | 49.47 | +1.30 | |||
| Conservatives | 2,544 | 24.78 | -1.17 | |||
| Venstre | 1,868 | 18.20 | +1.46 | |||
| Social Liberals | 499 | 4.86 | -1.14 | |||
| Industry Party | 231 | 2.25 | -0.89 | |||
| C. V. Christensen | 45 | 0.44 | New | |||
| Total | 10,265 | |||||
| Source[46] | ||||||
April 1920 Danish Folketing election
| Parties | Vote | |||||
|---|---|---|---|---|---|---|
| Votes | % | |||||
| Social Democrats | 5,303 | 48.17 | ||||
| Conservatives | 2,857 | 25.95 | ||||
| Venstre | 1,843 | 16.74 | ||||
| Social Liberals | 661 | 6.6 | ||||
| Industry Party | 346 | 3.14 | ||||
| Total | 11,010 | |||||
| Source[47] | ||||||
European Parliament elections results
2019 European Parliament election in Denmark
| Parties | Vote | |||||
|---|---|---|---|---|---|---|
| Votes | % | + / - | ||||
| Venstre | 8,821 | 20.47 | +4.25 | |||
| Social Democrats | 8,763 | 20.33 | -0.09 | |||
| Green Left | 7,683 | 17.83 | +2.45 | |||
| Social Liberals | 5,533 | 12.84 | +3.61 | |||
| Danish People's Party | 2,678 | 6.21 | -12.79 | |||
| Conservatives | 2,608 | 6.05 | -1.56 | |||
| Red–Green Alliance | 2,581 | 5.99 | New | |||
| The Alternative | 2,066 | 4.79 | New | |||
| People's Movement against the EU | 1,286 | 2.98 | -5.60 | |||
| Liberal Alliance | 1,080 | 2.51 | -1.06 | |||
| Total | 43,099 | |||||
| Source[48] | ||||||
2014 European Parliament election in Denmark
| Parties | Vote | |||||
|---|---|---|---|---|---|---|
| Votes | % | + / - | ||||
| Social Democrats | 6,975 | 20.42 | -4.45 | |||
| Danish People's Party | 6,491 | 19.00 | +7.35 | |||
| Venstre | 5,540 | 16.22 | -2.30 | |||
| Green Left | 5,253 | 15.38 | -3.83 | |||
| Social Liberals | 3,152 | 9.23 | +3.99 | |||
| People's Movement against the EU | 2,929 | 8.58 | +1.78 | |||
| Conservatives | 2,598 | 7.61 | -2.82 | |||
| Liberal Alliance | 1,219 | 3.57 | +2.75 | |||
| Total | 34,157 | |||||
| Source[49] | ||||||
2009 European Parliament election in Denmark
| Parties | Vote | |||||
|---|---|---|---|---|---|---|
| Votes | % | + / - | ||||
| Social Democrats | 8,650 | 24.87 | -6.96 | |||
| Green Left | 6,681 | 19.21 | +8.15 | |||
| Venstre | 6,443 | 18.52 | +2.29 | |||
| Danish People's Party | 4,053 | 11.65 | +6.17 | |||
| Conservatives | 3,629 | 10.43 | -0.86 | |||
| People's Movement against the EU | 2,365 | 6.80 | +1.95 | |||
| Social Liberals | 1,824 | 5.24 | -3.23 | |||
| June Movement | 855 | 2.46 | -7.38 | |||
| Liberal Alliance | 285 | 0.82 | New | |||
| Total | 34,785 | |||||
| Source[50] | ||||||
2004 European Parliament election in Denmark
| Parties | Vote | |||||
|---|---|---|---|---|---|---|
| Votes | % | + / - | ||||
| Social Democrats | 8,577 | 31.83 | +16.81 | |||
| Venstre | 4,375 | 16.23 | -5.37 | |||
| Conservatives | 3,043 | 11.29 | +3.28 | |||
| Green Left | 2,980 | 11.06 | +2.00 | |||
| June Movement | 2,653 | 9.84 | -7.78 | |||
| Social Liberals | 2,282 | 8.47 | -2.56 | |||
| Danish People's Party | 1,476 | 5.48 | +0.39 | |||
| People's Movement against the EU | 1,306 | 4.85 | -2.20 | |||
| Christian Democrats | 257 | 0.95 | -0.61 | |||
| Total | 26,949 | |||||
| Source[51] | ||||||
1999 European Parliament election in Denmark
| Parties | Vote | |||||
|---|---|---|---|---|---|---|
| Votes | % | + / - | ||||
| Venstre | 6,011 | 21.60 | +5.81 | |||
| June Movement | 4,904 | 17.62 | -0.62 | |||
| Social Democrats | 4,180 | 15.02 | +1.62 | |||
| Social Liberals | 3,070 | 11.03 | +2.27 | |||
| Green Left | 2,522 | 9.06 | -1.98 | |||
| Conservatives | 2,228 | 8.01 | -10.40 | |||
| People's Movement against the EU | 1,962 | 7.05 | -3.41 | |||
| Danish People's Party | 1,416 | 5.09 | New | |||
| Centre Democrats | 1,104 | 3.97 | +3.09 | |||
| Christian Democrats | 435 | 1.56 | +0.90 | |||
| Progress Party | 115 | 0.41 | -1.94 | |||
| Total | 27,832 | |||||
| Source[52] | ||||||
1994 European Parliament election in Denmark
| Parties | Vote | |||||
|---|---|---|---|---|---|---|
| Votes | % | + / - | ||||
| Conservatives | 5,418 | 18.41 | +3.83 | |||
| June Movement | 5,368 | 18.24 | New | |||
| Venstre | 4,647 | 15.79 | +4.01 | |||
| Social Democrats | 3,943 | 13.40 | -6.97 | |||
| Green Left | 3,250 | 11.04 | -1.31 | |||
| People's Movement against the EU | 3,077 | 10.46 | -13.62 | |||
| Social Liberals | 2,579 | 8.76 | +5.34 | |||
| Progress Party | 692 | 2.35 | -2.00 | |||
| Centre Democrats | 259 | 0.88 | -6.20 | |||
| Christian Democrats | 195 | 0.66 | -1.32 | |||
| Total | 29,428 | |||||
| Source[53] | ||||||
1989 European Parliament election in Denmark
| Parties | Vote | |||||
|---|---|---|---|---|---|---|
| Votes | % | + / - | ||||
| People's Movement against the EU | 5,712 | 24.08 | -1.02 | |||
| Social Democrats | 4,832 | 20.37 | +2.79 | |||
| Conservatives | 3,458 | 14.58 | -8.04 | |||
| Green Left | 2,928 | 12.35 | +0.27 | |||
| Venstre | 2,794 | 11.78 | +4.54 | |||
| Centre Democrats | 1,679 | 7.08 | +0.69 | |||
| Progress Party | 1,032 | 4.35 | +1.87 | |||
| Social Liberals | 812 | 3.42 | +0.54 | |||
| Christian Democrats | 470 | 1.98 | +0.41 | |||
| Total | 23,717 | |||||
| Source[54] | ||||||
1984 European Parliament election in Denmark
| Parties | Vote | |||||
|---|---|---|---|---|---|---|
| Votes | % | |||||
| People's Movement against the EU | 6,598 | 25.10 | ||||
| Conservatives | 5,944 | 22.62 | ||||
| Social Democrats | 4,621 | 17.58 | ||||
| Green Left | 3,176 | 12.08 | ||||
| Venstre | 1,904 | 7.24 | ||||
| Centre Democrats | 1,679 | 6.39 | ||||
| Social Liberals | 757 | 2.88 | ||||
| Progress Party | 651 | 2.48 | ||||
| Left Socialists | 539 | 2.05 | ||||
| Christian Democrats | 413 | 1.57 | ||||
| Total | 26,282 | |||||
| Source[55] | ||||||
Referendums
2022 Danish European Union opt-out referendum[56]
| Option | Votes | % |
|---|---|---|
| ✓ YES | 30,136 | 74.55 |
| X NO | 10,286 | 25.45 |
2015 Danish European Union opt-out referendum[57]
| Option | Votes | % |
|---|---|---|
| ✓ YES | 22,925 | 54.72 |
| X NO | 18,969 | 45.28 |
2014 Danish Unified Patent Court membership referendum[58]
| Option | Votes | % |
|---|---|---|
| ✓ YES | 21,451 | 64.97 |
| X NO | 11,567 | 35.03 |
2009 Danish Act of Succession referendum[59]
| Option | Votes | % |
|---|---|---|
| ✓ YES | 27,292 | 87.36 |
| X NO | 3,948 | 12.64 |
2000 Danish euro referendum[60]
| Option | Votes | % |
|---|---|---|
| ✓ YES | 23,937 | 52.80 |
| X NO | 21,402 | 47.20 |
1998 Danish Amsterdam Treaty referendum[61]
| Option | Votes | % |
|---|---|---|
| ✓ YES | 23,466 | 58.83 |
| X NO | 16,423 | 41.17 |
1993 Danish Maastricht Treaty referendum[62]
| Option | Votes | % |
|---|---|---|
| ✓ YES | 25,523 | 57.95 |
| X NO | 18,520 | 42.05 |
1992 Danish Maastricht Treaty referendum[63]
| Option | Votes | % |
|---|---|---|
| X NO | 21,520 | 50.69 |
| ✓ YES | 20,932 | 49.31 |
1986 Danish Single European Act referendum[64]
| Option | Votes | % |
|---|---|---|
| ✓ YES | 18,518 | 51.47 |
| X NO | 17,457 | 48.53 |
1972 Danish European Communities membership referendum[65]
| Option | Votes | % |
|---|---|---|
| ✓ YES | 22,548 | 60.19 |
| X NO | 14,916 | 39.81 |
1953 Danish constitutional and electoral age referendum[66]
| Option | Votes | % |
|---|---|---|
| ✓ YES | 17,551 | 78.00 |
| X NO | 4,950 | 22.00 |
| 21 years | 11,625 | 50.03 |
| 23 years | 11,610 | 49.97 |
1939 Danish constitutional referendum[67]
| Option | Votes | % |
|---|---|---|
| ✓ YES | 17,509 | 94.39 |
| X NO | 1,040 | 5.61 |
References
- "Aarhus sydkredsen". kmdvalg.dk (in Danish). Retrieved 2023-06-04.
- "Forslag til Lov om Valg til Rigsdagen". Rigsdagstidende. 1894–95: Tillæg C, spalte 7 ff.
- "Nye valgkredse fordeler stemmerne anderledes". dr.dk (in Danish). Retrieved 2023-06-04.
- "Beretning om nye valgkredse som følge af kommunalreformen" (in Danish). Retrieved 2023-06-04.
- "Det danske valgsystem: Valg til Folketinget". valg.im (in Danish). Retrieved 2023-06-04.
- "62 Aarhus Syd". dataforsyningen.dk (in Danish). Retrieved 2023-06-04.
- "Forslag til Lov om Valg til Rigsdagen". Rigsdagstidende. 1894–95: Tillæg C, spalte 7 ff.
- "Valgresultater fra tidligere valg:". kmdvalg (in Danish). Retrieved 2023-06-04.
- "FOLKETINGSVALG TIRSDAG 1. NOVEMBER 2022". valg.im (in Danish). Retrieved 2023-06-27.
- "FOLKETINGSVALG ONSDAG 5. JUNI 2019". valg.im (in Danish). Retrieved 2023-06-27.
- "FOLKETINGSVALG TORSDAG 18. JUNI 2015". valg.im (in Danish). Retrieved 2023-06-27.
- "FOLKETINGSVALG TORSDAG 15. SEPTEMBER 2011". valg.im (in Danish). Retrieved 2023-06-27.
- "Folketingsvalget den 13. november 2007". valg.im (in Danish). Retrieved 2023-06-27.
- "valg2005.book" (PDF). valg.im (in Danish). Retrieved 2023-06-27.
- "BMTABEL" (PDF). valg.im (in Danish). Retrieved 2023-06-27.
- "VALG98" (PDF). valg.im (in Danish). Retrieved 2023-06-27.
- "VALG94" (PDF). valg.im (in Danish). Retrieved 2023-06-27.
- "VALG90" (PDF). valg.im (in Danish). Retrieved 2023-06-27.
- "Folketingsvalget den 10. maj 1988". valg.im (in Danish). Retrieved 2023-06-27.
- "Folketingsvalget den 8.september 1987". dst.dk (in Danish). Retrieved 2023-06-27.
- "Folketingsvalget den 10. januar 1984". dst.dk (in Danish). Retrieved 2023-06-27.
- "Folketingsvalget den 8. december 1981". dst.dk (in Danish). Retrieved 2023-06-27.
- "Folketingsvalget den 23. oktober 1979". dst.dk (in Danish). Retrieved 2023-06-27.
- "Folketingsvalget den 15. februar 1977". dst.dk (in Danish). Retrieved 2023-06-27.
- "Folketingsvalget den 9. januar 1975". dst.dk (in Danish). Retrieved 2023-06-27.
- "Folketingsvalget den 4. december 1973". dst.dk (in Danish). Retrieved 2023-06-27.
- "Folketingsvalget den 21. september 1971 samt folkeafstemningen". dst.dk (in Danish). Retrieved 2023-06-27.
- "Folketingsvalget den 23. januar 1968". dst.dk (in Danish). Retrieved 2023-06-27.
- "Folketingsvalget den 22. november 1966". dst.dk (in Danish). Retrieved 2023-06-27.
- "Folketingsvalget den 22. september 1964". dst.dk (in Danish). Retrieved 2023-06-27.
- "Folketingsvalget den 15. november 1960". dst.dk (in Danish). Retrieved 2023-06-27.
- "Folketingsvalget den 14. maj 1957". dst.dk (in Danish). Retrieved 2023-06-27.
- "Folketingsvalget den 22. september 1953". dst.dk (in Danish). Retrieved 2023-06-27.
- "Rigsdagsvalgene og folkeafstemningerne i april og maj 1953". dst.dk (in Danish). Retrieved 2023-06-27.
- "Folketingsvalget den 5. september 1950". dst.dk (in Danish). Retrieved 2023-06-27.
- "Folketingsvalget den 28. oktober 1947". dst.dk (in Danish). Retrieved 2023-06-27.
- "Rigsdagsvalgene i oktober og november 1945". dst.dk (in Danish). Retrieved 2023-06-27.
- "Rigsdagsvalgene i marts og april 1943". dst.dk (in Danish). Retrieved 2023-06-27.
- "Rigsdagsvalgene og Folkeafstemningen i april og maj 1939". dst.dk (in Danish). Retrieved 2023-06-27.
- "Folketingsvalget den 22. oktober 1935". dst.dk (in Danish). Retrieved 2023-06-27.
- "Folketingsvalget den 16. november 1932". dst.dk (in Danish). Retrieved 2023-06-27.
- "Folketingsvalget den 24. april 1929". dst.dk (in Danish). Retrieved 2023-06-27.
- "Folketingsvalget den 2. december 1926". dst.dk (in Danish). Retrieved 2023-06-27.
- "Folketingsvalget den 11. april 1924". dst.dk (in Danish). Retrieved 2023-06-27.
- "Rigsdagsvalgene september-oktober 1920". dst.dk (in Danish). Retrieved 2023-06-27.
- "Rigsdagsvalgene juli-august 1920". dst.dk (in Danish). Retrieved 2023-06-27.
- "Folketingsvalget den 26. april 1920". dst.dk (in Danish). Retrieved 2023-06-27.
- "EUROPA-PARLAMENTSVALG SØNDAG 26. MAJ 2019". dst.dk (in Danish). Retrieved 2023-07-01.
- "EUROPA-PARLAMENTSVALG SØNDAG 25. MAJ 2014". dst.dk (in Danish). Retrieved 2023-07-01.
- "EUROPA-PARLAMENTSVALG SØNDAG 7. JUNI 2009". dst.dk (in Danish). Retrieved 2023-07-01.
- "EUROPA-PARLAMENTSVALGET DEN 13. JUNI 2004" (PDF). im.dk (in Danish). Retrieved 2023-07-01.
- "VALGET TIL EUROPA-PARLAMENTET DEN 10. JUNI 1999" (PDF). im.dk (in Danish). Retrieved 2023-07-01.
- "VALGET TIL EUROPA-PARLAMENTET DEN 9. JUNI 1994" (PDF). im.dk (in Danish). Retrieved 2023-07-01.
- "Valget til Europa-parlamentet den 15. juni 1989". dst.dk (in Danish). Retrieved 2023-07-01.
- "Valget til Europa-Parlamentet den 14. juni 1984". dst.dk (in Danish). Retrieved 2023-07-01.
- "FOLKEAFSTEMNING ONSDAG 1. JUNI 2022". dst.dk (in Danish). Retrieved 2023-07-05.
- "FOLKEAFSTEMNING TORSDAG 3. DECEMBER 2015". dst.dk (in Danish). Retrieved 2023-07-05.
- "FOLKEAFSTEMNING SØNDAG 25. MAJ 2014". dst.dk (in Danish). Retrieved 2023-07-05.
- "FOLKEAFSTEMNING SØNDAG 7. JUNI 2009". dst.dk (in Danish). Retrieved 2023-07-05.
- "FOLKEAFSTEMNINGEN DEN 28. SEPTEMBER 2000 OM DANMARKS DELTAGELSE I DEN FÆLLES VALUTA" (PDF). valg.im (in Danish). Retrieved 2023-07-05.
- "FOLKEAFSTEMNINGEN DEN 28. MAJ 1998OM DANMARKS TILTRÆDELSE AF AMSTERDAMTRAKTATEN" (PDF). valg.im (in Danish). Retrieved 2023-07-05.
- "FOLKEAFSTEMNINGEN DEN 18. MAJ 1993 OM DANMARKS TILTRÆDELSE AF EDINBURGH-AFGØRELSEN OG MAASTRICHT-TRAKTATEN". dst.dk (in Danish). Retrieved 2023-07-05.
- "Folkeafstemningen den 1. juni 1992 om Danmarks tiltrædelse af traktaten om Den Europæiske Union". dst.dk (in Danish). Retrieved 2023-07-05.
- "Vejledende folkeafstemning torsdag den 27. februar 1986 om Danmarks tiltrædelse af EF- pakken". dst.dk (in Danish). Retrieved 2023-07-05.
- "Folkeafstemningen om Danmarks tiltrædelse af De europæiske Fælleskaber 2. oktober 1972". dst.dk (in Danish). Retrieved 2023-07-05.
- "Publikationsfortegnelse vedrørende Folkeafstemninger". dst.dk (in Danish). Retrieved 2023-07-05.
- "Publikationsfortegnelse vedrørende Folkeafstemninger". dst.dk (in Danish). Retrieved 2023-07-05.